into more homogeneous categories based primarily on annual gross sales <strong>of</strong> thefarm, major occupation <strong>of</strong> the operator, <strong>and</strong> family/nonfamily ownership <strong>of</strong> thefarm. Use <strong>of</strong> these homogeneous groups in this report enables a clearer pictureto emerge <strong>of</strong> the status <strong>of</strong> farms in the United States today. 1Two changes were made to the ERS farm classification since the previous<strong>Family</strong> <strong>Farm</strong> <strong>Report</strong> was released in 2007. First, the classification nowincorporates the refined ERS definition <strong>of</strong> “family farm,” which focuses onthe share <strong>of</strong> the farm business held by farm operators <strong>and</strong> their families. Therefined definition had a minor effect on the share <strong>of</strong> farms classified as familyfarms (see box, “What Is a <strong>Family</strong> <strong>Farm</strong>?”).1USDA’s National Agricultural StatisticsService also has released a farm classification,published in the 2007 Census <strong>of</strong>Agriculture. For more information, see“Appendix I: Comparing the Census <strong>and</strong>ERS <strong>Farm</strong> Classifications.”Second, limited-resource farms are now analyzed separately from the classification,not as a category in the classification. The USDA-wide definition<strong>of</strong> limited-resource farms—based on farm sales <strong>and</strong> operator householdincome in both the current <strong>and</strong> previous years—is inconsistent with the rest<strong>of</strong> the classification, which is based on farm sales <strong>and</strong> the operator’s occupationin the current year. This report provides more detailed informationabout limited-resource farmers by analyzing them separately. The analysisappears as a special feature, “Limited-Resource <strong>Farm</strong>ers—Who Are They?”This is the third issue <strong>of</strong> the <strong>Family</strong> <strong>Farm</strong> <strong>Report</strong> series to feature a specialtopic. Previous special features were “Multiple-Operator <strong><strong>Farm</strong>s</strong>” (Hoppe <strong>and</strong>Banker, 2006) <strong>and</strong> the “The Shift to Larger <strong><strong>Farm</strong>s</strong>” (Hoppe et al., 2007).What Is a <strong>Family</strong> <strong>Farm</strong>?There is no hard-<strong>and</strong>-fast definition <strong>of</strong> the “familyfarm.” The ideal definition would allow changes inthe way in which operators structure their farm businessesas they respond to changes in technology, themarketplace, <strong>and</strong> Government policies but still capturethe general concept <strong>of</strong> a family farm in which a familymaintains majority control <strong>and</strong> ownership.The definition <strong>of</strong> family farm used at the EconomicResearch Service (ERS) has been refined over time. Thecurrent definition—introduced in the 2005 AgriculturalResource Management Survey (ARMS)—includesany farm where the majority <strong>of</strong> the business is ownedby the operator <strong>and</strong> individuals related to the operatorby blood or marriage, including relatives who do notreside in the operator’s household. Nonfamily farmsinclude any farm where the operator <strong>and</strong> relatives donot own a majority <strong>of</strong> the business. For example, nonfamilyfarms include farms operated by publicly heldcorporations, but also farms equally owned by threeunrelated business partners, as well as farms operatedby a hired manager for a family <strong>of</strong> absentee owners.Immediately prior to the implementation <strong>of</strong> the currentdefinition, family farms were defined largely on thebasis <strong>of</strong> business organization. <strong>Family</strong> farms includedany farm organized as a sole proprietorship, partnership,or family corporation. <strong>Family</strong> farms excludedfarms organized as cooperatives or nonfamily corporations,as well as farms operated by a hired manager orheld in estates or trusts. Survey respondents, however,found the terms “family corporation” <strong>and</strong> “hiredmanager” to be ambiguous. Redesigning the definitionto focus on the ownership <strong>of</strong> the farm simplifiedthe questionnaire for respondents <strong>and</strong> made the familyfarm definition more precise.The change in the definition had a minor impact on theshare <strong>of</strong> farms classified as family farms. In 2007, 98percent <strong>of</strong> farms in ARMS were classified as familyfarms under the current definition, the same percentagetypically classified as family farms prior to 2005 underthe previous definition.Information in this box is drawn from “<strong>Family</strong> <strong>Farm</strong>” inthe ERS briefing room on <strong>Farm</strong> Household Economics<strong>and</strong> Well-Being at: www.ers.usda.gov/briefing/wellbeing/glossary.htm#familyfarm.2<strong>Structure</strong> <strong>and</strong> <strong>Finances</strong> <strong>of</strong> U.S. <strong><strong>Farm</strong>s</strong>: <strong>Family</strong> <strong>Farm</strong> <strong>Report</strong>, 2010 Edition / EIB-66Economic Research Service/USDA
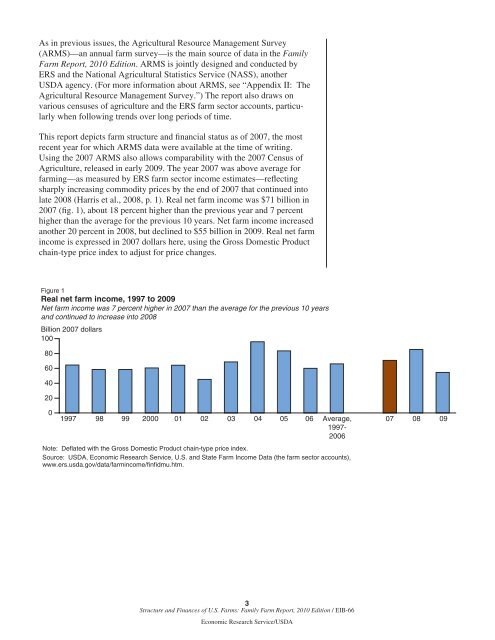
As in previous issues, the Agricultural Resource Management Survey(ARMS)—an annual farm survey—is the main source <strong>of</strong> data in the <strong>Family</strong><strong>Farm</strong> <strong>Report</strong>, 2010 Edition. ARMS is jointly designed <strong>and</strong> conducted byERS <strong>and</strong> the National Agricultural Statistics Service (NASS), anotherUSDA agency. (For more information about ARMS, see “Appendix II: TheAgricultural Resource Management Survey.”) The report also draws onvarious censuses <strong>of</strong> agriculture <strong>and</strong> the ERS farm sector accounts, particularlywhen following trends over long periods <strong>of</strong> time.This report depicts farm structure <strong>and</strong> financial status as <strong>of</strong> 2007, the mostrecent year for which ARMS data were available at the time <strong>of</strong> writing.Using the 2007 ARMS also allows comparability with the 2007 Census <strong>of</strong>Agriculture, released in early 2009. The year 2007 was above average forfarming—as measured by ERS farm sector income estimates—reflectingsharply increasing commodity prices by the end <strong>of</strong> 2007 that continued intolate 2008 (Harris et al., 2008, p. 1). Real net farm income was $71 billion in2007 (fig. 1), about 18 percent higher than the previous year <strong>and</strong> 7 percenthigher than the average for the previous 10 years. Net farm income increasedanother 20 percent in 2008, but declined to $55 billion in 2009. Real net farmincome is expressed in 2007 dollars here, using the Gross Domestic Productchain-type price index to adjust for price changes.Figure 1Real net farm income, 1997 to 2009Net farm income was 7 percent higher in 2007 than the average for the previous 10 years<strong>and</strong> continued to increase into 2008Billion 2007 dollars1008060402001997 98 99 2000 01 02 03 04 05 06 Average,1997-2006Note: Deflated with the Gross Domestic Product chain-type price index.Source: USDA, Economic Research Service, U.S. <strong>and</strong> State <strong>Farm</strong> Income Data (the farm sector accounts),www.ers.usda.gov/data/farmincome/finfidmu.htm.07 08 093<strong>Structure</strong> <strong>and</strong> <strong>Finances</strong> <strong>of</strong> U.S. <strong><strong>Farm</strong>s</strong>: <strong>Family</strong> <strong>Farm</strong> <strong>Report</strong>, 2010 Edition / EIB-66Economic Research Service/USDA