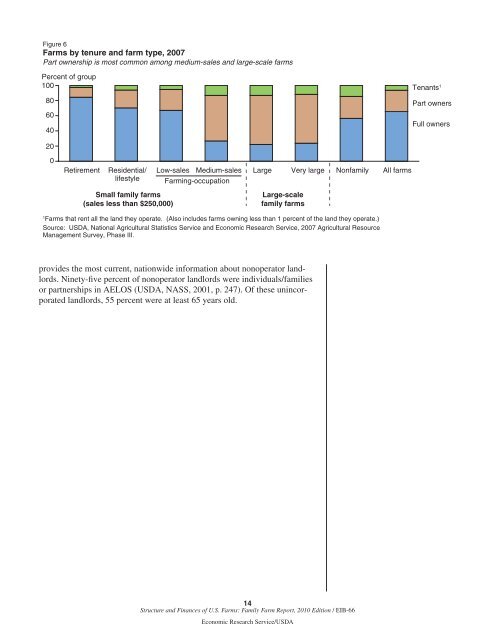
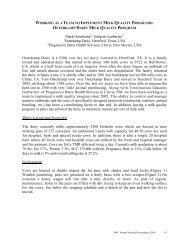
Figure 6<strong><strong>Farm</strong>s</strong> by tenure <strong>and</strong> farm type, 2007Part ownership is most common among medium-sales <strong>and</strong> large-scale farmsPercent <strong>of</strong> group100806040Tenants 1Part ownersFull owners200RetirementResidential/lifestyleSmall family farms(sales less than $250,000)Low-sales Medium-sales<strong>Farm</strong>ing-occupationLargeLarge-scalefamily farmsVery large Nonfamily All farms1<strong><strong>Farm</strong>s</strong> that rent all the l<strong>and</strong> they operate. (Also includes farms owning less than 1 percent <strong>of</strong> the l<strong>and</strong> they operate.)Source: USDA, National Agricultural Statistics Service <strong>and</strong> Economic Research Service, 2007 Agricultural ResourceManagement Survey, Phase III.provides the most current, nationwide information about nonoperator l<strong>and</strong>lords.Ninety-five percent <strong>of</strong> nonoperator l<strong>and</strong>lords were individuals/familiesor partnerships in AELOS (USDA, NASS, 2001, p. 247). Of these unincorporatedl<strong>and</strong>lords, 55 percent were at least 65 years old.14<strong>Structure</strong> <strong>and</strong> <strong>Finances</strong> <strong>of</strong> U.S. <strong><strong>Farm</strong>s</strong>: <strong>Family</strong> <strong>Farm</strong> <strong>Report</strong>, 2010 Edition / EIB-66Economic Research Service/USDA
Location <strong>of</strong> U.S. <strong><strong>Farm</strong>s</strong> <strong>and</strong> ProductionThe number <strong>and</strong> characteristics <strong>of</strong> U.S. farms vary substantially by resourceregion (see box, “Geographic Units”). The Heartl<strong>and</strong> has the most farms—436,600, or 20 percent <strong>of</strong> the U.S. total—followed by the Eastern Upl<strong>and</strong>s,with 16 percent <strong>of</strong> all farms (table 4). <strong><strong>Farm</strong>s</strong> are larger in the Heartl<strong>and</strong> thanin the Upl<strong>and</strong>s, however. About 24 percent <strong>of</strong> farms in the Heartl<strong>and</strong> arefamily farms with sales <strong>of</strong> at least $100,000, compared with only 6 percent <strong>of</strong>the farms in the Upl<strong>and</strong>s.Twenty-six percent <strong>of</strong> farms in the Northern Great Plains have sales <strong>of</strong> atleast $100,000, about the same share as in the Heartl<strong>and</strong>. The NorthernPlains, however, accounts for only 6 percent <strong>of</strong> the value <strong>of</strong> U.S. production.Agricultural production is concentrated in the Heartl<strong>and</strong> <strong>and</strong> Fruitful Rim,which together account for 46 percent <strong>of</strong> U.S. production. The Heartl<strong>and</strong> <strong>and</strong>Fruitful Rim also account for the largest shares <strong>of</strong> the Nation’s million-dollarfarms, 25 <strong>and</strong> 21 percent, respectively.Production by RegionDifferent regions concentrate on specific commodities. The Heartl<strong>and</strong> aloneaccounts for more than half the cash grains <strong>and</strong> two-thirds <strong>of</strong> the hogsproduced in the United States. The Fruitful Rim is responsible for nearlytwo-thirds <strong>of</strong> the Nation’s production <strong>of</strong> high-value crops. Two regions—thePrairie Gateway <strong>and</strong> Mississippi Portal—produce three-fifths <strong>of</strong> the cotton.The Eastern Upl<strong>and</strong>s <strong>and</strong> Southern Seaboard together account for four-fifths<strong>of</strong> tobacco <strong>and</strong> two-thirds <strong>of</strong> poultry production, while the Northern Crescent<strong>and</strong> Fruitful Rim each account for about one-third <strong>of</strong> dairy production.Some regional specializations are longst<strong>and</strong>ing <strong>and</strong> were established bythe late 1800s, reflecting local comparative advantages in the production <strong>of</strong>specific commodities (Cochran, 1993, pp. 91-92). Examples include grainproduction—particularly corn—in the Heartl<strong>and</strong> <strong>and</strong> dairy production inthe Northern Crescent. Other specializations are <strong>of</strong> more recent origin. Forexample, the 16-percent share <strong>of</strong> hog production in the Southern Seaboardreflects the expansion <strong>of</strong> hog enterprises in North Carolina in the 1980s <strong>and</strong>1990s, facilitated by the use <strong>of</strong> contracts (McBride <strong>and</strong> Key, 2003, p. 19).Metropolitan <strong>Farm</strong>ing<strong>Farm</strong>ing is popularly viewed as taking place in rural areas (Gale <strong>and</strong>Harrington, 1993, p. 5). Nevertheless, 39 percent <strong>of</strong> U.S. farms are locatedin metropolitan (metro) areas (table 5), defined as a county or group <strong>of</strong>counties with an urban population concentration <strong>of</strong> at least 50,000 people(see box, “Geographic Units”). 4 Metro areas provide both opportunities <strong>and</strong>problems for farms (Heimlich <strong>and</strong> Anderson, 2001, pp. 38-44). For example,farmers may have opportunities to produce <strong>and</strong> sell high-value crops throughfarmers’ markets. Proximity to employment in the metropolitan core mightprovide members <strong>of</strong> farm families with opportunities to work <strong>of</strong>f-farm. Onthe other h<strong>and</strong>, markets for traditional field crops could be reduced as morel<strong>and</strong> is developed. Grain elevators, for example, might go out <strong>of</strong> business.Real estate taxes may increase as l<strong>and</strong> prices rise to reflect the value <strong>of</strong> thel<strong>and</strong> in nonfarm uses.15<strong>Structure</strong> <strong>and</strong> <strong>Finances</strong> <strong>of</strong> U.S. <strong><strong>Farm</strong>s</strong>: <strong>Family</strong> <strong>Farm</strong> <strong>Report</strong>, 2010 Edition / EIB-66Economic Research Service/USDA4According to the <strong>of</strong>ficial U.S. CensusBureau definition, rural areas include theopen countryside plus settlements withfewer than 2,500 inhabitants. Urban areashave larger populations <strong>and</strong> include thedensely settled areas around them. Nevertheless,researchers who follow conditionsin rural areas <strong>and</strong> compare them with conditionsin urban areas <strong>of</strong>ten use nonmetrocounties to represent rural areas <strong>and</strong> metrocounties to represent urban areas becauseannual data are available for counties.This report also follows the convention <strong>of</strong>using metro <strong>and</strong> nonmetro designations,since the rural <strong>and</strong> urban designations arenot available in the Agricultural ResourceManagement Survey. (For more information,see “Measuring Rurality: What isRural?” on the ERS website atwww.ers.usda.gov/briefing/rurality/whatisrural/.)