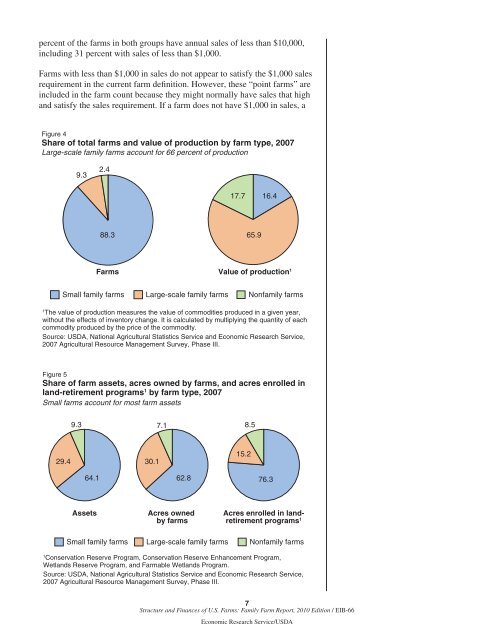
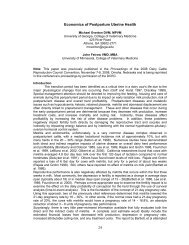
Table 1<strong><strong>Farm</strong>s</strong>, l<strong>and</strong> in farms, <strong>and</strong> sales, 1978 <strong>and</strong> 2007YearPct. changeItem 1978 2007 (annualized)<strong><strong>Farm</strong>s</strong> (number) 2,476,340 2,204,792 -0.6L<strong>and</strong> in farms (million acres) 973.7 922.1 -0.3Market value <strong>of</strong> agriculturalproducts sold (billion 2007 dollars) 1 176.3 297.2 2.8Notes: Abnormal farms—defined as institutional, experimental, <strong>and</strong> research farms—are excluded.The count <strong>of</strong> farms from the census is slightly higher than the count from the AgriculturalResource Management Survey (ARMS) because the census includes farms in Alaska <strong>and</strong>Hawaii while ARMS excludes them. For more information, see Appendix II.1Sales are expressed in constant 2007 dollars, using the Producer Price Index for <strong>Farm</strong> Productsto adjust for farm prices. Sales exclude Government payments.Source: USDA, Economic Research Service, compiled from Census <strong>of</strong> Agriculture data (U.S.Department <strong>of</strong> Commerce, U.S. Census Bureau, 1981; USDA, National Agricultural StatisticsService, 2009).Share <strong>of</strong> <strong><strong>Farm</strong>s</strong>, Production, <strong>and</strong> AssetsThree features <strong>of</strong> U.S. farm structure st<strong>and</strong> out (fig. 4). First, small familyfarms make up 88 percent <strong>of</strong> all U.S. farms. Second, large-scale familyfarms—only 9 percent <strong>of</strong> all farms—account for a disproportionately large,66-percent share <strong>of</strong> the value <strong>of</strong> production. Third, farming is still an industry<strong>of</strong> family businesses. Ninety-eight percent <strong>of</strong> farms are family farms, <strong>and</strong>they account for 82 percent <strong>of</strong> production. Only 2 percent <strong>of</strong> U.S farms arenonfamily farms, accounting for the remaining 18 percent <strong>of</strong> production.Despite their 16-percent share <strong>of</strong> total farm production, small farms producea larger share <strong>of</strong> specific commodities: 23 percent <strong>of</strong> the value <strong>of</strong> productionfor cash grains <strong>and</strong> soybeans, 51 percent for hay, 34 percent for tobacco, <strong>and</strong>22 percent for beef. At the other extreme, small farms contribute a minisculeshare to the value <strong>of</strong> production for hogs (5 percent) <strong>and</strong> poultry (3 percent).The largest share <strong>of</strong> small-farm production occurs among medium-salesfarms, which account for 7 percent <strong>of</strong> total U.S. production. 2The share <strong>of</strong> assets <strong>and</strong> l<strong>and</strong> held by small farms is also substantially morethan indicated by their small share <strong>of</strong> production. Small farms hold 64percent <strong>of</strong> all farm assets, including 63 percent <strong>of</strong> the l<strong>and</strong> owned by farms(fig. 5). Because <strong>of</strong> their large l<strong>and</strong> holdings—in aggregate—small farms areimportant in conservation efforts. Small farms account for 76 percent <strong>of</strong> thel<strong>and</strong> farmers enroll in USDA l<strong>and</strong>-retirement programs: the ConservationReserve Program (CRP), the Conservation Reserve Enhancement Program(CREP), the Wetl<strong>and</strong>s Reserve Program (WRP), <strong>and</strong> the <strong>Farm</strong>able Wetl<strong>and</strong>sProgram (FWP).<strong>Farm</strong> SizeVariation in farm size—whether measured in sales, acres, or labor use—helps explain the distribution <strong>of</strong> agricultural production. The 1.4 millionretirement <strong>and</strong> residential/lifestyle farms account for only 6 percent <strong>of</strong>production because most <strong>of</strong> these farms are very small (table 2). Seventy-six2This report measures farm size usinggross farm sales, or the revenue associatedwith all the production <strong>of</strong> the farm,including the production accruing toshare l<strong>and</strong>lords <strong>and</strong> contractors. Othermeasures <strong>of</strong> sales exist, however, <strong>and</strong> thesmall-farm share <strong>of</strong> the value <strong>of</strong> productiondepends on the sales measure used.For example, if the measure used is grosscash farm income (GCFI)—total revenuereceived by the farm business alone—thesmall-farm share <strong>of</strong> production increasesto 22 percent. This increase is mostlydue to an expansion <strong>of</strong> the number <strong>of</strong>poultry farms classified as small whenGCFI is used. For more information, seeHoppe et al. (2010, pp. 3-4).6<strong>Structure</strong> <strong>and</strong> <strong>Finances</strong> <strong>of</strong> U.S. <strong><strong>Farm</strong>s</strong>: <strong>Family</strong> <strong>Farm</strong> <strong>Report</strong>, 2010 Edition / EIB-66Economic Research Service/USDA
percent <strong>of</strong> the farms in both groups have annual sales <strong>of</strong> less than $10,000,including 31 percent with sales <strong>of</strong> less than $1,000.<strong><strong>Farm</strong>s</strong> with less than $1,000 in sales do not appear to satisfy the $1,000 salesrequirement in the current farm definition. However, these “point farms” areincluded in the farm count because they might normally have sales that high<strong>and</strong> satisfy the sales requirement. If a farm does not have $1,000 in sales, aFigure 4Share <strong>of</strong> total farms <strong>and</strong> value <strong>of</strong> production by farm type, 2007Large-scale family farms account for 66 percent <strong>of</strong> production9.32.417.716.488.365.9<strong><strong>Farm</strong>s</strong> Value <strong>of</strong> production 1Small family farms Large-scale family farms Nonfamily farms1The value <strong>of</strong> production measures the value <strong>of</strong> commodities produced in a given year,without the effects <strong>of</strong> inventory change. It is calculated by multiplying the quantity <strong>of</strong> eachcommodity produced by the price <strong>of</strong> the commodity.Source: USDA, National Agricultural Statistics Service <strong>and</strong> Economic Research Service,2007 Agricultural Resource Management Survey, Phase III.Figure 5Share <strong>of</strong> farm assets, acres owned by farms, <strong>and</strong> acres enrolled inl<strong>and</strong>-retirement programs 1 by farm type, 2007Small farms account for most farm assets9.37.18.529.430.115.264.162.876.3AssetsAcres ownedby farmsAcres enrolled in l<strong>and</strong>retirementprograms 1Small family farms Large-scale family farms Nonfamily farms1Conservation Reserve Program, Conservation Reserve Enhancement Program,Wetl<strong>and</strong>s Reserve Program, <strong>and</strong> <strong>Farm</strong>able Wetl<strong>and</strong>s Program.Source: USDA, National Agricultural Statistics Service <strong>and</strong> Economic Research Service,2007 Agricultural Resource Management Survey, Phase III.7<strong>Structure</strong> <strong>and</strong> <strong>Finances</strong> <strong>of</strong> U.S. <strong><strong>Farm</strong>s</strong>: <strong>Family</strong> <strong>Farm</strong> <strong>Report</strong>, 2010 Edition / EIB-66Economic Research Service/USDA