Structure and Finances of U.S. Farms: Family Farm Report ... - AgWeb
Structure and Finances of U.S. Farms: Family Farm Report ... - AgWeb
Structure and Finances of U.S. Farms: Family Farm Report ... - AgWeb
Create successful ePaper yourself
Turn your PDF publications into a flip-book with our unique Google optimized e-Paper software.
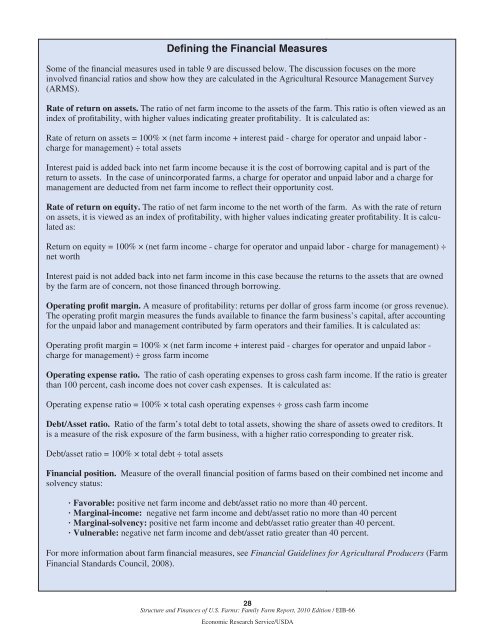
Defining the Financial MeasuresSome <strong>of</strong> the financial measures used in table 9 are discussed below. The discussion focuses on the moreinvolved financial ratios <strong>and</strong> show how they are calculated in the Agricultural Resource Management Survey(ARMS).Rate <strong>of</strong> return on assets. The ratio <strong>of</strong> net farm income to the assets <strong>of</strong> the farm. This ratio is <strong>of</strong>ten viewed as anindex <strong>of</strong> pr<strong>of</strong>itability, with higher values indicating greater pr<strong>of</strong>itability. It is calculated as:Rate <strong>of</strong> return on assets = 100% × (net farm income + interest paid - charge for operator <strong>and</strong> unpaid labor -charge for management) ÷ total assetsInterest paid is added back into net farm income because it is the cost <strong>of</strong> borrowing capital <strong>and</strong> is part <strong>of</strong> thereturn to assets. In the case <strong>of</strong> unincorporated farms, a charge for operator <strong>and</strong> unpaid labor <strong>and</strong> a charge formanagement are deducted from net farm income to reflect their opportunity cost.Rate <strong>of</strong> return on equity. The ratio <strong>of</strong> net farm income to the net worth <strong>of</strong> the farm. As with the rate <strong>of</strong> returnon assets, it is viewed as an index <strong>of</strong> pr<strong>of</strong>itability, with higher values indicating greater pr<strong>of</strong>itability. It is calculatedas:Return on equity = 100% × (net farm income - charge for operator <strong>and</strong> unpaid labor - charge for management) ÷net worthInterest paid is not added back into net farm income in this case because the returns to the assets that are ownedby the farm are <strong>of</strong> concern, not those financed through borrowing.Operating pr<strong>of</strong>it margin. A measure <strong>of</strong> pr<strong>of</strong>itability: returns per dollar <strong>of</strong> gross farm income (or gross revenue).The operating pr<strong>of</strong>it margin measures the funds available to finance the farm business’s capital, after accountingfor the unpaid labor <strong>and</strong> management contributed by farm operators <strong>and</strong> their families. It is calculated as:Operating pr<strong>of</strong>it margin = 100% × (net farm income + interest paid - charges for operator <strong>and</strong> unpaid labor -charge for management) ÷ gross farm incomeOperating expense ratio. The ratio <strong>of</strong> cash operating expenses to gross cash farm income. If the ratio is greaterthan 100 percent, cash income does not cover cash expenses. It is calculated as:Operating expense ratio = 100% × total cash operating expenses ÷ gross cash farm incomeDebt/Asset ratio. Ratio <strong>of</strong> the farm’s total debt to total assets, showing the share <strong>of</strong> assets owed to creditors. Itis a measure <strong>of</strong> the risk exposure <strong>of</strong> the farm business, with a higher ratio corresponding to greater risk.Debt/asset ratio = 100% × total debt ÷ total assetsFinancial position. Measure <strong>of</strong> the overall financial position <strong>of</strong> farms based on their combined net income <strong>and</strong>solvency status:· Favorable: positive net farm income <strong>and</strong> debt/asset ratio no more than 40 percent.· Marginal-income: negative net farm income <strong>and</strong> debt/asset ratio no more than 40 percent· Marginal-solvency: positive net farm income <strong>and</strong> debt/asset ratio greater than 40 percent.· Vulnerable: negative net farm income <strong>and</strong> debt/asset ratio greater than 40 percent.For more information about farm financial measures, see Financial Guidelines for Agricultural Producers (<strong>Farm</strong>Financial St<strong>and</strong>ards Council, 2008).28<strong>Structure</strong> <strong>and</strong> <strong>Finances</strong> <strong>of</strong> U.S. <strong><strong>Farm</strong>s</strong>: <strong>Family</strong> <strong>Farm</strong> <strong>Report</strong>, 2010 Edition / EIB-66Economic Research Service/USDA


