Structure and Finances of U.S. Farms: Family Farm Report ... - AgWeb
Structure and Finances of U.S. Farms: Family Farm Report ... - AgWeb
Structure and Finances of U.S. Farms: Family Farm Report ... - AgWeb

Create successful ePaper yourself
Turn your PDF publications into a flip-book with our unique Google optimized e-Paper software.
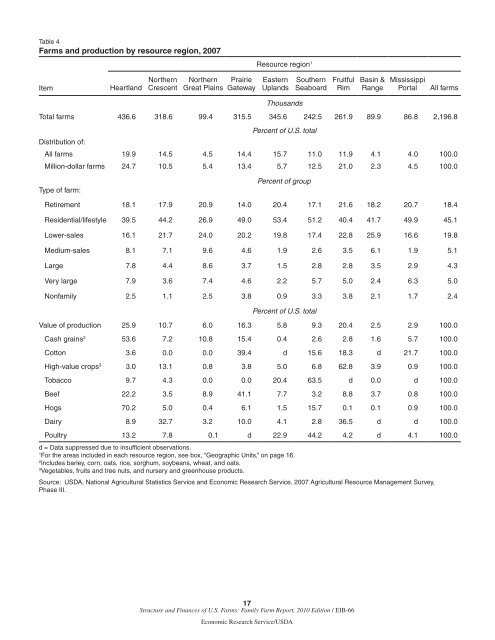
Table 4<strong><strong>Farm</strong>s</strong> <strong>and</strong> production by resource region, 2007Resource region 1ItemHeartl<strong>and</strong>NorthernCrescentNorthernGreat PlainsPrairieGatewayEasternUpl<strong>and</strong>sSouthernSeaboardFruitfulRimBasin &RangeMississippiPortalAll farmsThous<strong>and</strong>sTotal farms 436.6 318.6 99.4 315.5 345.6 242.5 261.9 89.9 86.8 2,196.8Percent <strong>of</strong> U.S. totalDistribution <strong>of</strong>:All farms 19.9 14.5 4.5 14.4 15.7 11.0 11.9 4.1 4.0 100.0Million-dollar farms 24.7 10.5 5.4 13.4 5.7 12.5 21.0 2.3 4.5 100.0Type <strong>of</strong> farm:Percent <strong>of</strong> groupRetirement 18.1 17.9 20.9 14.0 20.4 17.1 21.6 18.2 20.7 18.4Residential/lifestyle 39.5 44.2 26.9 49.0 53.4 51.2 40.4 41.7 49.9 45.1Lower-sales 16.1 21.7 24.0 20.2 19.8 17.4 22.8 25.9 16.6 19.8Medium-sales 8.1 7.1 9.6 4.6 1.9 2.6 3.5 6.1 1.9 5.1Large 7.8 4.4 8.6 3.7 1.5 2.8 2.8 3.5 2.9 4.3Very large 7.9 3.6 7.4 4.6 2.2 5.7 5.0 2.4 6.3 5.0Nonfamily 2.5 1.1 2.5 3.8 0.9 3.3 3.8 2.1 1.7 2.4Percent <strong>of</strong> U.S. totalValue <strong>of</strong> production 25.9 10.7 6.0 16.3 5.8 9.3 20.4 2.5 2.9 100.0Cash grains 2 53.6 7.2 10.8 15.4 0.4 2.6 2.8 1.6 5.7 100.0Cotton 3.6 0.0 0.0 39.4 d 15.6 18.3 d 21.7 100.0High-value crops 3 3.0 13.1 0.8 3.8 5.0 6.8 62.8 3.9 0.9 100.0Tobacco 9.7 4.3 0.0 0.0 20.4 63.5 d 0.0 d 100.0Beef 22.2 3.5 8.9 41.1 7.7 3.2 8.8 3.7 0.8 100.0Hogs 70.2 5.0 0.4 6.1 1.5 15.7 0.1 0.1 0.9 100.0Dairy 8.9 32.7 3.2 10.0 4.1 2.8 36.5 d d 100.0Poultry 13.2 7.8 0.1 d 22.9 44.2 4.2 d 4.1 100.0d = Data suppressed due to insufficient observations.1For the areas included in each resource region, see box, “Geographic Units,” on page 16.2Includes barley, corn, oats, rice, sorghum, soybeans, wheat, <strong>and</strong> oats.3Vegetables, fruits <strong>and</strong> tree nuts, <strong>and</strong> nursery <strong>and</strong> greenhouse products.Source: USDA, National Agricultural Statistics Service <strong>and</strong> Economic Research Service, 2007 Agricultural Resource Management Survey,Phase III.17<strong>Structure</strong> <strong>and</strong> <strong>Finances</strong> <strong>of</strong> U.S. <strong><strong>Farm</strong>s</strong>: <strong>Family</strong> <strong>Farm</strong> <strong>Report</strong>, 2010 Edition / EIB-66Economic Research Service/USDA