Million-Dollar <strong><strong>Farm</strong>s</strong>Approximately 47,600 U.S. farms have annual sales <strong>of</strong> $1 million or more. Most million-dollar farmshave annual sales between $1 million <strong>and</strong> $4,999,999, but 11 percent—5,200 farms—sell at least $5million. A large majority <strong>of</strong> million-dollar farms (86 percent) are family farms. <strong>Family</strong> farms account fora smaller share (64 percent) <strong>of</strong> farms with annual sales over $5 million.Million-dollar farms make up about 2 percent <strong>of</strong> all U.S. farms, but they account for 53 percent <strong>of</strong> thevalue <strong>of</strong> production (see figure). They also produce approximately 60 to 70 percent <strong>of</strong> high-value crops,hogs, dairy, poultry, <strong>and</strong> beef. The largest million-dollar farms—those with sales <strong>of</strong> at least $5 million—account for 35 to 45 percent <strong>of</strong> beef (largely in feedlots), milk, <strong>and</strong> high-value crops.As one might expect from the figure, 71 percent <strong>of</strong> farms with more than $5 million in sales specializein beef (largely in feedlots), high-value crops, or dairy. The prevalence <strong>of</strong> these specializations among$5 million farms suggests economies <strong>of</strong> scale persist in the production <strong>of</strong> high-value crops, finished beefcattle, <strong>and</strong> milk, even when annual sales pass $5 million.Consider dairy production, for example. Costs <strong>of</strong> production fall rapidly with herd size. Total costs perhundredweight for farms with 1,000 or more cows—which includes $5 million dairies—are less than halfthose for farms with fewer than 50 cows (see table). The biggest cost advantages for large dairies are inoverhead costs, since these operations can use capital <strong>and</strong> labor more intensively (MacDonald et al., 2007,p. 32).Note that gross farm sales is used to measure farm size in this report. <strong>Farm</strong> size, however, could bemeasured in terms <strong>of</strong> gross cash farm income (GCFI) or the gross revenue <strong>of</strong> the farm. The main differencebetween the two measures is that the gross value <strong>of</strong> sales includes the value <strong>of</strong> commodities removedunder production contracts, while GCFI excludes these removals, since the contractor—rather than thefarm—owns the commodity under production.Value <strong>of</strong> production <strong>of</strong> selected commodities by sales class, 2007Percent <strong>of</strong> sales1009080706050403020100High-valuecrops 1Hogs Dairy Poultry BeefTotal U.S.productionSales class:$5,000,000or more$1,000,000 to$4,999,999$500,000 to$999,999$250,000 to$499,999Less than$250,0001Vegetables, fruits <strong>and</strong> tree nuts, <strong>and</strong> nursery <strong>and</strong> greenhouse products.Source: USDA, National Agricultural Statistics Service <strong>and</strong> Economic Research Service,2007 Agricultural Resource Management Survey, Phase III.10<strong>Structure</strong> <strong>and</strong> <strong>Finances</strong> <strong>of</strong> U.S. <strong><strong>Farm</strong>s</strong>: <strong>Family</strong> <strong>Farm</strong> <strong>Report</strong>, 2010 Edition / EIB-66Economic Research Service/USDA
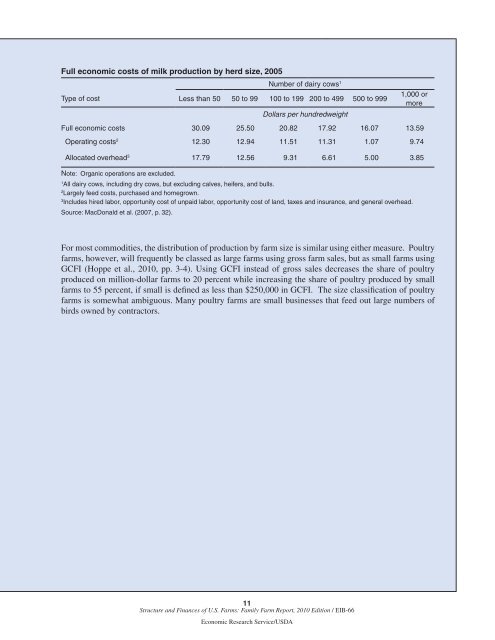
Full economic costs <strong>of</strong> milk production by herd size, 2005Number <strong>of</strong> dairy cows 1Type <strong>of</strong> cost Less than 50 50 to 99 100 to 199 200 to 499 500 to 999Dollars per hundredweight1,000 ormoreFull economic costs 30.09 25.50 20.82 17.92 16.07 13.59Operating costs 2 12.30 12.94 11.51 11.31 1.07 9.74Allocated overhead 3 17.79 12.56 9.31 6.61 5.00 3.85Note: Organic operations are excluded.1All dairy cows, including dry cows, but excluding calves, heifers, <strong>and</strong> bulls.2Largely feed costs, purchased <strong>and</strong> homegrown.3Includes hired labor, opportunity cost <strong>of</strong> unpaid labor, opportunity cost <strong>of</strong> l<strong>and</strong>, taxes <strong>and</strong> insurance, <strong>and</strong> general overhead.Source: MacDonald et al. (2007, p. 32).For most commodities, the distribution <strong>of</strong> production by farm size is similar using either measure. Poultryfarms, however, will frequently be classed as large farms using gross farm sales, but as small farms usingGCFI (Hoppe et al., 2010, pp. 3-4). Using GCFI instead <strong>of</strong> gross sales decreases the share <strong>of</strong> poultryproduced on million-dollar farms to 20 percent while increasing the share <strong>of</strong> poultry produced by smallfarms to 55 percent, if small is defined as less than $250,000 in GCFI. The size classification <strong>of</strong> poultryfarms is somewhat ambiguous. Many poultry farms are small businesses that feed out large numbers <strong>of</strong>birds owned by contractors.11<strong>Structure</strong> <strong>and</strong> <strong>Finances</strong> <strong>of</strong> U.S. <strong><strong>Farm</strong>s</strong>: <strong>Family</strong> <strong>Farm</strong> <strong>Report</strong>, 2010 Edition / EIB-66Economic Research Service/USDA