Structure and Finances of U.S. Farms: Family Farm Report ... - AgWeb
Structure and Finances of U.S. Farms: Family Farm Report ... - AgWeb
Structure and Finances of U.S. Farms: Family Farm Report ... - AgWeb
You also want an ePaper? Increase the reach of your titles
YUMPU automatically turns print PDFs into web optimized ePapers that Google loves.
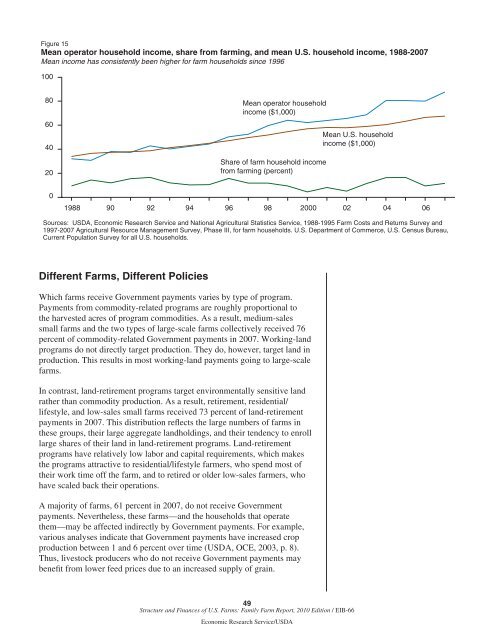
Figure 15Mean operator household income, share from farming, <strong>and</strong> mean U.S. household income, 1988-2007Mean income has consistently been higher for farm households since 199610080604020Mean operator householdincome ($1,000)Share <strong>of</strong> farm household incomefrom farming (percent)Mean U.S. householdincome ($1,000)01988 90 92 94 96 98 2000 02 04 06Sources: USDA, Economic Research Service <strong>and</strong> National Agricultural Statistics Service, 1988-1995 <strong>Farm</strong> Costs <strong>and</strong> Returns Survey <strong>and</strong>1997-2007 Agricultural Resource Management Survey, Phase III, for farm households. U.S. Department <strong>of</strong> Commerce, U.S. Census Bureau,Current Population Survey for all U.S. households.Different <strong><strong>Farm</strong>s</strong>, Different PoliciesWhich farms receive Government payments varies by type <strong>of</strong> program.Payments from commodity-related programs are roughly proportional tothe harvested acres <strong>of</strong> program commodities. As a result, medium-salessmall farms <strong>and</strong> the two types <strong>of</strong> large-scale farms collectively received 76percent <strong>of</strong> commodity-related Government payments in 2007. Working-l<strong>and</strong>programs do not directly target production. They do, however, target l<strong>and</strong> inproduction. This results in most working-l<strong>and</strong> payments going to large-scalefarms.In contrast, l<strong>and</strong>-retirement programs target environmentally sensitive l<strong>and</strong>rather than commodity production. As a result, retirement, residential/lifestyle, <strong>and</strong> low-sales small farms received 73 percent <strong>of</strong> l<strong>and</strong>-retirementpayments in 2007. This distribution reflects the large numbers <strong>of</strong> farms inthese groups, their large aggregate l<strong>and</strong>holdings, <strong>and</strong> their tendency to enrolllarge shares <strong>of</strong> their l<strong>and</strong> in l<strong>and</strong>-retirement programs. L<strong>and</strong>-retirementprograms have relatively low labor <strong>and</strong> capital requirements, which makesthe programs attractive to residential/lifestyle farmers, who spend most <strong>of</strong>their work time <strong>of</strong>f the farm, <strong>and</strong> to retired or older low-sales farmers, whohave scaled back their operations.A majority <strong>of</strong> farms, 61 percent in 2007, do not receive Governmentpayments. Nevertheless, these farms—<strong>and</strong> the households that operatethem—may be affected indirectly by Government payments. For example,various analyses indicate that Government payments have increased cropproduction between 1 <strong>and</strong> 6 percent over time (USDA, OCE, 2003, p. 8).Thus, livestock producers who do not receive Government payments maybenefit from lower feed prices due to an increased supply <strong>of</strong> grain.49<strong>Structure</strong> <strong>and</strong> <strong>Finances</strong> <strong>of</strong> U.S. <strong><strong>Farm</strong>s</strong>: <strong>Family</strong> <strong>Farm</strong> <strong>Report</strong>, 2010 Edition / EIB-66Economic Research Service/USDA


