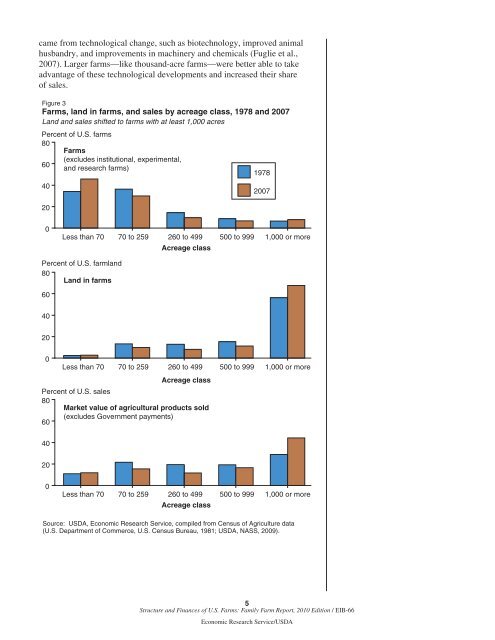
U.S. <strong><strong>Farm</strong>s</strong>: Numbers, Size, <strong>and</strong>Other CharacteristicsAfter peaking at 6.8 million farms in 1935, the number <strong>of</strong> U.S. farms fellsharply until the early 1970s (fig. 2). Falling farm numbers during this periodreflect growing productivity in agriculture <strong>and</strong> increased nonfarm employmentopportunities (Hoppe, et al., 2007, p. 4). Growing productivity led toexcess capacity in agriculture, farm consolidation, <strong>and</strong> farm operators leavingfarming to work in the nonfarm economy. The decline in farm numbersslowed in the 1980s <strong>and</strong> essentially stopped in the 1990s.The greater stability in farm numbers, however, masks shifts in the sizedistribution <strong>of</strong> farms. For example, though farm numbers stabilized from1978 to 2007, the number <strong>of</strong> farms operating fewer than 70 acres increased12 percentage points, the number <strong>of</strong> “thous<strong>and</strong>-acre farms” increased 1percentage point, <strong>and</strong> the number <strong>of</strong> farms in all acreage classes in betweendecreased (fig. 3, top panel). The shift to farms with more than 1,000 acresis more marked when examined in terms <strong>of</strong> these operations’ l<strong>and</strong> in farms(up 12 percentage points) or market value <strong>of</strong> sales (up 15 percentage points)(middle <strong>and</strong> bottom panel, respectively). Note that farms do not necessarilyown all the l<strong>and</strong> they operate; they can also rent l<strong>and</strong>. For example, a farmoperating 1,000 acres could own 500 acres <strong>and</strong> rent 500 acres, or even ownno l<strong>and</strong> at all <strong>and</strong> rent 1,000 acres.The shifts in farms <strong>and</strong> acres among acreage classes between 1978 <strong>and</strong> 2007are reallocations <strong>of</strong> a fairly stable farm count <strong>and</strong> total acres <strong>of</strong> farml<strong>and</strong>(table 1). Sales grew more rapidly during the period, however, reflectingmore output per hour <strong>of</strong> labor. A recent ERS study found that two-thirds<strong>of</strong> the growth in U.S. agricultural output per hour between 1981 <strong>and</strong> 2004Figure 2<strong><strong>Farm</strong>s</strong>, l<strong>and</strong> in farms, <strong>and</strong> average acres per farm, 1850-2007Most <strong>of</strong> the decline in farms occurred between 1935 <strong>and</strong> 19748<strong><strong>Farm</strong>s</strong> (millions)7Acres per farm (hundred acres)6L<strong>and</strong> in farms (billion acres)5432101850 70 90 1910 25 35 45 54 64 74 82 92 2002Census yearNote: The break in the lines after 1974 reflects the introduction <strong>of</strong> an adjustment to estimates <strong>of</strong> the farm count <strong>and</strong> l<strong>and</strong> in farms. Beginningin 1978, the data are adjusted to compensate for undercoverage by the Census <strong>of</strong> Agriculture. For more information, see Allen (2004).Source: USDA, Economic Research Service, compiled from Census <strong>of</strong> Agriculture data.4<strong>Structure</strong> <strong>and</strong> <strong>Finances</strong> <strong>of</strong> U.S. <strong><strong>Farm</strong>s</strong>: <strong>Family</strong> <strong>Farm</strong> <strong>Report</strong>, 2010 Edition / EIB-66Economic Research Service/USDA
came from technological change, such as biotechnology, improved animalhusb<strong>and</strong>ry, <strong>and</strong> improvements in machinery <strong>and</strong> chemicals (Fuglie et al.,2007). Larger farms—like thous<strong>and</strong>-acre farms—were better able to takeadvantage <strong>of</strong> these technological developments <strong>and</strong> increased their share<strong>of</strong> sales.Figure 3<strong><strong>Farm</strong>s</strong>, l<strong>and</strong> in farms, <strong>and</strong> sales by acreage class, 1978 <strong>and</strong> 2007L<strong>and</strong> <strong>and</strong> sales shifted to farms with at least 1,000 acresPercent <strong>of</strong> U.S. farms80<strong><strong>Farm</strong>s</strong>(excludes institutional, experimental,60<strong>and</strong> research farms)4020197820070Less than 70 70 to 259 260 to 499 500 to 999 1,000 or moreAcreage classPercent <strong>of</strong> U.S. farml<strong>and</strong>80L<strong>and</strong> in farms6040200Less than 70 70 to 259 260 to 499 500 to 999 1,000 or moreAcreage classPercent <strong>of</strong> U.S. sales80Market value <strong>of</strong> agricultural products sold(excludes Government payments)6040200Less than 70 70 to 259 260 to 499 500 to 999 1,000 or moreAcreage classSource: USDA, Economic Research Service, compiled from Census <strong>of</strong> Agriculture data(U.S. Department <strong>of</strong> Commerce, U.S. Census Bureau, 1981; USDA, NASS, 2009).5<strong>Structure</strong> <strong>and</strong> <strong>Finances</strong> <strong>of</strong> U.S. <strong><strong>Farm</strong>s</strong>: <strong>Family</strong> <strong>Farm</strong> <strong>Report</strong>, 2010 Edition / EIB-66Economic Research Service/USDA