- Page 1 and 2: European uropean GNSS (Galileo) Ope
- Page 3 and 4: and/or standardisation purposes acc
- Page 5 and 6: Table of Contents 1. Introduction .
- Page 7 and 8: C.3. Primary Codes for the E5a-I Co
- Page 9 and 10: List of Tables Table 1. Carrier Fre
- Page 11 and 12: 1. Introduction 1.1. Document Scope
- Page 13 and 14: 2.1.3. Receiver Reference Bandwidth
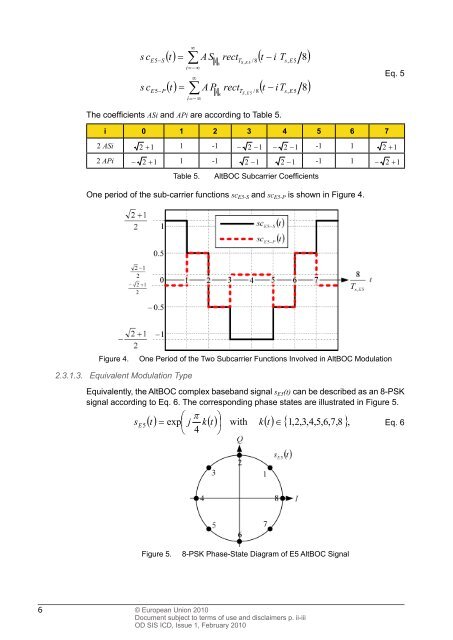
- Page 15: e e e e E5a �I E5a �Q E5b� I
- Page 19 and 20: Component (Parameter Y) Sub-carrier
- Page 21 and 22: For purposes of establishing user r
- Page 23 and 24: 3.3. Primary Codes Generation The p
- Page 25 and 26: Code No Start Value Initial Sequenc
- Page 27 and 28: Code No Table 17. Base Register 2 S
- Page 29 and 30: Code Identifi er Code Length No. of
- Page 31 and 32: Code Identifi er Code Length No. of
- Page 33 and 34: SVID E5a-I E5a-Q E5b-I E5b-Q 27 E5a
- Page 35 and 36: SVID E5a-I E5a-Q E5b-I E5b-Q 21 CS2
- Page 37 and 38: 4.1.4. FEC Coding and Interleaving
- Page 39 and 40: 4.2.3. F/NAV Frame Layout The F/NAV
- Page 41 and 42: Subframe 12 4.2.4. F/NAV Page Conte
- Page 43 and 44: Figure 15. I/NAV Message Structure
- Page 45 and 46: Even/odd=0 Page Type E5b-I E1-B Res
- Page 47 and 48: 4.3.4. I/NAV Nominal Frame Layout T
- Page 49 and 50: Word Type 3: Ephemeris (3/4) and SI
- Page 51 and 52: Even/odd=0 Page Type E5b-I E1-B Dum
- Page 53 and 54: Start bit = 1 Part (5/8) Part (6/8)
- Page 55 and 56: Parameter Defi nition Bits Scale fa
- Page 57 and 58: leap seconds. Since the next leap s
- Page 59 and 60: Parameter Defi nition Bits Scale fa
- Page 61 and 62: Parameter Defi nition Bits Scale fa
- Page 63 and 64: Parameter Defi nition Bits Scale fa
- Page 65 and 66: Table 79. Almanac Parameters * Para
- Page 67 and 68:
7. Annex B - Defi nitions and Nomen
- Page 69 and 70:
59 Component Primary Code Length (c
- Page 71 and 72:
4BBCEA32E5B5D0EED15F88BF5D96D058E6D
- Page 73 and 74:
D2B53363A548E6476647C10F55611469828
- Page 75 and 76:
2768ECABBFBEE87FBF1DAA992C8439602B1
- Page 77 and 78:
E 1 9 C 6 9 C 3 8 6 8 C 7 5 0 7 D 0
- Page 79 and 80:
16BAF1D9361126F3514557403415F286C8E
- Page 81 and 82:
B0A1427F7EFC07EFCC62DDC5455A77B57D3
- Page 83 and 84:
9FA64FB70902BA09988A30697F110B892D7
- Page 85 and 86:
1DCB6C9F0F7C5E57BD0A7875D4B2D8E31AE
- Page 87 and 88:
77 © European Union 2010 Document
- Page 89 and 90:
79 © European Union 2010 Document
- Page 91 and 92:
81 © European Union 2010 Document
- Page 93 and 94:
83 © European Union 2010 Document
- Page 95 and 96:
85 © European Union 2010 Document
- Page 97 and 98:
87 © European Union 2010 Document
- Page 99 and 100:
89 © European Union 2010 Document
- Page 101 and 102:
91 © European Union 2010 Document
- Page 103 and 104:
93 © European Union 2010 Document
- Page 105 and 106:
95 © European Union 2010 Document
- Page 107 and 108:
97 © European Union 2010 Document
- Page 109 and 110:
99 © European Union 2010 Document
- Page 111 and 112:
101 © European Union 2010 Document
- Page 113 and 114:
103 © European Union 2010 Document
- Page 115 and 116:
105 © European Union 2010 Document
- Page 117 and 118:
107 © European Union 2010 Document
- Page 119 and 120:
1 7 E 2 B E 3 7 F 8 E B C 0 4 9 C F
- Page 121 and 122:
111 © European Union 2010 Document
- Page 123 and 124:
113 © European Union 2010 Document
- Page 125 and 126:
115 © European Union 2010 Document
- Page 127 and 128:
117 © European Union 2010 Document
- Page 129 and 130:
119 © European Union 2010 Document
- Page 131 and 132:
121 © European Union 2010 Document
- Page 133 and 134:
123 © European Union 2010 Document
- Page 135 and 136:
125 © European Union 2010 Document
- Page 137 and 138:
127 © European Union 2010 Document
- Page 139 and 140:
129 © European Union 2010 Document
- Page 141 and 142:
131 © European Union 2010 Document
- Page 143 and 144:
133 © European Union 2010 Document
- Page 145 and 146:
135 © European Union 2010 Document
- Page 147 and 148:
137 © European Union 2010 Document
- Page 149 and 150:
139 © European Union 2010 Document
- Page 151 and 152:
141 © European Union 2010 Document
- Page 153 and 154:
143 © European Union 2010 Document
- Page 155 and 156:
145 © European Union 2010 Document
- Page 157 and 158:
147 © European Union 2010 Document
- Page 159 and 160:
149 © European Union 2010 Document
- Page 161 and 162:
151 © European Union 2010 Document
- Page 163 and 164:
153 © European Union 2010 Document
- Page 165 and 166:
155 © European Union 2010 Document
- Page 167 and 168:
157 © European Union 2010 Document
- Page 169 and 170:
F C 6 9 7 2 F C E D B 2 3 F A 8 3 7
- Page 171 and 172:
D 6 3 3 6 C 7 C E A E 8 C C 3 1 6 2
- Page 173 and 174:
7 4 B A 0 8 3 E D 5 5 3 6 3 7 6 0 A
- Page 175 and 176:
1 F 8 0 2 2 4 2 6 F 6 8 5 1 9 B 5 4
- Page 177 and 178:
E 1 B C o d e N o 3 3 9 6 1 4 0 8 B
- Page 179 and 180:
D F 9 6 B E C F 1 1 2 4 5 5 1 D 4 8
- Page 181 and 182:
1 2 1 F 7 0 3 D 2 F 4 8 F C D A 3 1
- Page 183 and 184:
5 3 B D E 3 1 0 2 8 4 5 A 7 9 A 2 0
- Page 185 and 186:
A 0 0 3 B D D 3 5 F 5 4 7 E 5 0 3 9
- Page 187 and 188:
E 1 C C o d e N o 2 7 9 8 C D F C B
- Page 189 and 190:
C 8 9 C 4 9 3 C 1 1 6 1 5 7 D 2 0 D
- Page 191 and 192:
9 9 E A 5 0 F 7 C 9 E B 3 8 9 9 0 F
- Page 193 and 194:
9. Annex D - Licence Agreement for
- Page 195 and 196:
1.12. OS SIS ICD - the Open Service
- Page 197 and 198:
around the scope, terms and conditi
- Page 199 and 200:
ARTICLE 9 - Infringements by third
- Page 201 and 202:
For the EUROPEAN COMMISSION: For ad
- Page 203 and 204:
Territorial coverage File reference
- Page 205 and 206:
10. Annex E - Licence Agreement For
- Page 207 and 208:
1.11 Licensee Background - shall me
- Page 209 and 210:
operation of the Infrastructure Dev
- Page 211 and 212:
ARTICLE 9 - Infringements by third
- Page 213 and 214:
For the EUROPEAN UNION: For adminis
- Page 215 and 216:
Territorial coverage File reference