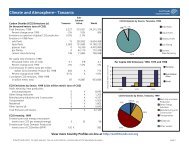
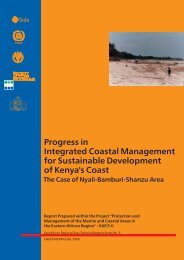
6. MangrovesMangroves are an example of an ecosystem generating both use and non-use benefits, likeforests which provide timber with use benefits and, among other things, nursery ground withindirect and non-use benefits that are obtained when mangroves are preserved. Thedistraction of mangroves is often caused by harvesting of wood for construction poles andfirewood for the immediate needs of coastal communities. These community products have adirect use value which should be compared to the indirect productivity of mangroves forfisheries in the adjoining areas. Data from Mozambique (Hatcher et. al. 1989) indicate that themangrove yield is about 0.5 tons per ha, representing 40 kg per ha per year and a value of$300 ha/year. The Dar es Salaam there are about 2,266 ha of mangroves giving an indirectvalue of $0.7 per year. There is no data on the area of mangroves lost in Dar es Salaam inthe past 10 years to derive an annual rate. But using data form Mozambique for the period1990-92 during which the average annual reduction of mangrove areas was about 288 ha, or2% per year, the indirect productivity cost is about $14,000 a year. It is now a question ofcomparing this amount with the value of poles and firewood harvested from mangroves.Without detailed reliable data to verify the net amount it is unwise to place a money value onthe loss of mangroves from an economic point of view. But certainly the protection ofmangroves cannot be considered to have zero value.7. BiodiversityThe existence value of the environment is a very elusive parameter but one of potentially highvalue. It refers to the value that people themselves estimate of the preservation of theecosystem free of any use for productive activities. It is the social value of the ecosystem aspart of the natural heritage. The Kenyan coast is a rich ecosystem area characterised by coralreefs, diverse sea grasses and other marine life. Economic valuation is constrained by thelack of information to make up for the lack of market demand and estimate a social demandfor coastal and marine diversity. On the other hand, it is unwise to ignore and leave it outsidethe decision-making process. Estimates are typically based on Contingent Valuation studiesthat attempt to utilise survey results which show the responses of people to questionsreferring to their willingness to pay for conservation of coral reefs, excluding production anddevelopment considerations. There is no such information for Dar es Salaam or any countryin the region and they are rare in any <strong>case</strong>.A recent review of the empirical biodiversity literature stresses the following:• Existence valuations are rare – only one study estimated the existence value of coral reefsites, that of the Great Barrier Reef;• Most valuation studies involve coral reefs are concerned with their recreational and touristuse value;• The most commonly valued harvested product of coral reefs is fisheries, but the naturalsystems underlying the harvest (e.g. reef-fish relationship) are simplified, if not ignored,and• Coastal protection afforded by the coral reef habitat is the only ecological function valued.Two known studies are often quotes. Hundloe 1987 estimated the existence value of coralreef habitat using a contingent valuation method for the value of coral reef sites within theGreat Barrier Reef in Australia calculated at A$45 million a year. For the Galapagos NationalPark, de Groot 1992 estimated the “inspirational” and “spiritual” value of reefs at $0.72 per ha.Cynthia Cartier and Jack Ruitenbeck, in Integrated Coastal Zone Management of Coral Reefsby Kent Gustavson (ed.), World Bank, 20006. Estimated Annual Cost of Environmental ImpactsThe estimates worked out above are partial and cover only part of the total environmentaldamage perceived to be caused by pollution, as only some of the impacts are possible to costand excluding qualitative impacts. The annual estimated cost summarised below is $64.8million. This reflects the losses suffered which, when action is taken to address/avoid them,will constitute part of the benefits from such action.Final Draft Report – Cost Benefit Case StudiesGPA Strategic Action Plan on Sewage, October, 200038
Table 13: Estimated Annual Costs of Environmental Impacts in Monetary Values, 2000Impacts Annual cost in Commentsmillion US$Direct Costs1. Fisheries 1.0 Loss of production2. Tourism 9.0 Loss of tourism income3. Property 34.4 Reduction of value or lack of appreciation4. Health 3.117.3Treatment costs and loss of earningsHuman capital loss from deathIndirect Costs5. Recreation Qualitative impacts Not quantified6. Mangroves Qualitative impacts Not quantified7. Biodirersity Qualitative impacts Not quantifiedTotal 64.8 Partial estimateTable 14: Cost – Benefit Analysis of Future Sewage Investment(in million $)Year Capital Oper. & Total Benefits Net PV @ PVCost(1)Maint.Cost(2)Cost(3) (4)Benefits(5)10% 5%2001 - - - (65) (65) (59) (62)2002 100 - 100 (75) (175) (145) (159)2003 110 5 115 (84) (199) (150) (172)2004 12 10 22 (94) (116) (79) (95)2005 - 10 10 103 93 58 732006 - 10 10 116 106 60 792007 - 10 10 126 116 59 822008 - 10 10 135 125 58 852009 - 10 10 146 136 58 882010 - 10 10 156 146 56 9010-year Net Present Value (84) 92011 - 10 10 167 157 55 921012 - 10 10 177 167 53 932013 - 10 10 188 178 52 942014 - 10 10 199 189 51 962015 - 10 10 216 206 50 992016 - 10 10 223 213 47 972017 - 10 10 235 225 45 982018 - 10 10 248 238 43 992019 - 10 10 261 251 41 992020 - 10 10 274 264 39 992021 - 10 10 289 279 38 1002022 - 10 10 306 296 36 1012023 - 10 10 319 309 35 1012024 - 10 10 335 325 33 1012025 - 10 10 351 341 31 10125-year Net Present Value 565 1,479@Notes:• The cost column in column (1) shows the estimated capital cost of the SewerageSystem of $222 spread between 2002-2004.• The operating cost in column (2) is 5% for year 2003 on the capital cost of year2002 and 5% thereafter for the whole amount of 222. The annual cost is assumedto include maintenance.Final Draft Report – Cost Benefit Case StudiesGPA Strategic Action Plan on Sewage, October, 200039


![Please Click to download [English] - GRID Africa GeoPortal - UNEP](https://img.yumpu.com/30633391/1/184x260/please-click-to-download-english-grid-africa-geoportal-unep.jpg?quality=85)