gpa_east_africa_case.. - GRID Africa GeoPortal - UNEP
gpa_east_africa_case.. - GRID Africa GeoPortal - UNEP
gpa_east_africa_case.. - GRID Africa GeoPortal - UNEP

Create successful ePaper yourself
Turn your PDF publications into a flip-book with our unique Google optimized e-Paper software.
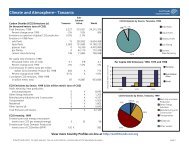
Table 13: Estimated Potential Annual Costs of Pollution without SewerageInfrastructure(year 2004)Impacts Million US$ %1. Tourism 2.85 142. Fisheries 3.00 143. Health 0.90 44. Property 14.20 685. Recreation 0.06 > 16. Biodiversity -Total (excluding non-use/ existence benefits) 21.01 (rounded to 21.0) 100The estimated GDP of Seychelles is $ 641.0 million, which implies that the annualpotential pollution cost is about 3.2% of the GDP.Table 14: Costs and Benefits of Sewerage Infrastructure in million $Year Capital Recurren Total Benefits Net PV @ 10% PV @Cost t Cost CostBenefit5%s2002 7.44 - 7.44 - (7.44) (6.15) (6.75)2003 - 0.54 0.54 - (0.54) (0.40) (0.47)2004 - 0.54 0.54 21.0 20.47 13.98 16.842005 2.14 0.54 2.68 23.9 21.22 13.17 16.622006 - 0.71 0.71 25.8 25.09 14.16 18.722007 - 0.71 0.71 27.7 27.00 13.85 19.182008 5.36 0.71 6.07 29.5 23.43 10.93 15.852009 - 1.14 1.14 31.3 30.16 12.80 19.442010 - 1.14 1.14 33.0 31.86 12.28 19.5510-year Net Present Value 84.62 118.982011 - 1.14 1.14 34.8 33.66 11.79 19.681012 - 1.14 1.14 36.4 35.26 11.55 19.632013 - 1.14 1.14 38.0 36.86 10.67 19.542014 - 1.14 1.14 39.6 38.46 10.12 19.422015 - 1.14 1.14 41.2 40.06 9.60 19.262016 - 1.14 1.14 42.8 41.66 9.06 19.082017 - 1.14 1.14 44.3 43.16 8.53 18.832018 - 1.14 1.14 45.8 44.66 8.03 18.552019 - 1.14 1.14 47.3 46.16 7.54 18.262020 - 1.14 1.14 48.7 47.56 7.07 17.922021 - 1.14 1.14 50.2 49.06 6.63 17.612022 - 1.14 1.14 51.7 50.56 6.21 17.282023 - 1.14 1.14 53.0 51.86 5.80 16.882024 - 1.14 1.14 54.5 53.36 5.42 16.5524-year Net Present Value 202.64 377.47Notes: The cost column shows the estimated capital cost for the construction of theSewerage System of $15 spread between 2002-2008. The operating cost is spreadlikewise. The benefits comprise those from the sources estimated and shown in theprevious table “Estimated Potential Annual Costs of Pollution without SewerageInfrastructure”. The value of tourism benefits are adjusted according to the figureson the right hand column of the Tourism Scenarios table. Benefits are assumed tobegin in 2004.Final Draft Report – Cost Benefit Case StudiesGPA Strategic Action Plan on Sewage, October, 200054


![Please Click to download [English] - GRID Africa GeoPortal - UNEP](https://img.yumpu.com/30633391/1/184x260/please-click-to-download-english-grid-africa-geoportal-unep.jpg?quality=85)