
Create successful ePaper yourself
Turn your PDF publications into a flip-book with our unique Google optimized e-Paper software.
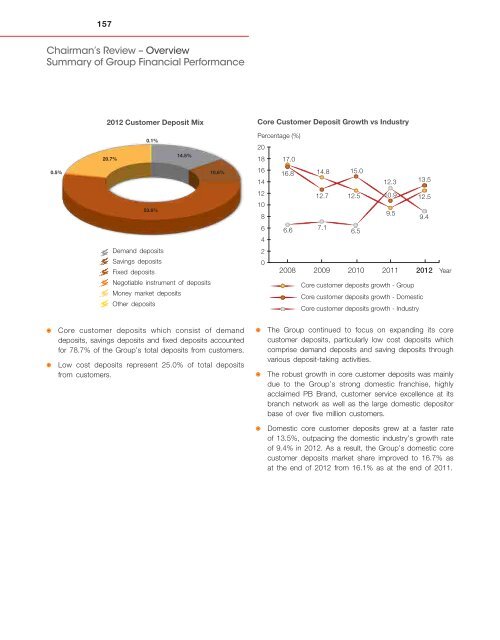
157Chairman’s Review – OverviewSummary of Group Financial Performance2012 Customer Deposit MixCore Customer Deposit Growth vs Industry20.7%0.1%14.5%Percentage (%)2018 17.00.5%10.6%161416.814.815.012.313.553.6%12108646.612.77.112.56.510.9 12.59.59.4Demand depositsSavings depositsFixed depositsNegotiable instrument of depositsMoney market depositsOther deposits202008 2009 2010 2011 2012Core customer deposits growth - GroupCore customer deposits growth - DomesticCore customer deposits growth - IndustryYearCore customer deposits which consist of demanddeposits, savings deposits and fixed deposits accountedfor 78.7% of the Group’s total deposits from customers.Low cost deposits represent 25.0% of total depositsfrom customers.The Group continued to focus on expanding its corecustomer deposits, particularly low cost deposits which<strong>com</strong>prise demand deposits and saving deposits throughvarious deposit-taking activities.The robust growth in core customer deposits was mainlydue to the Group’s strong domestic franchise, highlyacclaimed PB Brand, customer service excellence at itsbranch network as well as the large domestic depositorbase of over five million customers.Domestic core customer deposits grew at a faster rateof 13.5%, outpacing the domestic industry’s growth rateof 9.4% in 2012. As a result, the Group’s domestic corecustomer deposits market share improved to 16.7% asat the end of 2012 from 16.1% as at the end of 2011.