
Create successful ePaper yourself
Turn your PDF publications into a flip-book with our unique Google optimized e-Paper software.
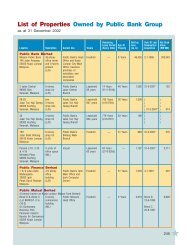
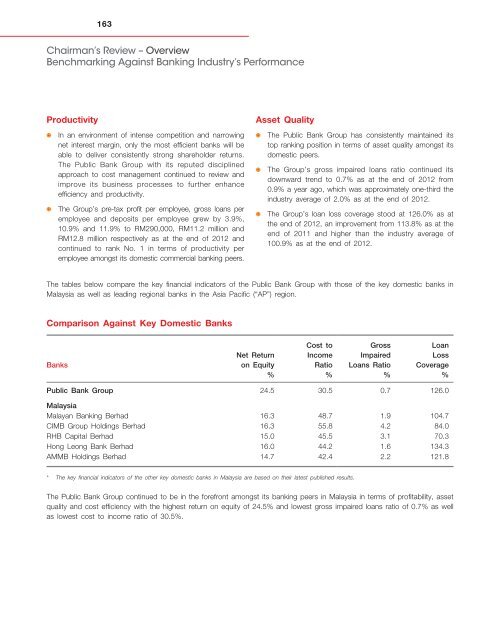
163Chairman’s Review – OverviewBenchmarking Against <strong>Bank</strong>ing Industry’s PerformanceProductivityIn an environment of intense <strong>com</strong>petition and narrowingnet interest margin, only the most efficient banks will beable to deliver consistently strong shareholder returns.The <strong>Public</strong> <strong>Bank</strong> Group with its reputed disciplinedapproach to cost management continued to review andimprove its business processes to further enhanceefficiency and productivity.The Group’s pre-tax profit per employee, gross loans peremployee and deposits per employee grew by 3.9%,10.9% and 11.9% to RM290,000, RM11.2 million andRM12.8 million respectively as at the end of 2012 andcontinued to rank No. 1 in terms of productivity peremployee amongst its domestic <strong>com</strong>mercial banking peers.Asset QualityThe <strong>Public</strong> <strong>Bank</strong> Group has consistently maintained itstop ranking position in terms of asset quality amongst itsdomestic peers.The Group’s gross impaired loans ratio continued itsdownward trend to 0.7% as at the end of 2012 from0.9% a year ago, which was approximately one-third theindustry average of 2.0% as at the end of 2012.The Group’s loan loss coverage stood at 126.0% as atthe end of 2012, an improvement from 113.8% as at theend of 2011 and higher than the industry average of100.9% as at the end of 2012.The tables below <strong>com</strong>pare the key financial indicators of the <strong>Public</strong> <strong>Bank</strong> Group with those of the key domestic banks inMalaysia as well as leading regional banks in the Asia Pacific (“AP”) region.Comparison Against Key Domestic <strong>Bank</strong>s<strong>Bank</strong>sNet Returnon Equity%Cost toIn<strong>com</strong>eRatio%GrossImpairedLoans Ratio%LoanLossCoverage%<strong>Public</strong> <strong>Bank</strong> Group 24.5 30.5 0.7 126.0MalaysiaMalayan <strong>Bank</strong>ing Berhad 16.3 48.7 1.9 104.7CIMB Group Holdings Berhad 16.3 55.8 4.2 84.0RHB Capital Berhad 15.0 45.5 3.1 70.3Hong Leong <strong>Bank</strong> Berhad 16.0 44.2 1.6 134.3AMMB Holdings Berhad 14.7 42.4 2.2 121.8* The key financial indicators of the other key domestic banks in Malaysia are based on their latest published results.The <strong>Public</strong> <strong>Bank</strong> Group continued to be in the forefront amongst its banking peers in Malaysia in terms of profitability, assetquality and cost efficiency with the highest return on equity of 24.5% and lowest gross impaired loans ratio of 0.7% as wellas lowest cost to in<strong>com</strong>e ratio of 30.5%.