- Page 2 and 3:
Biotic Stressand Yield Loss
- Page 4 and 5:
Library of Congress Cataloging-in-P
- Page 6 and 7:
PrefaceThe idea for this book came
- Page 8 and 9:
EditorsRobert K. D. Peterson, Ph.D.
- Page 10 and 11:
ContentsChapter 1Illuminating the B
- Page 12 and 13:
1Illuminating the Black Box:The Rel
- Page 14 and 15:
increase plant tolerance, through p
- Page 16 and 17:
the action of a stressor on a plant
- Page 18 and 19:
The magnitude and duration of injur
- Page 20 and 21:
Plant part injuredrefers to the pla
- Page 22 and 23:
cific competition, while agricultur
- Page 24 and 25:
2Yield Loss and PestManagementLeon
- Page 26 and 27:
direct relationships between the ac
- Page 28 and 29:
In keeping with the theme of this b
- Page 30 and 31:
egressions. Actually, the title “
- Page 32 and 33:
REFERENCES1. Teng, P. S., Crop Loss
- Page 34 and 35:
3Techniques for EvaluatingYield Los
- Page 36 and 37:
number of species and stage of cutw
- Page 38 and 39:
especially if buried in soil, can d
- Page 40 and 41:
elationships for some pests. When m
- Page 42 and 43:
injury can be precisely controlled
- Page 44 and 45:
day. 81, 99 However, except for an
- Page 46 and 47:
the literature most likely are actu
- Page 48 and 49:
20. Ba-Angood, S. A., and Stewart,
- Page 50 and 51:
60. Stewart, J. G., McRae, K. B., a
- Page 52 and 53:
99. Shields, E. J., and Wyman, J. A
- Page 54 and 55:
4.3.3.1.3 Third generation European
- Page 56 and 57:
ing on the developmental stage at t
- Page 58 and 59:
4.2.2.1.2 Temperature stressPlant s
- Page 60 and 61:
chronic injury. Acute injury result
- Page 62 and 63:
ows, roadsides, or small grain fiel
- Page 64 and 65:
numbers are present. Stink bugs, Eu
- Page 66 and 67:
Oligonychus pratensis, feed on corn
- Page 68 and 69:
ECB2. 224.3.3.1.4 The impacts of Eu
- Page 70 and 71:
stalk borer, Papaipema nebris, is a
- Page 72 and 73:
period prolonged with sufficient co
- Page 74 and 75:
Arthropod injuries to developing ea
- Page 76 and 77:
esponses to herbivory have been obs
- Page 78 and 79:
Midwest, Purdue University CES and
- Page 80 and 81:
59. Bailey, W. C., and Pedigo, L. P
- Page 82 and 83:
5Phenological Disruptionand Yield L
- Page 84 and 85:
ity by animal consumers is the agro
- Page 86 and 87:
ously, structural components (e.g.,
- Page 88 and 89:
FIGURE 5.2 Generalized alfalfa grow
- Page 90 and 91:
601, 1972.9. Gordon, C. H., Derbysh
- Page 92 and 93:
do we know about how biotic stresso
- Page 94 and 95:
ing both large and small leaf veins
- Page 96 and 97:
population. Whole plants may respon
- Page 98 and 99:
temporally and spatially, are more
- Page 100 and 101:
some systems have allowed for a tra
- Page 102 and 103:
injury guilds would center on the f
- Page 104 and 105:
apple leaves, HortScience, 19, 815,
- Page 106 and 107:
7The Influence of Cultivarand Plant
- Page 108 and 109:
unit ground area, and it indicates
- Page 110 and 111:
without considering plant architect
- Page 112 and 113:
photosynthesis. Regardless of the n
- Page 114 and 115:
light interception. 45 Skeletonizin
- Page 116 and 117:
Light interception, which intrinsic
- Page 118 and 119:
var. Consequently, use of a single
- Page 120 and 121:
19. Jarosik, V., Phytoseiulus persi
- Page 122 and 123:
62. Caviness, C. E., Registration o
- Page 124 and 125:
8Drought Stress, Insects,and Yield
- Page 126 and 127:
humidity. Because the relative humi
- Page 128 and 129:
temperature and precipitation. Prop
- Page 130 and 131:
compared to well watered soybeans.
- Page 132 and 133:
Changes in plant hormones, such as
- Page 134 and 135:
plays a key role in promoting plant
- Page 136 and 137:
In soybeans, a leaf area index (LAI
- Page 138 and 139:
15. Schulze, E. D., Water and nutri
- Page 140 and 141:
52. Meyer W. S., and Walker, S., Le
- Page 142 and 143:
9The Impact of Herbivoryon Plants:
- Page 144 and 145:
conditions of stress are themselves
- Page 146 and 147:
are common, defenses to avoid herbi
- Page 148 and 149: plant tissue, resulting in gall for
- Page 150 and 151: found on cucumbers in polycultures
- Page 152 and 153: compensatory response. Also, more v
- Page 154 and 155: Costa Rica, and there are several g
- Page 156 and 157: ivory from white cabbage butterfly
- Page 158 and 159: made, while larger vertebrate herbi
- Page 160 and 161: important consequences to plant fit
- Page 162 and 163: de Entomol., 38, 421, 1994.32. Kare
- Page 164 and 165: chlorophyll content in spider mite
- Page 166 and 167: 114. Karban, R., and Strauss, S.Y.,
- Page 168 and 169: 10Stephen C. WelterCONTENTSContrast
- Page 170 and 171: Although literature is drawn from a
- Page 172 and 173: and wheat acres receiving some type
- Page 174 and 175: pattern to be true. 109 Because rel
- Page 176 and 177: used in the experiment influenced t
- Page 178 and 179: artificially elevated nitrogen leve
- Page 180 and 181: annual, landrace cultivars, or mode
- Page 182 and 183: settings are coupled with genotype
- Page 184 and 185: 10. Kennedy, G. G., and Barbour, J.
- Page 186 and 187: 53. Panda, N., and Heinrichs, E. A.
- Page 188 and 189: 97. Gross, K. L., and Soule, J. D.,
- Page 190 and 191: 143. Davidson, J. L., and Milthorpe
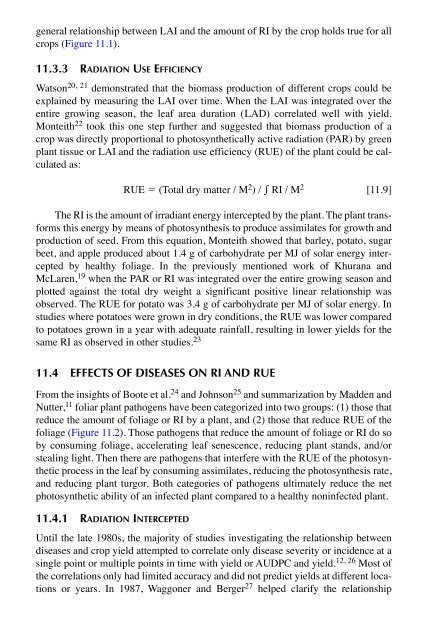
- Page 192 and 193: 11Crop Disease andYield LossBrian D
- Page 194 and 195: The conditions listed above are opt
- Page 196 and 197: to associate the effects of disease
- Page 200 and 201: Biomassproduction(total dryweight)R
- Page 202 and 203: Y RUE(t)RI(t)[1 X]dt [11.12]wher
- Page 204 and 205: sue. The most accurate prediction o
- Page 206 and 207: tion. Two weeks before harvest, the
- Page 208 and 209: 15. Spitters, C. J. T., Van Roermun
- Page 210 and 211: 57. Richardson, A. J., Wiegand, C.
- Page 212 and 213: they were cheap, convenient, and ef
- Page 214 and 215: dW / W dtcauses and consequences of
- Page 216 and 217: (a)(b)Maize yield (Mg ha -1 )987654
- Page 218 and 219: Recall that c is a constant, so by
- Page 220 and 221: where the subscripts c and w repres
- Page 222 and 223: 0.6Fraction yield loss0.40.2Eq. 16,
- Page 224 and 225: the leaf area index (LAI). Incorpor
- Page 226 and 227: can no longer be tolerated and, the
- Page 228 and 229: cide. Steckel et al. 68 showed that
- Page 230 and 231: A eq ∑ jN eq,ji 1YL n,j [12.31]1
- Page 232 and 233: samples per field. Thomas 85 sugges
- Page 234 and 235: external factors such as annual wea
- Page 236 and 237: 38. Boznic, A. C., and Swanton, C.
- Page 238 and 239: weeds, Weed Sci., 44, 856, 1996.79.
- Page 240 and 241: competition and weed management. 3-
- Page 242 and 243: per unit biomass (1/W i)(dW i/dt) o
- Page 244 and 245: of light interception). Algorithms
- Page 246 and 247: where G a,iis the water limited pla
- Page 248 and 249:
13.4 COMPETITION FOR SOIL NITROGENA
- Page 250 and 251:
As with soil water, Equations 13.10
- Page 252 and 253:
partitioning of nitrogen to leaves.
- Page 254 and 255:
and stems to optimize photosyntheti
- Page 256 and 257:
influence of enhanced UV-B conditio
- Page 258 and 259:
Systems Approaches at the Field Lev