

National Human Development Report: 2001 - Indira Gandhi Institute ...
National Human Development Report: 2001 - Indira Gandhi Institute ...
National Human Development Report: 2001 - Indira Gandhi Institute ...
- No tags were found...

Create successful ePaper yourself
Turn your PDF publications into a flip-book with our unique Google optimized e-Paper software.
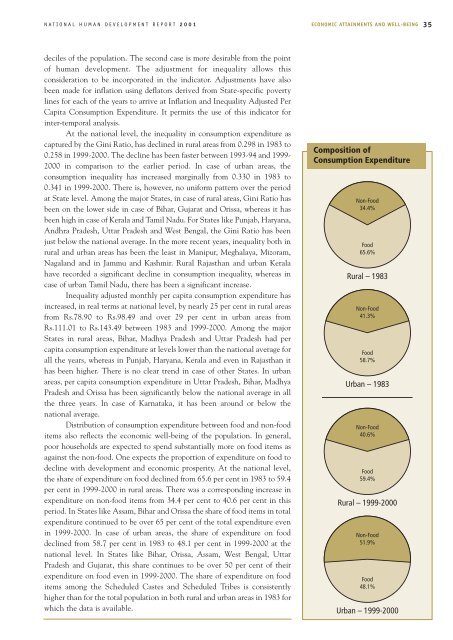
NATIONAL HUMAN DEVELOPMENT REPORT <strong>2001</strong> ECONOMIC ATTAINMENTS AND WELL-BEING 35deciles of the population. The second case is more desirable from the pointof human development. The adjustment for inequality allows thisconsideration to be incorporated in the indicator. Adjustments have alsobeen made for inflation using deflators derived from State-specific povertylines for each of the years to arrive at Inflation and Inequality Adjusted PerCapita Consumption Expenditure. It permits the use of this indicator forinter-temporal analysis.At the national level, the inequality in consumption expenditure ascaptured by the Gini Ratio, has declined in rural areas from 0.298 in 1983 to0.258 in 1999-2000. The decline has been faster between 1993-94 and 1999-2000 in comparison to the earlier period. In case of urban areas, theconsumption inequality has increased marginally from 0.330 in 1983 to0.341 in 1999-2000. There is, however, no uniform pattern over the periodat State level. Among the major States, in case of rural areas, Gini Ratio hasbeen on the lower side in case of Bihar, Gujarat and Orissa, whereas it hasbeen high in case of Kerala and Tamil Nadu. For States like Punjab, Haryana,Andhra Pradesh, Uttar Pradesh and West Bengal, the Gini Ratio has beenjust below the national average. In the more recent years, inequality both inrural and urban areas has been the least in Manipur, Meghalaya, Mizoram,Nagaland and in Jammu and Kashmir. Rural Rajasthan and urban Keralahave recorded a significant decline in consumption inequality, whereas incase of urban Tamil Nadu, there has been a significant increase.Inequality adjusted monthly per capita consumption expenditure hasincreased, in real terms at national level, by nearly 25 per cent in rural areasfrom Rs.78.90 to Rs.98.49 and over 29 per cent in urban areas fromRs.111.01 to Rs.143.49 between 1983 and 1999-2000. Among the majorStates in rural areas, Bihar, Madhya Pradesh and Uttar Pradesh had percapita consumption expenditure at levels lower than the national average forall the years, whereas in Punjab, Haryana, Kerala and even in Rajasthan ithas been higher. There is no clear trend in case of other States. In urbanareas, per capita consumption expenditure in Uttar Pradesh, Bihar, MadhyaPradesh and Orissa has been significantly below the national average in allthe three years. In case of Karnataka, it has been around or below thenational average.Distribution of consumption expenditure between food and non-fooditems also reflects the economic well-being of the population. In general,poor households are expected to spend substantially more on food items asagainst the non-food. One expects the proportion of expenditure on food todecline with development and economic prosperity. At the national level,the share of expenditure on food declined from 65.6 per cent in 1983 to 59.4per cent in 1999-2000 in rural areas. There was a corresponding increase inexpenditure on non-food items from 34.4 per cent to 40.6 per cent in thisperiod. In States like Assam, Bihar and Orissa the share of food items in totalexpenditure continued to be over 65 per cent of the total expenditure evenin 1999-2000. In case of urban areas, the share of expenditure on fooddeclined from 58.7 per cent in 1983 to 48.1 per cent in 1999-2000 at thenational level. In States like Bihar, Orissa, Assam, West Bengal, UttarPradesh and Gujarat, this share continues to be over 50 per cent of theirexpenditure on food even in 1999-2000. The share of expenditure on fooditems among the Scheduled Castes and Scheduled Tribes is consistentlyhigher than for the total population in both rural and urban areas in 1983 forwhich the data is available.Composition ofConsumption ExpenditureNon-Food34.4%Food65.6%Rural – 1983Non-Food41.3%Food58.7%Urban – 1983Non-Food40.6%Food59.4%Rural – 1999-2000Non-Food51.9%Food48.1%Urban – 1999-2000


