Palestinian Family Survey 2010 Final Report - Palestinian Central ...
Palestinian Family Survey 2010 Final Report - Palestinian Central ...
Palestinian Family Survey 2010 Final Report - Palestinian Central ...
- No tags were found...

Create successful ePaper yourself
Turn your PDF publications into a flip-book with our unique Google optimized e-Paper software.
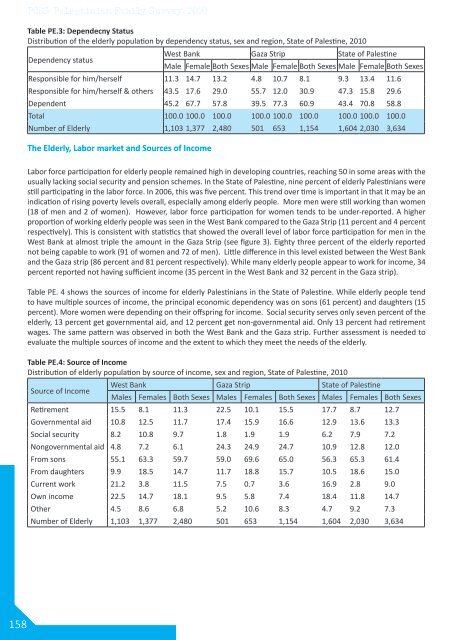
PCBS: <strong>Palestinian</strong> <strong>Family</strong> <strong>Survey</strong>, <strong>2010</strong>Table PE.3: Dependecny StatusDistribution of the elderly population by dependency status, sex and region, State of Palestine, <strong>2010</strong>Dependency statusWest Bank Gaza Strip State of PalestineMale Female Both Sexes Male Female Both Sexes Male Female Both SexesResponsible for him/herself 11.3 14.7 13.2 4.8 10.7 8.1 9.3 13.4 11.6Responsible for him/herself & others 43.5 17.6 29.0 55.7 12.0 30.9 47.3 15.8 29.6Dependent 45.2 67.7 57.8 39.5 77.3 60.9 43.4 70.8 58.8Total 100.0 100.0 100.0 100.0 100.0 100.0 100.0 100.0 100.0Number of Elderly 1,103 1,377 2,480 501 653 1,154 1,604 2,030 3,634The Elderly, Labor market and Sources of IncomeLabor force participation for elderly people remained high in developing countries, reaching 50 in some areas with theusually lacking social security and pension schemes. In the State of Palestine, nine percent of elderly <strong>Palestinian</strong>s werestill participating in the labor force. In 2006, this was five percent. This trend over time is important in that it may be anindication of rising poverty levels overall, especially among elderly people. More men were still working than women(18 of men and 2 of women). However, labor force participation for women tends to be under-reported. A higherproportion of working elderly people was seen in the West Bank compared to the Gaza Strip (11 percent and 4 percentrespectively). This is consistent with statistics that showed the overall level of labor force participation for men in theWest Bank at almost triple the amount in the Gaza Strip (see figure 3). Eighty three percent of the elderly reportednot being capable to work (91 of women and 72 of men). Little difference in this level existed between the West Bankand the Gaza strip (86 percent and 81 percent respectively). While many elderly people appear to work for income, 34percent reported not having sufficient income (35 percent in the West Bank and 32 percent in the Gaza strip).Table PE. 4 shows the sources of income for elderly <strong>Palestinian</strong>s in the State of Palestine. While elderly people tendto have multiple sources of income, the principal economic dependency was on sons (61 percent) and daughters (15percent). More women were depending on their offspring for income. Social security serves only seven percent of theelderly, 13 percent get governmental aid, and 12 percent get non-governmental aid. Only 13 percent had retirementwages. The same pattern was observed in both the West Bank and the Gaza strip. Further assessment is needed toevaluate the multiple sources of income and the extent to which they meet the needs of the elderly.Table PE.4: Source of IncomeDistribution of elderly population by source of income, sex and region, State of Palestine, <strong>2010</strong>Source of IncomeWest Bank Gaza Strip State of PalestineMales Females Both Sexes Males Females Both Sexes Males Females Both SexesRetirement 15.5 8.1 11.3 22.5 10.1 15.5 17.7 8.7 12.7Governmental aid 10.8 12.5 11.7 17.4 15.9 16.6 12.9 13.6 13.3Social security 8.2 10.8 9.7 1.8 1.9 1.9 6.2 7.9 7.2Nongovernmental aid 4.8 7.2 6.1 24.3 24.9 24.7 10.9 12.8 12.0From sons 55.1 63.3 59.7 59.0 69.6 65.0 56.3 65.3 61.4From daughters 9.9 18.5 14.7 11.7 18.8 15.7 10.5 18.6 15.0Current work 21.2 3.8 11.5 7.5 0.7 3.6 16.9 2.8 9.0Own income 22.5 14.7 18.1 9.5 5.8 7.4 18.4 11.8 14.7Other 4.5 8.6 6.8 5.2 10.6 8.3 4.7 9.2 7.3Number of Elderly 1,103 1,377 2,480 501 653 1,154 1,604 2,030 3,634158