Palestinian Family Survey 2010 Final Report - Palestinian Central ...
Palestinian Family Survey 2010 Final Report - Palestinian Central ...
Palestinian Family Survey 2010 Final Report - Palestinian Central ...
- No tags were found...

Create successful ePaper yourself
Turn your PDF publications into a flip-book with our unique Google optimized e-Paper software.
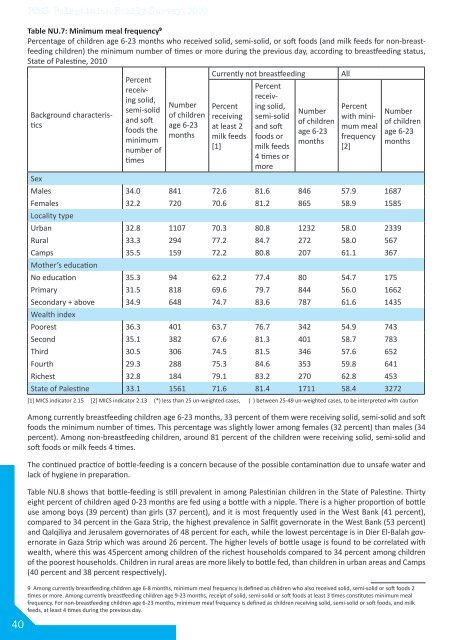
PCBS: <strong>Palestinian</strong> <strong>Family</strong> <strong>Survey</strong>, <strong>2010</strong>40Table NU.7: Minimum meal frequency 9Percentage of children age 6-23 months who received solid, semi-solid, or soft foods (and milk feeds for non-breastfeedingchildren) the minimum number of times or more during the previous day, according to breastfeeding status,State of Palestine, <strong>2010</strong>Background characteristicsPercentreceivingsolid,semi-solidand softfoods theminimumnumber oftimesNumberof childrenage 6-23monthsCurrently not breastfeedingPercentreceivingat least 2milk feeds[1]Percentreceivingsolid,semi-solidand softfoods ormilk feeds4 times ormoreNumberof childrenage 6-23monthsAllPercentwith minimummealfrequency[2]Numberof childrenage 6-23monthsSexMales 34.0 841 72.6 81.6 846 57.9 1687Females 32.2 720 70.6 81.2 865 58.9 1585Locality typeUrban 32.8 1107 70.3 80.8 1232 58.0 2339Rural 33.3 294 77.2 84.7 272 58.0 567Camps 35.5 159 72.2 80.8 207 61.1 367Mother’s educationNo education 35.3 94 62.2 77.4 80 54.7 175Primary 31.5 818 69.6 79.7 844 56.0 1662Secondary + above 34.9 648 74.7 83.6 787 61.6 1435Wealth indexPoorest 36.3 401 63.7 76.7 342 54.9 743Second 35.1 382 67.6 81.3 401 58.7 783Third 30.5 306 74.5 81.5 346 57.6 652Fourth 29.3 288 75.3 84.6 353 59.8 641Richest 32.8 184 79.1 83.2 270 62.8 453State of Palestine 33.1 1561 71.6 81.4 1711 58.4 3272[1] MICS indicator 2.15 [2] MICS indicator 2.13 (*) less than 25 un-weighted cases, ( ) between 25-49 un-weighted cases, to be interpreted with cautionAmong currently breastfeeding children age 6-23 months, 33 percent of them were receiving solid, semi-solid and softfoods the minimum number of times. This percentage was slightly lower among females (32 percent) than males (34percent). Among non-breastfeeding children, around 81 percent of the children were receiving solid, semi-solid andsoft foods or milk feeds 4 times.The continued practice of bottle-feeding is a concern because of the possible contamination due to unsafe water andlack of hygiene in preparation.Table NU.8 shows that bottle-feeding is still prevalent in among <strong>Palestinian</strong> children in the State of Palestine. Thirtyeight percent of children aged 0-23 months are fed using a bottle with a nipple. There is a higher proportion of bottleuse among boys (39 percent) than girls (37 percent), and it is most frequently used in the West Bank (41 percent),compared to 34 percent in the Gaza Strip, the highest prevalence in Salfit governorate in the West Bank (53 percent)and Qalqiliya and Jerusalem governorates of 48 percent for each, while the lowest percentage is in Dier El-Balah governoratein Gaza Strip which was around 26 percent. The higher levels of bottle usage is found to be correlated withwealth, where this was 45percent among children of the richest households compared to 34 percent among childrenof the poorest households. Children in rural areas are more likely to bottle fed, than children in urban areas and Camps(40 percent and 38 percent respectively).9 Among currently breastfeeding children age 6-8 months, minimum meal frequency is defined as children who also received solid, semi-solid or soft foods 2times or more. Among currently breastfeeding children age 9-23 months, receipt of solid, semi-solid or soft foods at least 3 times constitutes minimum mealfrequency. For non-breastfeeding children age 6-23 months, minimum meal frequency is defined as children receiving solid, semi-solid or soft foods, and milkfeeds, at least 4 times during the previous day.