<strong>Strategic</strong> <strong>Review</strong> <strong>of</strong> <strong>the</strong> <strong>EDUCO</strong> <strong>Program</strong>July 2010ACE and CDE schools achieve almost exactly <strong>the</strong> same average level <strong>of</strong> performance on <strong>the</strong> thirdgrade “PAESITA” standardized achievement test: 5.7. Likewise, <strong>the</strong> variability among ACE schoolsis similar to <strong>the</strong> variability among CDE schools. It is important to point out that, since ACE and CDEschools achieve exactly <strong>the</strong> same grade (emphasizing, however, that ACE schools achieve this despitebeing located in much poorer communities), and since <strong>the</strong> variability among ACE schools ranges from4.7 to 6.9 points (this refers to <strong>the</strong> range among <strong>the</strong> schools in <strong>the</strong> 5th to 95th percentiles) and amongCDE schools it ranges from 4.8 to 6.8 points, it is evident that <strong>the</strong> important variability in El Salvadoris “within” each type <strong>of</strong> school ra<strong>the</strong>r than between <strong>the</strong>m. This suggests, as will be repeatedly stressedin this report, that <strong>the</strong>re are considerable problems with quality control, standards, and accountabilitythroughout <strong>the</strong> system.However, ACE schools achieve <strong>the</strong> same average as CDE schools despite having significant socialdisadvantages. The proportion <strong>of</strong> ACE schools that are in municipalities with high, severe extremepoverty is almost double <strong>the</strong> proportion <strong>of</strong> CDE schools in municipalities with this poverty level (37%vs. 21%). The average poverty level in those municipalities is, also, slightly higher: 24.8% vs. 19.8%.Then, ACE schools operate at a disadvantage due to poverty. However, as <strong>the</strong>y have <strong>the</strong> same outcomesas CDE schools, <strong>the</strong>y appear to be more efficient; <strong>the</strong>y <strong>of</strong>fer, along <strong>the</strong>se lines, greater value added.ACE schools seem to have more resources and supplies per student than CDE schools, although<strong>the</strong>y lack equal physical infrastructure compared to CDE schools. They are quite similar to CDEschools with regard to <strong>the</strong> nominal quantity and quality <strong>of</strong> teachers. ACE schools have a nominal disadvantage,naturally, because <strong>the</strong>y do not have pr<strong>of</strong>essional management with authority (<strong>the</strong> principals arenot responsible for <strong>the</strong> school). Then, with regard to advantages in resources, ACE and CDE schoolsare similar, in a net sense (better equipped, but worse infrastructure for ACE schools). Annex 2 explainshow <strong>the</strong> index for resources per student and for infrastructure was calculated.Being an ACE school means reducing <strong>the</strong> student-teacher ratio by 10 (or from 7 to 10, dependingon <strong>the</strong> model). 2 This implies, or reinforces, <strong>the</strong> idea that being an ACE school confers on <strong>the</strong> schoola degree <strong>of</strong> cost-effectiveness, or value-added, that is comparatively advantageous. It must be admitted,however, that <strong>the</strong> impact <strong>of</strong> both <strong>the</strong>se variables is quite low in absolute terms: we are talking abouta matter <strong>of</strong> 1% in points on <strong>the</strong> PAESITA test. Then, to a certain extent, if this type <strong>of</strong> data is credible(and it does appear to be so), it is important to stress that <strong>the</strong> “secret” to educational improvement is notachieved by a “magic bullet” in <strong>the</strong> form <strong>of</strong> structural change, nor with <strong>the</strong> “magic bullet” <strong>of</strong> reducing<strong>the</strong> teacher-student ratio. The only thing we wish to stress here is that when comparing two factors oropinions, nei<strong>the</strong>r <strong>of</strong> which is “magic” on its own, it is interesting to see that being a CDE school createsa decrease in cost-effectiveness equivalent to increasing <strong>the</strong> student-teacher ratio by 10.On this last point, <strong>the</strong>re is a lot <strong>of</strong> literature on how to try to improve <strong>the</strong> academic performance <strong>of</strong>schools by trying to lower <strong>the</strong> student-teacher ratio. In general, <strong>the</strong> best schools tend to have a lowerstudent-teacher ratio, but it is difficult to know if this is a correlation or a cause. Fur<strong>the</strong>rmore, it is182 A very simple regression analysis was done to inquire into this point. This analysis takes as <strong>the</strong> dependent variable third-grade academic achievement,and as “associated factors” or “controls” being or not being an ACE school (as a binomial or dummy variable), student-teacher ratio, teacher qualification,resources/student, poverty level <strong>of</strong> <strong>the</strong> communities, and school infrastructure. The coefficient <strong>of</strong> being or not being an ACE school shows that being or notbeing an ACE school means, with regard to its impact on student achievement, reducing <strong>the</strong> student-teacher ratio by 10.
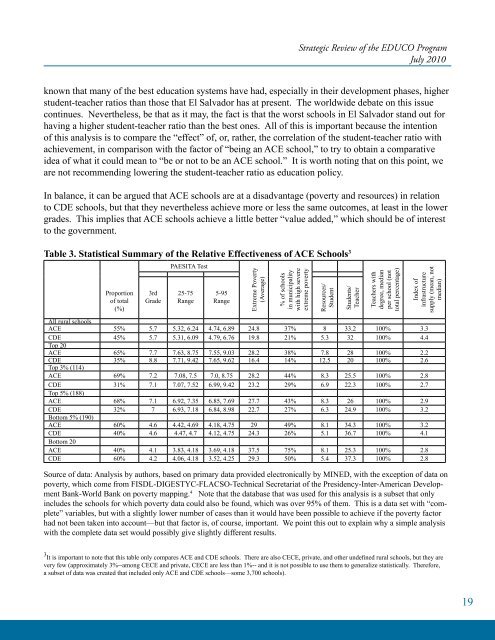
<strong>Strategic</strong> <strong>Review</strong> <strong>of</strong> <strong>the</strong> <strong>EDUCO</strong> <strong>Program</strong>July 2010known that many <strong>of</strong> <strong>the</strong> best education systems have had, especially in <strong>the</strong>ir development phases, higherstudent-teacher ratios than those that El Salvador has at present. The worldwide debate on this issuecontinues. Never<strong>the</strong>less, be that as it may, <strong>the</strong> fact is that <strong>the</strong> worst schools in El Salvador stand out forhaving a higher student-teacher ratio than <strong>the</strong> best ones. All <strong>of</strong> this is important because <strong>the</strong> intention<strong>of</strong> this analysis is to compare <strong>the</strong> “effect” <strong>of</strong>, or, ra<strong>the</strong>r, <strong>the</strong> correlation <strong>of</strong> <strong>the</strong> student-teacher ratio withachievement, in comparison with <strong>the</strong> factor <strong>of</strong> “being an ACE school,” to try to obtain a comparativeidea <strong>of</strong> what it could mean to “be or not to be an ACE school.” It is worth noting that on this point, weare not recommending lowering <strong>the</strong> student-teacher ratio as education policy.In balance, it can be argued that ACE schools are at a disadvantage (poverty and resources) in relationto CDE schools, but that <strong>the</strong>y never<strong>the</strong>less achieve more or less <strong>the</strong> same outcomes, at least in <strong>the</strong> lowergrades. This implies that ACE schools achieve a little better “value added,” which should be <strong>of</strong> interestto <strong>the</strong> government.Table 3. Statistical Summary <strong>of</strong> <strong>the</strong> Relative Effectiveness <strong>of</strong> ACE Schools 3Proportion<strong>of</strong> total(%)3rdGradePAESITA Test25-75Range5-95RangeExtreme Poverty(Average)% <strong>of</strong> schoolsin municipalitywith high severeextreme povertyResources/StudentStudents/TeacherTeachers withdegree, medianper school (nottotal percentage)Index <strong>of</strong>infrastructuresupply (mean, notmedian)All rural schoolsACE 55% 5.7 5.32, 6.24 4.74, 6.89 24.8 37% 8 33.2 100% 3.3CDE 45% 5.7 5.31, 6.09 4.79, 6.76 19.8 21% 5.3 32 100% 4.4Top 20ACE 65% 7.7 7.63, 8.75 7.55, 9.03 28.2 38% 7.8 28 100% 2.2CDE 35% 8.8 7.71, 9.42 7.65, 9.62 16.4 14% 12.5 20 100% 2.6Top 3% (114)ACE 69% 7.2 7.08, 7.5 7.0, 8.75 28.2 44% 8.3 25.5 100% 2.8CDE 31% 7.1 7.07, 7.52 6.99, 9.42 23.2 29% 6.9 22.3 100% 2.7Top 5% (188)ACE 68% 7.1 6.92, 7.35 6.85, 7.69 27.7 43% 8.3 26 100% 2.9CDE 32% 7 6.93, 7.18 6.84, 8.98 22.7 27% 6.3 24.9 100% 3.2Bottom 5% (190)ACE 60% 4.6 4.42, 4.69 4.18, 4.75 29 49% 8.1 34.3 100% 3.2CDE 40% 4.6 4.47, 4.7 4.12, 4.75 24.3 26% 5.1 36.7 100% 4.1Bottom 20ACE 40% 4.1 3.83, 4.18 3.69, 4.18 37.5 75% 8.1 25.3 100% 2.8CDE 60% 4.2 4.06, 4.18 3.52, 4.25 29.3 50% 5.4 37.3 100% 2.8Source <strong>of</strong> data: Analysis by authors, based on primary data provided electronically by MINED, with <strong>the</strong> exception <strong>of</strong> data onpoverty, which come from FISDL-DIGESTYC-FLACSO-Technical Secretariat <strong>of</strong> <strong>the</strong> Presidency-Inter-American DevelopmentBank-World Bank on poverty mapping. 4 Note that <strong>the</strong> database that was used for this analysis is a subset that onlyincludes <strong>the</strong> schools for which poverty data could also be found, which was over 95% <strong>of</strong> <strong>the</strong>m. This is a data set with “complete”variables, but with a slightly lower number <strong>of</strong> cases than it would have been possible to achieve if <strong>the</strong> poverty factorhad not been taken into account—but that factor is, <strong>of</strong> course, important. We point this out to explain why a simple analysiswith <strong>the</strong> complete data set would possibly give slightly different results.3 It is important to note that this table only compares ACE and CDE schools. There are also CECE, private, and o<strong>the</strong>r undefined rural schools, but <strong>the</strong>y arevery few (approximately 3%--among CECE and private, CECE are less than 1%-- and it is not possible to use <strong>the</strong>m to generalize statistically. Therefore,a subset <strong>of</strong> data was created that included only ACE and CDE schools—some 3,700 schools).19