Strategic Review of the EDUCO Program - EQUIP123.net
Strategic Review of the EDUCO Program - EQUIP123.net
Strategic Review of the EDUCO Program - EQUIP123.net

You also want an ePaper? Increase the reach of your titles
YUMPU automatically turns print PDFs into web optimized ePapers that Google loves.
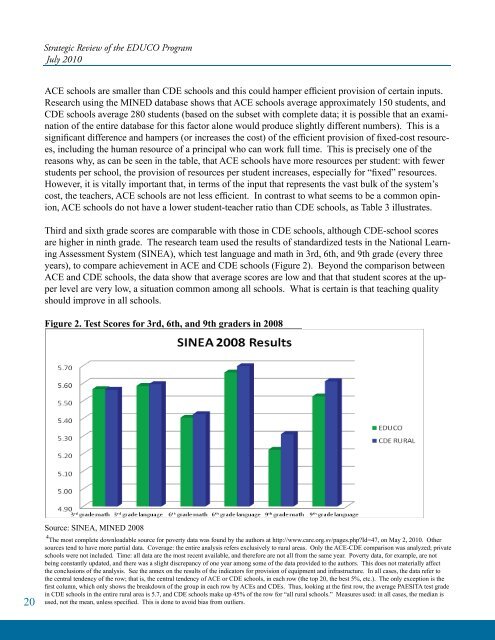
<strong>Strategic</strong> <strong>Review</strong> <strong>of</strong> <strong>the</strong> <strong>EDUCO</strong> <strong>Program</strong>July 2010ACE schools are smaller than CDE schools and this could hamper efficient provision <strong>of</strong> certain inputs.Research using <strong>the</strong> MINED database shows that ACE schools average approximately 150 students, andCDE schools average 280 students (based on <strong>the</strong> subset with complete data; it is possible that an examination<strong>of</strong> <strong>the</strong> entire database for this factor alone would produce slightly different numbers). This is asignificant difference and hampers (or increases <strong>the</strong> cost) <strong>of</strong> <strong>the</strong> efficient provision <strong>of</strong> fixed-cost resources,including <strong>the</strong> human resource <strong>of</strong> a principal who can work full time. This is precisely one <strong>of</strong> <strong>the</strong>reasons why, as can be seen in <strong>the</strong> table, that ACE schools have more resources per student: with fewerstudents per school, <strong>the</strong> provision <strong>of</strong> resources per student increases, especially for “fixed” resources.However, it is vitally important that, in terms <strong>of</strong> <strong>the</strong> input that represents <strong>the</strong> vast bulk <strong>of</strong> <strong>the</strong> system’scost, <strong>the</strong> teachers, ACE schools are not less efficient. In contrast to what seems to be a common opinion,ACE schools do not have a lower student-teacher ratio than CDE schools, as Table 3 illustrates.Third and sixth grade scores are comparable with those in CDE schools, although CDE-school scoresare higher in ninth grade. The research team used <strong>the</strong> results <strong>of</strong> standardized tests in <strong>the</strong> National LearningAssessment System (SINEA), which test language and math in 3rd, 6th, and 9th grade (every threeyears), to compare achievement in ACE and CDE schools (Figure 2). Beyond <strong>the</strong> comparison betweenACE and CDE schools, <strong>the</strong> data show that average scores are low and that that student scores at <strong>the</strong> upperlevel are very low, a situation common among all schools. What is certain is that teaching qualityshould improve in all schools.Figure 2. Test Scores for 3rd, 6th, and 9th graders in 200820Source: SINEA, MINED 20084 The most complete downloadable source for poverty data was found by <strong>the</strong> authors at http://www.care.org.sv/pages.php?Id=47, on May 2, 2010. O<strong>the</strong>rsources tend to have more partial data. Coverage: <strong>the</strong> entire analysis refers exclusively to rural areas. Only <strong>the</strong> ACE-CDE comparison was analyzed; privateschools were not included. Time: all data are <strong>the</strong> most recent available, and <strong>the</strong>refore are not all from <strong>the</strong> same year. Poverty data, for example, are notbeing constantly updated, and <strong>the</strong>re was a slight discrepancy <strong>of</strong> one year among some <strong>of</strong> <strong>the</strong> data provided to <strong>the</strong> authors. This does not materially affect<strong>the</strong> conclusions <strong>of</strong> <strong>the</strong> analysis. See <strong>the</strong> annex on <strong>the</strong> results <strong>of</strong> <strong>the</strong> indicators for provision <strong>of</strong> equipment and infrastructure. In all cases, <strong>the</strong> data refer to<strong>the</strong> central tendency <strong>of</strong> <strong>the</strong> row; that is, <strong>the</strong> central tendency <strong>of</strong> ACE or CDE schools, in each row (<strong>the</strong> top 20, <strong>the</strong> best 5%, etc.). The only exception is <strong>the</strong>first column, which only shows <strong>the</strong> breakdown <strong>of</strong> <strong>the</strong> group in each row by ACEs and CDEs. Thus, looking at <strong>the</strong> first row, <strong>the</strong> average PAESITA test gradein CDE schools in <strong>the</strong> entire rural area is 5.7, and CDE schools make up 45% <strong>of</strong> <strong>the</strong> row for “all rural schools.” Measures used: in all cases, <strong>the</strong> median isused, not <strong>the</strong> mean, unless specified. This is done to avoid bias from outliers.