Introduction to Cadence - UPC
Introduction to Cadence - UPC
Introduction to Cadence - UPC

You also want an ePaper? Increase the reach of your titles
YUMPU automatically turns print PDFs into web optimized ePapers that Google loves.
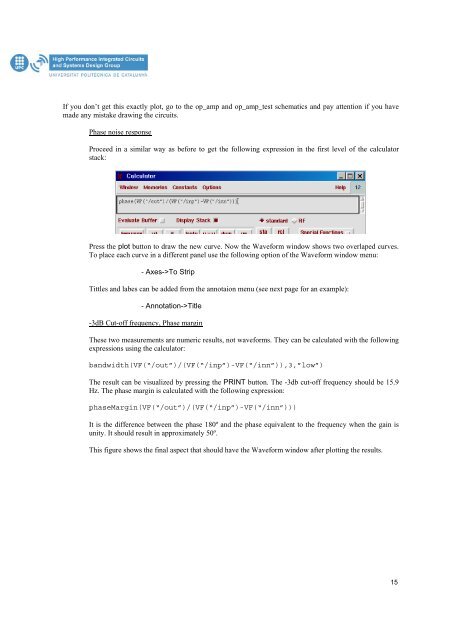
If you don’t get this exactly plot, go <strong>to</strong> the op_amp and op_amp_test schematics and pay attention if you havemade any mistake drawing the circuits.Phase noise responseProceed in a similar way as before <strong>to</strong> get the following expression in the first level of the calcula<strong>to</strong>rstack:Press the plot but<strong>to</strong>n <strong>to</strong> draw the new curve. Now the Waveform window shows two overlaped curves.To place each curve in a different panel use the following option of the Waveform window menu:- Axes->To StripTittles and labes can be added from the annotaion menu (see next page for an example):- Annotation->Title-3dB Cut-off frequency, Phase marginThese two measurements are numeric results, not waveforms. They can be calculated with the followingexpressions using the calcula<strong>to</strong>r:bandwidth(VF(“/out”)/(VF(“/inp”)-VF(“/inn”)),3,”low”)The result can be visualized by pressing the PRINT but<strong>to</strong>n. The -3db cut-off frequency should be 15.9Hz. The phase margin is calculated with the following expression:phaseMargin(VF(“/out”)/(VF(“/inp”)-VF(“/inn”)))It is the difference between the phase 180º and the phase equivalent <strong>to</strong> the frequency when the gain isunity. It should result in approximately 50º.This figure shows the final aspect that should have the Waveform window after plotting the results.15