English language version - Human Development Reports - United ...
English language version - Human Development Reports - United ...
English language version - Human Development Reports - United ...
- No tags were found...
You also want an ePaper? Increase the reach of your titles
YUMPU automatically turns print PDFs into web optimized ePapers that Google loves.
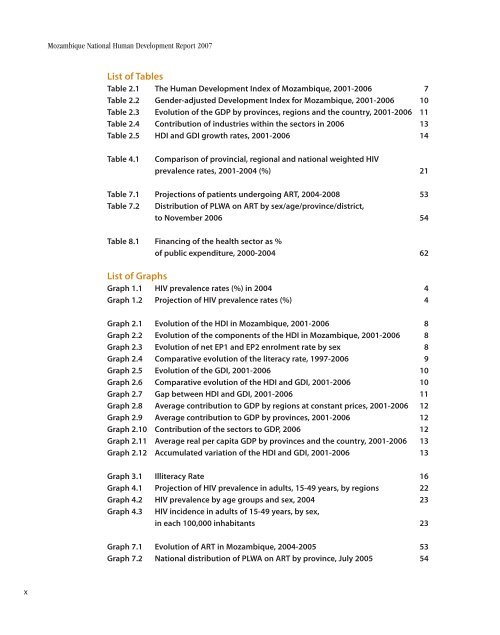
Mozambique National <strong>Human</strong> <strong>Development</strong> Report 2007List of TablesTable 2.1 The <strong>Human</strong> <strong>Development</strong> Index of Mozambique, 2001-2006 7Table 2.2 Gender-adjusted <strong>Development</strong> Index for Mozambique, 2001-2006 10Table 2.3 Evolution of the GDP by provinces, regions and the country, 2001-2006 11Table 2.4 Contribution of industries within the sectors in 2006 13Table 2.5 HDI and GDI growth rates, 2001-2006 14Table 4.1Comparison of provincial, regional and national weighted HIVprevalence rates, 2001-2004 (%) 21Table 7.1 Projections of patients undergoing ART, 2004-2008 53Table 7.2 Distribution of PLWA on ART by sex/age/province/district,to November 2006 54Table 8.1 Financing of the health sector as %of public expenditure, 2000-2004 62List of GraphsGraph 1.1 HIV prevalence rates (%) in 2004 4Graph 1.2 Projection of HIV prevalence rates (%) 4Graph 2.1 Evolution of the HDI in Mozambique, 2001-2006 8Graph 2.2 Evolution of the components of the HDI in Mozambique, 2001-2006 8Graph 2.3 Evolution of net EP1 and EP2 enrolment rate by sex 8Graph 2.4 Comparative evolution of the literacy rate, 1997-2006 9Graph 2.5 Evolution of the GDI, 2001-2006 10Graph 2.6 Comparative evolution of the HDI and GDI, 2001-2006 10Graph 2.7 Gap between HDI and GDI, 2001-2006 11Graph 2.8 Average contribution to GDP by regions at constant prices, 2001-2006 12Graph 2.9 Average contribution to GDP by provinces, 2001-2006 12Graph 2.10 Contribution of the sectors to GDP, 2006 12Graph 2.11 Average real per capita GDP by provinces and the country, 2001-2006 13Graph 2.12 Accumulated variation of the HDI and GDI, 2001-2006 13Graph 3.1 Illiteracy Rate 16Graph 4.1 Projection of HIV prevalence in adults, 15-49 years, by regions 22Graph 4.2 HIV prevalence by age groups and sex, 2004 23Graph 4.3 HIV incidence in adults of 15-49 years, by sex,in each 100,000 inhabitants 23Graph 7.1 Evolution of ART in Mozambique, 2004-2005 53Graph 7.2 National distribution of PLWA on ART by province, July 2005 54x


