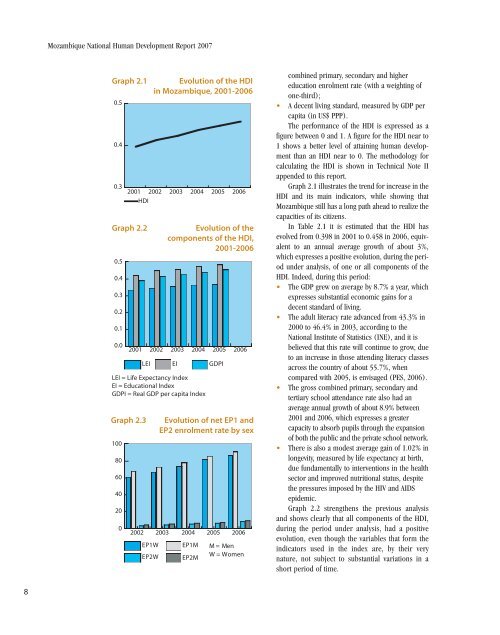
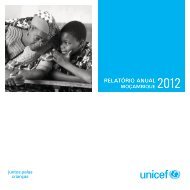
Mozambique National <strong>Human</strong> <strong>Development</strong> Report 2007Graph 2.10.50.40.32001 2002HDIGraph 2.20.50.40.30.20.10.02001LEIEvolution of the HDIin Mozambique, 2001-2006200220032003EI20042004LEI = Life Expectancy IndexEI = Educational IndexGDPI = Real GDP per capita IndexGraph 2.31008060402002002EP1WEP2W200320052005GDPI2006Evolution of thecomponents of the HDI,2001-2006200420052006Evolution of net EP1 andEP2 enrolment rate by sexEP1MEP2M2006M = MenW = Womencombined primary, secondary and highereducation enrolment rate (with a weighting ofone-third);• A decent living standard, measured by GDP percapita (in US$ PPP).The performance of the HDI is expressed as afigure between 0 and 1. A figure for the HDI near to1 shows a better level of attaining human developmentthan an HDI near to 0. The methodology forcalculating the HDI is shown in Technical Note IIappended to this report.Graph 2.1 illustrates the trend for increase in theHDI and its main indicators, while showing thatMozambique still has a long path ahead to realize thecapacities of its citizens.In Table 2.1 it is estimated that the HDI hasevolved from 0.398 in 2001 to 0.458 in 2006, equivalentto an annual average growth of about 3%,which expresses a positive evolution, during the periodunder analysis, of one or all components of theHDI. Indeed, during this period:• The GDP grew on average by 8.7% a year, whichexpresses substantial economic gains for adecent standard of living.• The adult literacy rate advanced from 43.3% in2000 to 46.4% in 2003, according to theNational Institute of Statistics (INE), and it isbelieved that this rate will continue to grow, dueto an increase in those attending literacy classesacross the country of about 55.7%, whencompared with 2005, is envisaged (PES, 2006).• The gross combined primary, secondary andtertiary school attendance rate also had anaverage annual growth of about 8.9% between2001 and 2006, which expresses a greatercapacity to absorb pupils through the expansionof both the public and the private school network.• There is also a modest average gain of 1.02% inlongevity, measured by life expectancy at birth,due fundamentally to interventions in the healthsector and improved nutritional status, despitethe pressures imposed by the HIV and AIDSepidemic.Graph 2.2 strengthens the previous analysisand shows clearly that all components of the HDI,during the period under analysis, had a positiveevolution, even though the variables that form theindicators used in the index are, by their verynature, not subject to substantial variations in ashort period of time.8
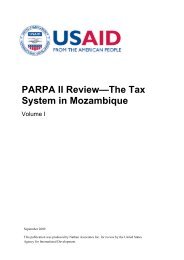
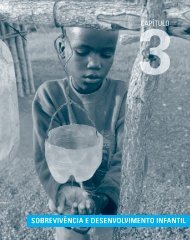
Updating <strong>Human</strong> <strong>Development</strong> in MozambiqueIn disaggregated terms, the most dynamic indicatorshave normally been the GDP index, whichreflects recent economic gains; and the joint schoolattendance rate, which expresses the gradual, butsubstantial, increase in the number of places in thecountry’s educational network, particularly as from1995 (NHDR, 2001).It is estimated that about 3.8 million pupilsattended EP1 in 2006, which is an increase of about6.0% when compared with 2005. In the same period,the number of EP2 pupils grew by 9.5% comparedwith 2005 (PES, 2006). Thus the trend towardsstrong growth in this level of education, noted sincethe 1995 school year, and particularly as from 2000,is being maintained.Obviously all this represents a trend induced bythe increased supply in the education system. Toillustrate this perception, it is enough to note, by wayof example, the school coverage forecasts, namelythat the net EP1 attendance rate rose from 83.4% in2005 to 88.3% in 2006, and that the gross admissionrate increased by 1.2%, rising from 160.6% in 2005to 162.5% in 2006 (PES 2006).These results revive the hope that, although thereis still a long way to go, Mozambique is, in relativeterms, taking an important step in reducing the deprivationsof its population (UNDP, 2001).Graph 2.4 illustrates the growth in the literacyrate among adult women, compared with men, overthe period 1997 to 2006.Graph 2.4807060504030201001997WomenComparative evolutionof the literacy rate,1997-200620002003Men2006The GDI of MozambiqueThe Gender-adjusted <strong>Development</strong> Index (GDI) is acomposite index that measures average attainment inthe three basic dimensions captured in the HDI – along and healthy life, knowledge, and a decent standardof living – adjusted to reflect the inequalitiesbetween men and women. That is, the GDI adjustsaverage attainment to reflect inequalities betweenmen and women in the three dimensions of humandevelopment.Like the HDI, the GDI is expressed as a figurebetween 0 and 1. When the GDI is equal to 1, itreflects maximum attainment in the basic capacitieswith perfect equality between men and women(though no country has ever achieved this figure).On the other hand, a GDI approaching zero reflects alarger gulf between the development attainments ofwomen and of men. The methodology used in calculatingthe GDI is shown in Technical Note III appendedto this report.The first finding on analysing the data in Table2.2 and Graph 2.5 is the existence of disparities inattainment between women and men, as the historicfigures for the GDI over the 2001-2006 period show.The figure for the GDI in 2006, still well below 0.5,shows the long journey that must be travelledtowards reducing the disparities in attainmentbetween the two sexes.Graph 2.6, in showing the comparative evolutionbetween the HDI and the GDI between 2001and 2006, confirms the trend to parallel evolutionbetween the two indicators of human development,which does at least suggest that the gap inthe levels of attainment between men and womenhas not widened (NHDR, 2001). Indeed, while theHDI recorded an average annual growth of 3.2%between 2001 and 2006, for the same period,there was an average annual growth of 3.5% in theGDI.The conclusion that may be drawn from thisresult is that, since the disparities between men andwomen are not increasing, the policies intended topromote the advancement of women, particularly asregards access to education, health and other socialservices, are making steps towards reducing the gapbetween the development attainments of the twosexes. Graph 2.7 shows the evolution of the gapbetween the human development attainments of menand women.9