Mozambique National <strong>Human</strong> <strong>Development</strong> Report 2007It’s worthwhile to note, however, that this concepttends to gain a new dimension every time thereis a generalised epidemic (average sero-prevalenceabove 5%). A most common form with which the epidemicpropagates itself is the establishment of relationswith multiple and competing partners. Thismeans that certain people simultaneously keep goinga web of generally permanent sexual partners apartfrom the official partner through wedding ties.At a time when multiple sexual partners driven bya tenacious search for survival groups together differentsocial strata, brings together sexually differentages and throws social mores and indecent exposureto the dustbin it is natural that susceptibility to infectionhas gained new forms, with hardly any differencein indicating between corridor areas, hinterland andurban areas, where the practice abounds.On the other hand, vulnerability describes certaincharacteristics of society, and of social and economicinstitutions or processes, which make it probablethat the morbidity and mortality associated withthe pandemic will have negative impacts.Vulnerability increases in social strata severelyaffected by poverty, by natural disasters, or inversely,when factors that drive and stimulate the nationaleconomy take place in areas of extreme poverty, andwhere commercial sex is common, as is sex betweenpeople of different ages, generally older men withgirls in the flower of their adolescence or youth.These two concepts explain to us why not all themembers of a community will be affected by the epidemicin the same way. The effects will have differentialrepercussions according to the levels of povertyand wealth among households, social cohesion, thelevel of development of social capital, and alsoaccording to the availability of health information,and a series of services providing care, both of publicorigin and from civil society.In the period following the discovery of the disease,the perception of vulnerabilities and susceptibilitieswas aimed at specific risk groups. This maybe explained by the fact that HIV-positive diagnoseshad been common among homosexual men andpeople who had received blood transfusions.Currently, the epidemic has taken on wider dimensions,and is effectively generalized among almost allthe age pyramids. This generalization shows that thedisease is among us, and requires cross-cuttinginterventions in all population segments.Despite this fact, the concept of vulnerable groupswhich is being applied to the Mozambican case,according to the situation analysis preceding the formulationof the National Strategy for the Struggleagainst HIV and AIDS, is expressed in groups of individualswho, by their characteristics, show a potentialto contract, transmit, or suffer directly or indirectly theconsequences of HIV and AIDS.This concept aggregates sex workers, long distancetruck drivers, miners and migrant workers ingeneral, workers in brigades away from home, soldiersin barracks or military units, commercial travellers,certain professional categories connected tothe entertainment and tourism industries, the prisonpopulation, informal vendors and workers on theirstalls, women in polygamous families, wives of minersand truck drivers, widows and women in generalin the framework of traditional society, PLWHA,OVCs, and street children (PEN 2005-09).20
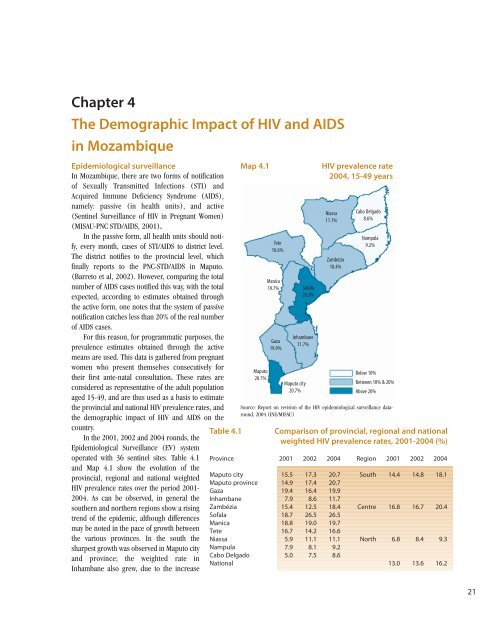
Chapter 4The Demographic Impact of HIV and AIDSin MozambiqueEpidemiological surveillanceIn Mozambique, there are two forms of notificationof Sexually Transmitted Infections (STI) andAcquired Immune Deficiency Syndrome (AIDS),namely: passive (in health units), and active(Sentinel Surveillance of HIV in Pregnant Women)(MISAU-PNC STD/AIDS, 2001).In the passive form, all health units should notify,every month, cases of STI/AIDS to district level.The district notifies to the provincial level, whichfinally reports to the PNC-STD/AIDS in Maputo.(Barreto et al, 2002). However, comparing the totalnumber of AIDS cases notified this way, with the totalexpected, according to estimates obtained throughthe active form, one notes that the system of passivenotification catches less than 20% of the real numberof AIDS cases.For this reason, for programmatic purposes, theprevalence estimates obtained through the activemeans are used. This data is gathered from pregnantwomen who present themselves consecutively fortheir first ante-natal consultation. These rates areconsidered as representative of the adult populationaged 15-49, and are thus used as a basis to estimatethe provincial and national HIV prevalence rates, andthe demographic impact of HIV and AIDS on thecountry.In the 2001, 2002 and 2004 rounds, theEpidemiological Surveillance (EV) systemoperated with 36 sentinel sites. Table 4.1and Map 4.1 show the evolution of theprovincial, regional and national weightedHIV prevalence rates over the period 2001-2004. As can be observed, in general thesouthern and northern regions show a risingtrend of the epidemic, although differencesmay be noted in the pace of growth betweenthe various provinces. In the south thesharpest growth was observed in Maputo cityand province; the weighted rate inInhambane also grew, due to the increaseTable 4.1Map 4.1Maputo20.7%Tete16.6%Manica19.7%Gaza19.9%Sofala26.5%Inhambane11.7%Maputo city20.7%HIV prevalence rate2004, 15-49 yearsNiassa11.1%Zambézia18.4%Cabo Delgado8.6%Nampula9.2%Below 10%Between 10% & 20%Above 20%Source: Report on revision of the HIV epidemiological surveillance dataround,2004 (INE/MISAU)Comparison of provincial, regional and nationalweighted HIV prevalence rates, 2001-2004 (%)Province 2001 2002 2004 Region 2001 2002 2004Maputo city 15.5 17.3 20.7 South 14.4 14.8 18.1Maputo province 14.9 17.4 20.7Gaza 19.4 16.4 19.9Inhambane 7.9 8.6 11.7Zambézia 15.4 12.5 18.4 Centre 16.8 16.7 20.4Sofala 18.7 26.5 26.5Manica 18.8 19.0 19.7Tete 16.7 14.2 16.6Niassa 5.9 11.1 11.1 North 6.8 8.4 9.3Nampula 7.9 8.1 9.2Cabo Delgado 5.0 7.5 8.6National 13.0 13.6 16.221