English language version - Human Development Reports - United ...
English language version - Human Development Reports - United ...
English language version - Human Development Reports - United ...
- No tags were found...

Create successful ePaper yourself
Turn your PDF publications into a flip-book with our unique Google optimized e-Paper software.
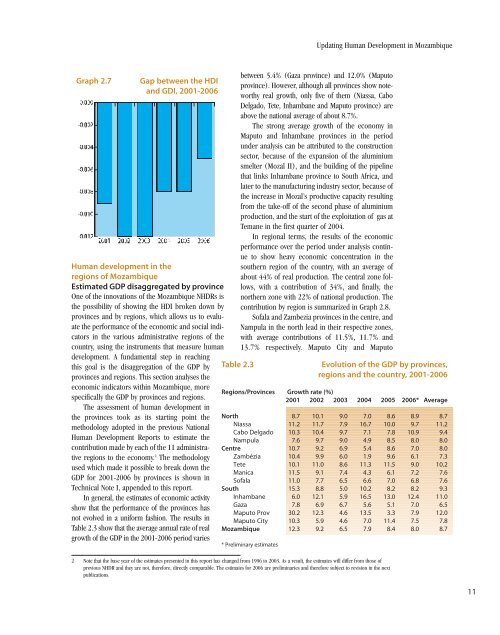
Updating <strong>Human</strong> <strong>Development</strong> in MozambiqueGraph 2.7Gap between the HDIand GDI, 2001-2006<strong>Human</strong> development in theregions of MozambiqueEstimated GDP disaggregated by provinceOne of the innovations of the Mozambique NHDRs isthe possibility of showing the HDI broken down byprovinces and by regions, which allows us to evaluatethe performance of the economic and social indicatorsin the various administrative regions of thecountry, using the instruments that measure humandevelopment. A fundamental step in reachingthis goal is the disaggregation of the GDP byprovinces and regions. This section analyses theeconomic indicators within Mozambique, morespecifically the GDP by provinces and regions.The assessment of human development inthe provinces took as its starting point themethodology adopted in the previous National<strong>Human</strong> <strong>Development</strong> <strong>Reports</strong> to estimate thecontribution made by each of the 11 administrativeregions to the economy. 2 The methodologyused which made it possible to break down theGDP for 2001-2006 by provinces is shown inTechnical Note I, appended to this report.In general, the estimates of economic activityshow that the performance of the provinces hasnot evolved in a uniform fashion. The results inTable 2.3 show that the average annual rate of realgrowth of the GDP in the 2001-2006 period variesTable 2.3between 5.4% (Gaza province) and 12.0% (Maputoprovince). However, although all provinces show noteworthyreal growth, only five of them (Niassa, CaboDelgado, Tete, Inhambane and Maputo province) areabove the national average of about 8.7%.The strong average growth of the economy inMaputo and Inhambane provinces in the periodunder analysis can be attributed to the constructionsector, because of the expansion of the aluminiumsmelter (Mozal II), and the building of the pipelinethat links Inhambane province to South Africa, andlater to the manufacturing industry sector, because ofthe increase in Mozal’s productive capacity resultingfrom the take-off of the second phase of aluminiumproduction, and the start of the exploitation of gas atTemane in the first quarter of 2004.In regional terms, the results of the economicperformance over the period under analysis continueto show heavy economic concentration in thesouthern region of the country, with an average ofabout 44% of real production. The central zone follows,with a contribution of 34%, and finally, thenorthern zone with 22% of national production. Thecontribution by region is summarized in Graph 2.8.Sofala and Zambezia provinces in the centre, andNampula in the north lead in their respective zones,with average contributions of 11.5%, 11.7% and13.7% respectively. Maputo City and MaputoEvolution of the GDP by provinces,regions and the country, 2001-2006Regions/Provinces Growth rate (%)2001 2002 2003 2004 2005 2006* AverageNorth 8.7 10.1 9.0 7.0 8.6 8.9 8.7Niassa 11.2 11.7 7.9 16.7 10.0 9.7 11.2Cabo Delgado 10.3 10.4 9.7 7.1 7.8 10.9 9.4Nampula 7.6 9.7 9.0 4.9 8.5 8.0 8.0Centre 10.7 9.2 6.9 5.4 8.6 7.0 8.0Zambézia 10.4 9.9 6.0 1.9 9.6 6.1 7.3Tete 10.1 11.0 8.6 11.3 11.5 9.0 10.2Manica 11.5 9.1 7.4 4.3 6.1 7.2 7.6Sofala 11.0 7.7 6.5 6.6 7.0 6.8 7.6South 15.3 8.8 5.0 10.2 8.2 8.2 9.3Inhambane 6.0 12.1 5.9 16.5 13.0 12.4 11.0Gaza 7.8 6.9 6.7 5.6 5.1 7.0 6.5Maputo Prov 30.2 12.3 4.6 13.5 3.3 7.9 12.0Maputo City 10.3 5.9 4.6 7.0 11.4 7.5 7.8Mozambique 12.3 9.2 6.5 7.9 8.4 8.0 8.7* Preliminary estimates2 Note that the base year of the estimates presented in this report has changed from 1996 to 2003. As a result, the estimates will differ from those ofprevious NHDR and they are not, therefore, directly comparable. The estimates for 2006 are preliminaries and therefore subject to revision in the nextpublications.11