English language version - Human Development Reports - United ...
English language version - Human Development Reports - United ...
English language version - Human Development Reports - United ...
- No tags were found...

Create successful ePaper yourself
Turn your PDF publications into a flip-book with our unique Google optimized e-Paper software.
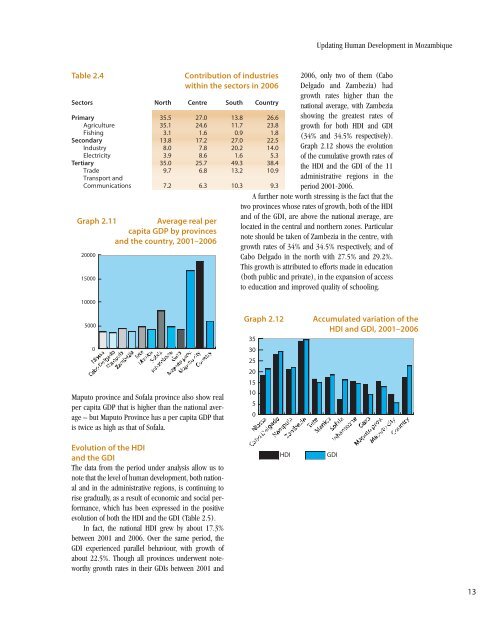
Updating <strong>Human</strong> <strong>Development</strong> in MozambiqueTable 2.4Contribution of industrieswithin the sectors in 2006Sectors North Centre South CountryPrimary 35.5 27.0 13.8 26.6Agriculture 35.1 24.6 11.7 23.8Fishing 3.1 1.6 0.9 1.8Secondary 13.8 17.2 27.0 22.5Industry 8.0 7.8 20.2 14.0Electricity 3.9 8.6 1.6 5.3Tertiary 35.0 25.7 49.3 38.4Trade 9.7 6.8 13.2 10.9Transport andCommunications 7.2 6.3 10.3 9.3Graph 2.11Average real percapita GDP by provincesand the country, 2001–20062000015000100002006, only two of them (CaboDelgado and Zambezia) hadgrowth rates higher than thenational average, with Zambeziashowing the greatest rates ofgrowth for both HDI and GDI(34% and 34.5% respectively).Graph 2.12 shows the evolutionof the cumulative growth rates ofthe HDI and the GDI of the 11administrative regions in theperiod 2001-2006.A further note worth stressing is the fact that thetwo provinces whose rates of growth, both of the HDIand of the GDI, are above the national average, arelocated in the central and northern zones. Particularnote should be taken of Zambezia in the centre, withgrowth rates of 34% and 34.5% respectively, and ofCabo Delgado in the north with 27.5% and 29.2%.This growth is attributed to efforts made in education(both public and private), in the expansion of accessto education and improved quality of schooling.50000Maputo province and Sofala province also show realper capita GDP that is higher than the national average– but Maputo Province has a per capita GDP thatis twice as high as that of Sofala.Evolution of the HDIand the GDIThe data from the period under analysis allow us tonote that the level of human development, both nationaland in the administrative regions, is continuing torise gradually, as a result of economic and social performance,which has been expressed in the positiveevolution of both the HDI and the GDI (Table 2.5).In fact, the national HDI grew by about 17.3%between 2001 and 2006. Over the same period, theGDI experienced parallel behaviour, with growth ofabout 22.5%. Though all provinces underwent noteworthygrowth rates in their GDIs between 2001 andGraph 2.1235302520151050HDIAccumulated variation of theHDI and GDI, 2001–2006GDI13