
You also want an ePaper? Increase the reach of your titles
YUMPU automatically turns print PDFs into web optimized ePapers that Google loves.
24<br />
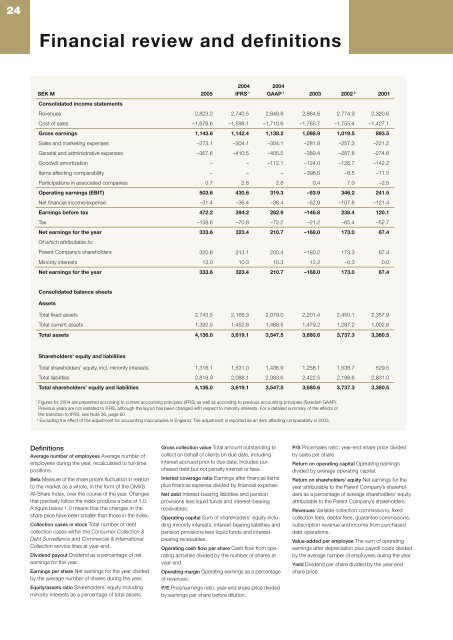
Financial review and definitions<br />
2004<br />
SEK M 2005 IFRS 1<br />
2004<br />
GAAP 1 2003 2002 2 Consolidated income statements<br />
2001<br />
Revenues 2,823.2 2,740.5 2,848.8 2,864.6 2,774.9 2,320.6<br />
Cost of sales –1,679.6 –1,598.1 –1,710.6 –1,765.7 –1,755.4 –1,427.1<br />
Gross earnings 1,143.6 1,142.4 1,138.2 1,098.9 1,019.5 893.5<br />
Sales and marketing expenses –273.1 –304.1 –304.1 –281.8 –257.3 –221.2<br />
General and administrative expenses –367.6 –410.5 –405.5 –389.4 –287.8 –274.6<br />
Goodwill amortization – – –112.1 –124.0 –126.7 –142.2<br />
Items affecting comparability – – – –398.0 –8.5 –11.5<br />
Participations in associated companies 0.7 2.8 2.8 0.4 7.0 –2.5<br />
Operating earnings (EBIT) 503.6 430.6 319.3 –93.9 346.2 241.5<br />
Net fi nancial income/expense –31.4 –36.4 –36.4 –52.9 –107.8 –121.4<br />
Earnings before tax 472.2 394.2 282.9 –146.8 238.4 120.1<br />
Tax –138.6 –70.8 –72.2 –21.2 –65.4 –52.7<br />
Net earnings for the year<br />
Of which attributable to:<br />
333.6 323.4 210.7 –168.0 173.0 67.4<br />
Parent Company’s shareholders 320.6 313.1 200.4 –180.2 173.3 67.4<br />
Minority interests 13.0 10.3 10.3 12.2 –0.3 0.0<br />
Net earnings for the year 333.6 323.4 210.7 –168.0 173.0 67.4<br />
Consolidated balance sheets<br />
Assets<br />
Total fi xed assets 2,743.5 2,166.3 2,079.0 2,201.4 2,450.1 2,357.9<br />
Total current assets 1,392.5 1,452.8 1,468.5 1,479.2 1,287.2 1,002.6<br />
Total assets 4,136.0 3,619.1 3,547.5 3,680.6 3,737.3 3,360.5<br />
Shareholders’ equity and liabilities<br />
Total shareholders’ equity, incl. minority interests 1,316.1 1,531.0 1,436.9 1,258.1 1,538.7 529.5<br />
Total liabilities 2,819.9 2,088.1 2,083.6 2,422.5 2,198.6 2,831.0<br />
Total shareholders’ equity and liabilities 4,136.0 3,619.1 3,547.5 3,680.6 3,737.3 3,360.5<br />
1 Figures for 2004 are presented according to current accounting principles (IFRS) as well as according to previous accounting principles (Swedish GAAP).<br />
Previous years are not restated to IFRS, although the layout has been changed with respect to minority interests. For a detailed summary of the effects of<br />
the transition to IFRS, see Note 36, page 60.<br />
2 Excluding the effect of the adjustment for accounting inaccuracies in England. The adjustment is reported as an item affecting comparability in 2003.<br />
Defi nitions<br />
Average number of employees Average number of<br />
employees during the year, recalculated to full-time<br />
positions.<br />
Beta Measure of the share price’s fl uctuation in relation<br />
to the market as a whole, in the form of the OMXS<br />
All-Share Index, over the course of the year. Changes<br />
that precisely follow the index produce a beta of 1.0.<br />
A fi gure below 1.0 means that the changes in the<br />
share price have been smaller than those in the index.<br />
Collection cases in stock Total number of debt<br />
collection cases within the Consumer Collection &<br />
Debt Surveillance and Commercial & International<br />
Collection service lines at year-end.<br />
Dividend payout Dividend as a percentage of net<br />
earnings for the year.<br />
Earnings per share Net earnings for the year divided<br />
by the average number of shares during the year.<br />
Equity/assets ratio Shareholders’ equity including<br />
minority interests as a percentage of total assets.<br />
Gross collection value Total amount outstanding to<br />
collect on behalf of clients on due date, including<br />
interest accrued prior to due date. Includes purchased<br />
debt but not penalty interest or fees.<br />
Interest coverage ratio Earnings after fi nancial items<br />
plus fi nancial expense divided by fi nancial expense.<br />
Net debt Interest-bearing liabilities and pension<br />
provisions less liquid funds and interest-bearing<br />
receivables.<br />
Operating capital Sum of shareholders’ equity including<br />
minority interests, interest-bearing liabilities and<br />
pension provisions less liquid funds and interestbearing<br />
receivables.<br />
Operating cash fl ow per share Cash fl ow from operating<br />
activities divided by the number of shares at<br />
year-end.<br />
Operating margin Operating earnings as a percentage<br />
of revenues.<br />
P/E Price/earnings ratio: year-end share price divided<br />
by earnings per share before dilution.<br />
P/S Price/sales ratio: year-end share price divided<br />
by sales per share.<br />
Return on operating capital Operating earnings<br />
divided by average operating capital.<br />
Return on shareholders’ equity Net earnings for the<br />
year attributable to the Parent Company’s shareholders<br />
as a percentage of average shareholders’ equity<br />
attributable to the Parent Company’s shareholders.<br />
Revenues Variable collection commissions, fi xed<br />
collection fees, debtor fees, guarantee commissions,<br />
subscription revenue and income from purchased<br />
debt operations.<br />
Value-added per employee The sum of operating<br />
earnings after depreciation plus payroll costs divided<br />
by the average number of employees during the year.<br />
Yield Dividend per share divided by the year-end<br />
share price.