buletin Åtiin ific - Facultatea de Stiinte Economice - Universitatea din ...
buletin Åtiin ific - Facultatea de Stiinte Economice - Universitatea din ...
buletin Åtiin ific - Facultatea de Stiinte Economice - Universitatea din ...
- No tags were found...

You also want an ePaper? Increase the reach of your titles
YUMPU automatically turns print PDFs into web optimized ePapers that Google loves.
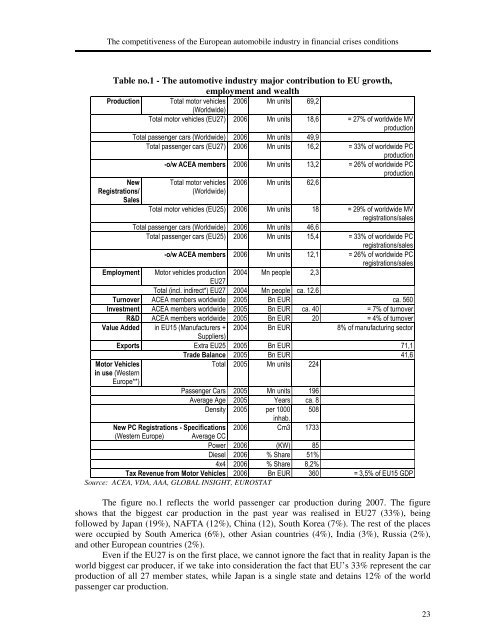
The competitiveness of the European automobile industry in financial crises conditionsTable no.1 - The automotive industry major contribution to EU growth,employment and wealthProduction Total motor vehicles 2006 Mn units 69,2(Worldwi<strong>de</strong>)Total motor vehicles (EU27) 2006 Mn units 18,6 = 27% of worldwi<strong>de</strong> MVproductionTotal passenger cars (Worldwi<strong>de</strong>) 2006 Mn units 49,9Total passenger cars (EU27) 2006 Mn units 16,2 = 33% of worldwi<strong>de</strong> PCproduction-o/w ACEA members 2006 Mn units 13,2 = 26% of worldwi<strong>de</strong> PCproductionNew Total motor vehicles 2006 Mn units 62,6Registrations/Sales(Worldwi<strong>de</strong>)Total motor vehicles (EU25) 2006 Mn units 18 = 29% of worldwi<strong>de</strong> MVregistrations/salesTotal passenger cars (Worldwi<strong>de</strong>) 2006 Mn units 46,6Total passenger cars (EU25) 2006 Mn units 15,4 = 33% of worldwi<strong>de</strong> PCregistrations/sales-o/w ACEA members 2006 Mn units 12,1 = 26% of worldwi<strong>de</strong> PCregistrations/salesEmployment Motor vehicles production 2004 Mn people 2,3EU27Total (incl. indirect*) EU27 2004 Mn people ca. 12.6Turnover ACEA members worldwi<strong>de</strong> 2005 Bn EUR ca. 560Investment ACEA members worldwi<strong>de</strong> 2005 Bn EUR ca. 40 = 7% of turnoverR&D ACEA members worldwi<strong>de</strong> 2005 Bn EUR 20 = 4% of turnoverValue Ad<strong>de</strong>d in EU15 (Manufacturers + 2004 Bn EUR 8% of manufacturing sectorSuppliers)Exports Extra EU25 2005 Bn EUR 71,1Motor Vehiclesin use (WesternEurope**)Tra<strong>de</strong> Balance 2005 Bn EUR 41,6Total 2005 Mn units 224Passenger Cars 2005 Mn units 196Average Age 2005 Years ca. 8Density 2005 per 1000 508inhab.New PC Registrations - Spec<strong>ific</strong>ations 2006 Cm3 1733(Western Europe) Average CCPower 2006 (KW) 85Diesel 2006 % Share 51%4x4 2006 % Share 8,2%Tax Revenue from Motor Vehicles 2006 Bn EUR 360 = 3,5% of EU15 GDPSource: ACEA, VDA, AAA, GLOBAL INSIGHT, EUROSTATThe figure no.1 reflects the world passenger car production during 2007. The figureshows that the biggest car production in the past year was realised in EU27 (33%), beingfollowed by Japan (19%), NAFTA (12%), China (12), South Korea (7%). The rest of the placeswere occupied by South America (6%), other Asian countries (4%), India (3%), Russia (2%),and other European countries (2%).Even if the EU27 is on the first place, we cannot ignore the fact that in reality Japan is theworld biggest car producer, if we take into consi<strong>de</strong>ration the fact that EU’s 33% represent the carproduction of all 27 member states, while Japan is a single state and <strong>de</strong>tains 12% of the worldpassenger car production.23