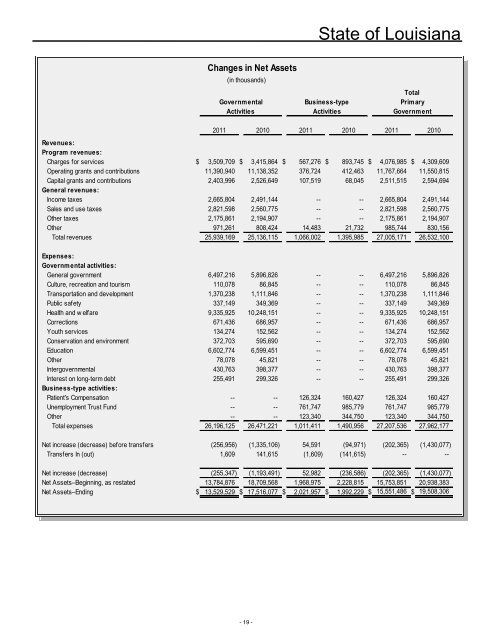
State <strong>of</strong> <strong>Louisiana</strong>Net Assets:As noted earlier, the overall financial position for the State decreased (20.3%) from the previous year with net assetsdecreasing to $15.6 billion. Net assets for governmental activities decreased by $4 billion (22.8%) and net assets forbusiness-type activities increased by $29.7 million (1.5%). The largest portion <strong>of</strong> the net assets <strong>of</strong> the State, $12.1billion (77.7%), reflects investment in capital assets (e.g., land, roads, buildings, machinery, and equipment) net <strong>of</strong>related debt. These net assets are used to provide services to residents <strong>of</strong> the State, and consequently are notavailable for future spending. Capital assets decreased by $2.6 billion (14.2%), due mainly to the State changing theaccounting method used to record infrastructure from a total expenditure based approach (the Wooster method) to anindividual asset approach. The change resulted in a 672% increase in construction in progress, and a 45.5% reductionin infrastructure for governmental activities. The 2010 condensed financial statements were not restated to reflect theprior period adjustment in infrastructure, however the beginning net assets for the <strong>2011</strong> condensed financial statementswere restated. A more detailed explanation <strong>of</strong> the decline in infrastructure is provided in Note 10, Fund Balance/NetAsset Disclosures (page 107).In contrast, current and other assets (e.g., cash, investments, receivables, and inventory) totaled $17.6 billion (53.1%) <strong>of</strong>total assets at fiscal year-end; the State uses these resources in part to repay debt associated with capital assets. Thecurrent and other assets <strong>of</strong> the State at June 30, <strong>2011</strong>, represent a less than 1% decrease from the prior fiscal year.Cash and investments have decreased by $1.2 billion (10.4%), largely due to the downturn in the economy and the verylow interest rate environment experienced over the past fiscal year.Restricted net assets represent those assets not available for spending as a result <strong>of</strong> legislative or constitutionalrequirements, donor agreements, or grant requirements. Restricted net assets decreased by $88 million (1.7%) fromthe previous fiscal year for governmental activities, reflecting a decrease in assets restricted for purposes other thandebt service and capital projects <strong>of</strong> $119 million (2.4%). Restricted net assets for funds held as permanent investmentsincreased by $132 million (5.2%) over last year. At June 30, <strong>2011</strong> the State had $2.5 billion restricted asnonexpendable permanent fund principal and $161 million restricted as expendable portions <strong>of</strong> permanent funds.Restricted net assets decreased by $142 million (13.5%) for business-type activities, and was primarily caused by adecrease in the amount restricted for unemployment compensation, which is reported in the Unemployment Trust Fund.Balances in the fund continue to decrease reflecting the relatively high number <strong>of</strong> unemployment claims following lay<strong>of</strong>fs,which were related to the downturn in the nation’s economy.For fiscal year <strong>2011</strong>, unrestricted net assets decreased by $1 billion (44.2%) from the previous year for governmentalactivities. A large portion <strong>of</strong> this decrease is due to the recessionary environment, which continues to negatively impactstate revenue sources. Although revenues increased and expenditures decreased, expenditures still exceededrevenues which resulted in decline <strong>of</strong> net assets. A more detailed explanation <strong>of</strong> the change in revenues is provided onpage 21.Unrestricted net assets increased by $124 million (16%) for business-type activities. This increase is due mostly to thePatient’s Compensation Fund Oversight Board collecting $65 million more in assessments than it paid out in claims.The purpose <strong>of</strong> the Patient’s Compensation Fund Oversight Board is to guarantee that affordable, medical malpracticecoverage is available to all private healthcare providers and to provide a certain, stable source <strong>of</strong> compensation forlegitimate injured parties <strong>of</strong> medical malpractice.Changes in Net Assets:(on the following page)- 18 -
State <strong>of</strong> <strong>Louisiana</strong>Changes in Net Assets(in thousands)GovernmentalActivitiesBusiness-typeActivitiesTotalPrimaryGovernment<strong>2011</strong> 2010 <strong>2011</strong> 2010 <strong>2011</strong> 2010Revenues:Program revenues:Charges for services $ 3,509,709 $ 3,415,864 $ 567,276 $ 893,745 $ 4,076,985 $ 4,309,609Operating grants and contributions 11,390,940 11,138,352 376,724 412,463 11,767,664 11,550,815Capital grants and contributions 2,403,996 2,526,649 107,519 68,045 2,511,515 2,594,694General revenues:Income taxes 2,665,804 2,491,144 -- -- 2,665,804 2,491,144Sales and use taxes 2,821,598 2,560,775 -- -- 2,821,598 2,560,775Other taxes 2,175,861 2,194,907 -- -- 2,175,861 2,194,907Other 971,261 808,424 14,483 21,732 985,744 830,156Total revenues 25,939,169 25,136,115 1,066,002 1,395,985 27,005,171 26,532,100Expenses:Governmental activities:General government 6,497,216 5,896,826 -- -- 6,497,216 5,896,826Culture, recreation and tourism 110,078 86,845 -- -- 110,078 86,845Transportation and development 1,370,238 1,111,846 -- -- 1,370,238 1,111,846Public safety 337,149 349,369 -- -- 337,149 349,369Health and w elfare 9,335,925 10,248,151 -- -- 9,335,925 10,248,151Corrections 671,436 686,957 -- -- 671,436 686,957Youth services 134,274 152,562 -- -- 134,274 152,562Conservation and environment 372,703 595,690 -- -- 372,703 595,690Education 6,602,774 6,599,451 -- -- 6,602,774 6,599,451Other 78,078 45,821 -- -- 78,078 45,821Intergovernmental 430,763 398,377 -- -- 430,763 398,377Interest on long-term debt 255,491 299,326 -- -- 255,491 299,326Business-type activities:Patient's Compensation -- -- 126,324 160,427 126,324 160,427Unemployment Trust Fund -- -- 761,747 985,779 761,747 985,779Other -- -- 123,340 344,750 123,340 344,750Total expenses 26,196,125 26,471,221 1,011,411 1,490,956 27,207,536 27,962,177Net increase (decrease) before transfers (256,956) (1,335,106) 54,591 (94,971) (202,365) (1,430,077)Transfers In (out) 1,609 141,615 (1,609) (141,615) -- --Net increase (decrease) (255,347) (1,193,491) 52,982 (236,586) (202,365) (1,430,077)Net Assets–Beginning, as restated 13,784,876 18,709,568 1,968,975 2,228,815 15,753,851 20,938,383Net Assets–Ending $ 13,529,529 $ 17,516,077 $ 2,021,957 $ 1,992,229 $ 15,551,486 $ 19,508,306- 19 -