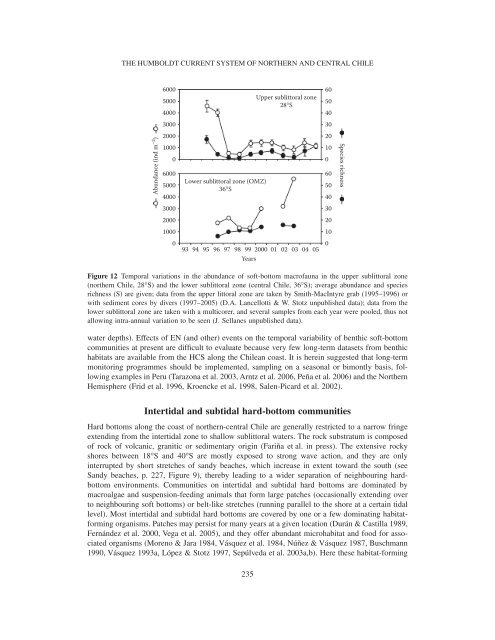
MARTIN THIEL ET AL.biomass (Palma et al. 2005). On average, pooling <strong>the</strong> data for <strong>the</strong> three transects, abundance (~500ind. m −2 ) <strong>and</strong> species number (~25) peaks were located between 1000 <strong>and</strong> 1500 m depth.Temporal patterns <strong>of</strong> variability in shelf communitiesAs explained in previous sections <strong>of</strong> this review, <strong>the</strong> coastal zone <strong>of</strong>f nor<strong>the</strong>rn <strong>and</strong> <strong>central</strong> Chile isstrongly influenced by seasonal wind-driven upwelling, giving rise to one <strong>of</strong> <strong>the</strong> areas with <strong>the</strong>highest PP rates known worldwide (Fossing et al. 1995, Daneri et al. 2000). Since water columnoxygen conditions <strong>and</strong> sediment organic loadings fluctuate at both intra- (i.e., seasonal) <strong>and</strong>interannual scales (i.e., ENSO cycle), some degree <strong>of</strong> coupling with <strong>the</strong> dynamics <strong>of</strong> benthiccommunities is expected (Tomicic 1985, Arntz & Fahrbach 1991). This has been demonstrated forsou<strong>the</strong>rn-<strong>central</strong> Chile (~36°S), where seasonal <strong>and</strong> interannual changes in upwelling intensity canlead to changes in bottom-water dissolved oxygen concentration, in <strong>the</strong> amount <strong>of</strong> OM reaching<strong>the</strong> bottom (Gutiérrez et al. 2000), in <strong>the</strong> quality <strong>and</strong> lability <strong>of</strong> deposited OM (Neira et al. 2001,Sellanes & Neira 2006) <strong>and</strong> in <strong>the</strong> sediment nitrogen fluxes (P. Muñoz et al. 2004b). During <strong>the</strong>last strong EN event (1997–1998), important insights were gained by examining <strong>the</strong> effects <strong>of</strong>changing environmental conditions on local bacterial, mei<strong>of</strong>aunal (Neira et al. 2001, Sellanes et al.2003) <strong>and</strong> macr<strong>of</strong>aunal (Gutiérrez et al. 2000) communities <strong>of</strong>f <strong>central</strong> Chile. The largest biomasses<strong>of</strong> <strong>the</strong> bacterial component have been observed after several years <strong>of</strong> upwelling-favourable conditions,which are associated with cold LN phases <strong>of</strong> <strong>the</strong> ENSO (V.A. Gallardo et al. unpublisheddata), while <strong>the</strong> bacterial biomass is effectively depressed during warm EN phases. A decreasingtrend in macr<strong>of</strong>aunal density, as well as <strong>the</strong> presence <strong>of</strong> deeper-burrowing infauna, evolved toward<strong>the</strong> end <strong>of</strong> EN 1997–1998, mainly due to <strong>the</strong> decrease <strong>of</strong> <strong>the</strong> polychaete Paraprionospio pinnata(Gutiérrez et al. 2000). It appears that more oxygenated bottom waters <strong>and</strong> oxidised sediment duringEN caused P. pinnata to fail in its summer recruitment. In addition, it is probable that increasedcompetition <strong>and</strong> predation by o<strong>the</strong>r species have contributed to its decline. Indeed, it has beenreported that during EN, many subtropical predators invade <strong>the</strong> coastal areas (Arntz et al. 1991),negatively affecting <strong>the</strong> surface-feeding polychaetes (Tarazona et al. 1996). In <strong>central</strong> Chile,P. pinnata recovered its numerical dominance only in summer 2003, i.e., 5 yr after <strong>the</strong> end <strong>of</strong> EN.Severe hypoxic <strong>and</strong> sulphidic conditions that developed during summer 2003 probably eliminatedor precluded possible competitors <strong>and</strong>/or predators, triggering <strong>the</strong> explosive increase <strong>of</strong> <strong>the</strong>P. pinnata population during this period (Sellanes et al. 2007).In nor<strong>the</strong>rn Chile (20–30°S) few datasets extending over at least 12 months are available fromshallow benthic communities (20–80 m). For <strong>the</strong> time period 1990–1995, relatively high abundances<strong>of</strong> polychaetes have been reported from several stations in nor<strong>the</strong>rn Chile (23°50′S) at water depths<strong>of</strong> 50–60 m (Carrasco 1997). This author remarked on <strong>the</strong> absence <strong>of</strong> a clear seasonal signal inabundance changes <strong>of</strong> <strong>the</strong> main polychaete species, <strong>and</strong> he suggested that <strong>the</strong> observed variationsra<strong>the</strong>r reflected long-term patterns. At a long-term monitoring station near 28°S, abundances <strong>of</strong>polychaetes were high in 1995 (Figure 12), comparable to those found by Carrasco (1997). Highabundance, biomass <strong>and</strong> species diversity at 28°S were associated with <strong>the</strong> warm period 1993–1995<strong>and</strong> followed by a strong decline in 1996, coincident with LN conditions, which continued during<strong>the</strong> EN 1997–1998 (Lancellotti 2002, D. Lancellotti & W. Stotz unpublished data). Gradual disappearance<strong>of</strong> spionids, as observed in Huasco in 1996 during LN (Figure 12), was also observedduring <strong>the</strong> same time period in Iquique (20°S) between 9 <strong>and</strong> 30 m depth (Quiroga et al. 1999).In nor<strong>the</strong>rn-<strong>central</strong> Chile, during EN events, increased wave activity <strong>and</strong> freshwater run<strong>of</strong>f arefrequent, in contrast to calmer periods recorded during LN events. Turbulence <strong>and</strong> run<strong>of</strong>f, in a zonewhere rains <strong>and</strong> strong storms are uncommon, probably oxygenate <strong>the</strong> water column, resuspendOM <strong>and</strong>/or provide terrigenous material, thus favouring reproduction <strong>and</strong> settlement <strong>of</strong> macrobenthicspecies living below <strong>the</strong> zone <strong>of</strong> direct wave <strong>and</strong> sediment deposition impact (>20 m234
THE HUMBOLDT CURRENT SYSTEM OF NORTHERN AND CENTRAL CHILE60005000400030002000Upper sublittoral zone28°S6050403020100Abundance (ind m −2 )100006000500040003000200010000Lower sublittoral zone (OMZ)36°S6050403020100Species richness93 94 95 96 97 98 99 2000 01 02 03 04 05YearsFigure 12 Temporal variations in <strong>the</strong> abundance <strong>of</strong> s<strong>of</strong>t-bottom macr<strong>of</strong>auna in <strong>the</strong> upper sublittoral zone(nor<strong>the</strong>rn Chile, 28°S) <strong>and</strong> <strong>the</strong> lower sublittoral zone (<strong>central</strong> Chile, 36°S); average abundance <strong>and</strong> speciesrichness (S) are given; data from <strong>the</strong> upper littoral zone are taken by Smith-MacIntyre grab (1995–1996) orwith sediment cores by divers (1997–2005) (D.A. Lancellotti & W. Stotz unpublished data); data from <strong>the</strong>lower sublittoral zone are taken with a multicorer, <strong>and</strong> several samples from each year were pooled, thus notallowing intra-annual variation to be seen (J. Sellanes unpublished data).water depths). Effects <strong>of</strong> EN (<strong>and</strong> o<strong>the</strong>r) events on <strong>the</strong> temporal variability <strong>of</strong> benthic s<strong>of</strong>t-bottomcommunities at present are difficult to evaluate because very few long-term datasets from benthichabitats are available from <strong>the</strong> HCS along <strong>the</strong> Chilean coast. It is herein suggested that long-termmonitoring programmes should be implemented, sampling on a seasonal or bimontly basis, followingexamples in Peru (Tarazona et al. 2003, Arntz et al. 2006, Peña et al. 2006) <strong>and</strong> <strong>the</strong> Nor<strong>the</strong>rnHemisphere (Frid et al. 1996, Kroencke et al. 1998, Salen-Picard et al. 2002).Intertidal <strong>and</strong> subtidal hard-bottom communitiesHard bottoms along <strong>the</strong> coast <strong>of</strong> nor<strong>the</strong>rn-<strong>central</strong> Chile are generally restricted to a narrow fringeextending from <strong>the</strong> intertidal zone to shallow sublittoral waters. The rock substratum is composed<strong>of</strong> rock <strong>of</strong> volcanic, granitic or sedimentary origin (Fariña et al. in press). The extensive rockyshores between 18°S <strong>and</strong> 40°S are mostly exposed to strong wave action, <strong>and</strong> <strong>the</strong>y are onlyinterrupted by short stretches <strong>of</strong> s<strong>and</strong>y beaches, which increase in extent toward <strong>the</strong> south (seeS<strong>and</strong>y beaches, p. 227, Figure 9), <strong>the</strong>reby leading to a wider separation <strong>of</strong> neighbouring hardbottomenvironments. Communities on intertidal <strong>and</strong> subtidal hard bottoms are dominated bymacroalgae <strong>and</strong> suspension-feeding animals that form large patches (occasionally extending overto neighbouring s<strong>of</strong>t bottoms) or belt-like stretches (running parallel to <strong>the</strong> shore at a certain tidallevel). Most intertidal <strong>and</strong> subtidal hard bottoms are covered by one or a few dominating habitatformingorganisms. Patches may persist for many years at a given location (Durán & Castilla 1989,Fernández et al. 2000, Vega et al. 2005), <strong>and</strong> <strong>the</strong>y <strong>of</strong>fer abundant microhabitat <strong>and</strong> food for associatedorganisms (Moreno & Jara 1984, Vásquez et al. 1984, Núñez & Vásquez 1987, Buschmann1990, Vásquez 1993a, López & Stotz 1997, Sepúlveda et al. 2003a,b). Here <strong>the</strong>se habitat-forming235