

Analysis of microarray data - VSN International
Analysis of microarray data - VSN International
Analysis of microarray data - VSN International
- No tags were found...

You also want an ePaper? Increase the reach of your titles
YUMPU automatically turns print PDFs into web optimized ePapers that Google loves.
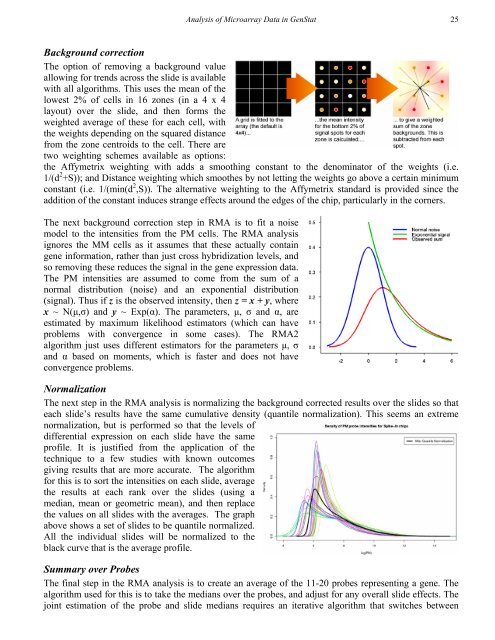
<strong>Analysis</strong> <strong>of</strong> Microarray Data in GenStat 25Background correctionThe option <strong>of</strong> removing a background valueallowing for trends across the slide is availablewith all algorithms. This uses the mean <strong>of</strong> thelowest 2% <strong>of</strong> cells in 16 zones (in a 4 x 4layout) over the slide, and then forms theweighted average <strong>of</strong> these for each cell, withthe weights depending on the squared distancefrom the zone centroids to the cell. There aretwo weighting schemes available as options:the Affymetrix weighting with adds a smoothing constant to the denominator <strong>of</strong> the weights (i.e.1/(d 2 +S)); and Distance weighting which smoothes by not letting the weights go above a certain minimumconstant (i.e. 1/(min(d 2 ,S)). The alternative weighting to the Affymetrix standard is provided since theaddition <strong>of</strong> the constant induces strange effects around the edges <strong>of</strong> the chip, particularly in the corners.The next background correction step in RMA is to fit a noisemodel to the intensities from the PM cells. The RMA analysisignores the MM cells as it assumes that these actually containgene information, rather than just cross hybridization levels, andso removing these reduces the signal in the gene expression <strong>data</strong>.The PM intensities are assumed to come from the sum <strong>of</strong> anormal distribution (noise) and an exponential distribution(signal). Thus if z is the observed intensity, then z = x + y, wherex ~ N(μ,σ) and y ~ Exp(α). The parameters, μ, σ and α, areestimated by maximum likelihood estimators (which can haveproblems with convergence in some cases). The RMA2algorithm just uses different estimators for the parameters μ, σand α based on moments, which is faster and does not haveconvergence problems.NormalizationThe next step in the RMA analysis is normalizing the background corrected results over the slides so thateach slide’s results have the same cumulative density (quantile normalization). This seems an extremenormalization, but is performed so that the levels <strong>of</strong>differential expression on each slide have the samepr<strong>of</strong>ile. It is justified from the application <strong>of</strong> thetechnique to a few studies with known outcomesgiving results that are more accurate. The algorithmfor this is to sort the intensities on each slide, averagethe results at each rank over the slides (using amedian, mean or geometric mean), and then replacethe values on all slides with the averages. The graphabove shows a set <strong>of</strong> slides to be quantile normalized.All the individual slides will be normalized to theblack curve that is the average pr<strong>of</strong>ile.Summary over ProbesThe final step in the RMA analysis is to create an average <strong>of</strong> the 11-20 probes representing a gene. Thealgorithm used for this is to take the medians over the probes, and adjust for any overall slide effects. Thejoint estimation <strong>of</strong> the probe and slide medians requires an iterative algorithm that switches between


