

Analysis of microarray data - VSN International
Analysis of microarray data - VSN International
Analysis of microarray data - VSN International
- No tags were found...

You also want an ePaper? Increase the reach of your titles
YUMPU automatically turns print PDFs into web optimized ePapers that Google loves.
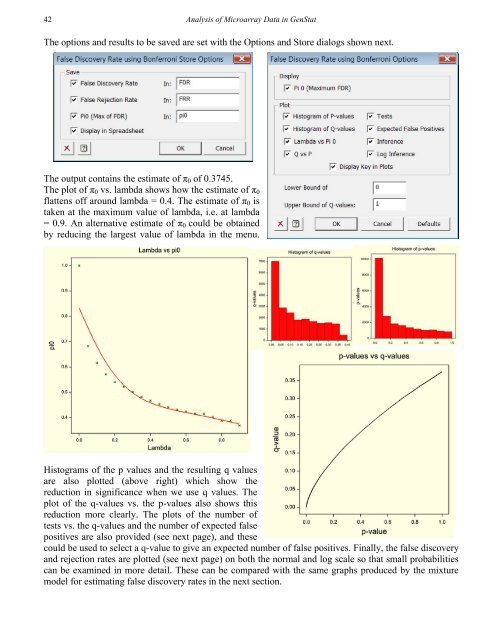
42<strong>Analysis</strong> <strong>of</strong> Microarray Data in GenStatThe options and results to be saved are set with the Options and Store dialogs shown next.The output contains the estimate <strong>of</strong> π 0 <strong>of</strong> 0.3745.The plot <strong>of</strong> π 0 vs. lambda shows how the estimate <strong>of</strong> π 0flattens <strong>of</strong>f around lambda = 0.4. The estimate <strong>of</strong> π 0 istaken at the maximum value <strong>of</strong> lambda, i.e. at lambda= 0.9. An alternative estimate <strong>of</strong> π 0 could be obtainedby reducing the largest value <strong>of</strong> lambda in the menu.Histograms <strong>of</strong> the p values and the resulting q valuesare also plotted (above right) which show thereduction in significance when we use q values. Theplot <strong>of</strong> the q-values vs. the p-values also shows thisreduction more clearly. The plots <strong>of</strong> the number <strong>of</strong>tests vs. the q-values and the number <strong>of</strong> expected falsepositives are also provided (see next page), and thesecould be used to select a q-value to give an expected number <strong>of</strong> false positives. Finally, the false discoveryand rejection rates are plotted (see next page) on both the normal and log scale so that small probabilitiescan be examined in more detail. These can be compared with the same graphs produced by the mixturemodel for estimating false discovery rates in the next section.


