

Analysis of microarray data - VSN International
Analysis of microarray data - VSN International
Analysis of microarray data - VSN International
- No tags were found...

Create successful ePaper yourself
Turn your PDF publications into a flip-book with our unique Google optimized e-Paper software.
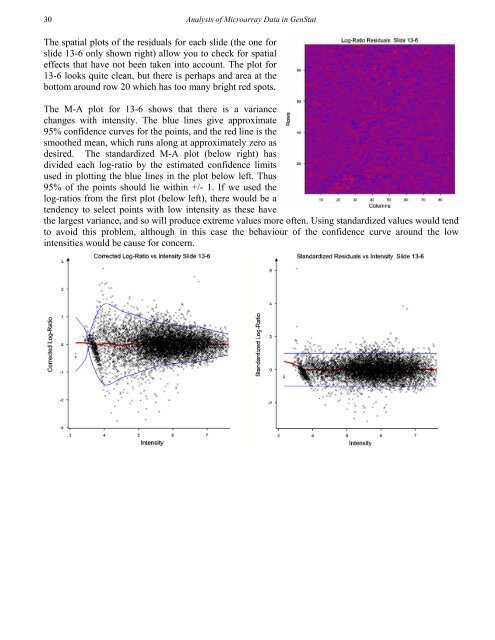
30<strong>Analysis</strong> <strong>of</strong> Microarray Data in GenStatThe spatial plots <strong>of</strong> the residuals for each slide (the one forslide 13-6 only shown right) allow you to check for spatialeffects that have not been taken into account. The plot for13-6 looks quite clean, but there is perhaps and area at thebottom around row 20 which has too many bright red spots.The M-A plot for 13-6 shows that there is a variancechanges with intensity. The blue lines give approximate95% confidence curves for the points, and the red line is thesmoothed mean, which runs along at approximately zero asdesired. The standardized M-A plot (below right) hasdivided each log-ratio by the estimated confidence limitsused in plotting the blue lines in the plot below left. Thus95% <strong>of</strong> the points should lie within +/- 1. If we used thelog-ratios from the first plot (below left), there would be atendency to select points with low intensity as these havethe largest variance, and so will produce extreme values more <strong>of</strong>ten. Using standardized values would tendto avoid this problem, although in this case the behaviour <strong>of</strong> the confidence curve around the lowintensities would be cause for concern.


