

Analysis of microarray data - VSN International
Analysis of microarray data - VSN International
Analysis of microarray data - VSN International
- No tags were found...

You also want an ePaper? Increase the reach of your titles
YUMPU automatically turns print PDFs into web optimized ePapers that Google loves.
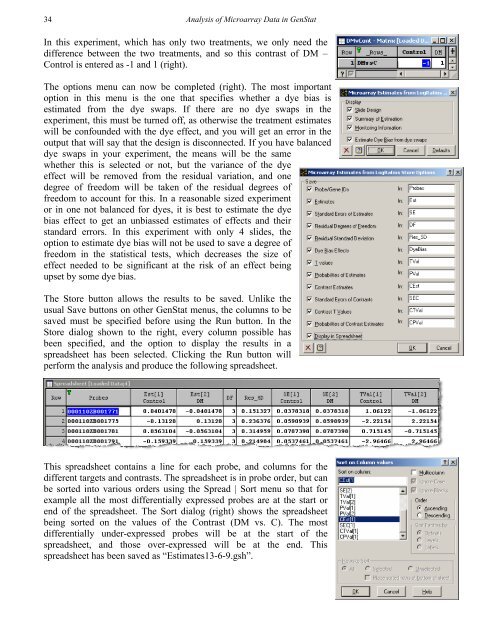
34<strong>Analysis</strong> <strong>of</strong> Microarray Data in GenStatIn this experiment, which has only two treatments, we only need thedifference between the two treatments, and so this contrast <strong>of</strong> DM –Control is entered as -1 and 1 (right).The options menu can now be completed (right). The most importantoption in this menu is the one that specifies whether a dye bias isestimated from the dye swaps. If there are no dye swaps in theexperiment, this must be turned <strong>of</strong>f, as otherwise the treatment estimateswill be confounded with the dye effect, and you will get an error in theoutput that will say that the design is disconnected. If you have balanceddye swaps in your experiment, the means will be the samewhether this is selected or not, but the variance <strong>of</strong> the dyeeffect will be removed from the residual variation, and onedegree <strong>of</strong> freedom will be taken <strong>of</strong> the residual degrees <strong>of</strong>freedom to account for this. In a reasonable sized experimentor in one not balanced for dyes, it is best to estimate the dyebias effect to get an unbiassed estimates <strong>of</strong> effects and theirstandard errors. In this experiment with only 4 slides, theoption to estimate dye bias will not be used to save a degree <strong>of</strong>freedom in the statistical tests, which decreases the size <strong>of</strong>effect needed to be significant at the risk <strong>of</strong> an effect beingupset by some dye bias.The Store button allows the results to be saved. Unlike theusual Save buttons on other GenStat menus, the columns to besaved must be specified before using the Run button. In theStore dialog shown to the right, every column possible hasbeen specified, and the option to display the results in aspreadsheet has been selected. Clicking the Run button willperform the analysis and produce the following spreadsheet.This spreadsheet contains a line for each probe, and columns for thedifferent targets and contrasts. The spreadsheet is in probe order, but canbe sorted into various orders using the Spread | Sort menu so that forexample all the most differentially expressed probes are at the start orend <strong>of</strong> the spreadsheet. The Sort dialog (right) shows the spreadsheetbeing sorted on the values <strong>of</strong> the Contrast (DM vs. C). The mostdifferentially under-expressed probes will be at the start <strong>of</strong> thespreadsheet, and those over-expressed will be at the end. Thisspreadsheet has been saved as “Estimates13-6-9.gsh”.


