

Analysis of microarray data - VSN International
Analysis of microarray data - VSN International
Analysis of microarray data - VSN International
- No tags were found...

You also want an ePaper? Increase the reach of your titles
YUMPU automatically turns print PDFs into web optimized ePapers that Google loves.
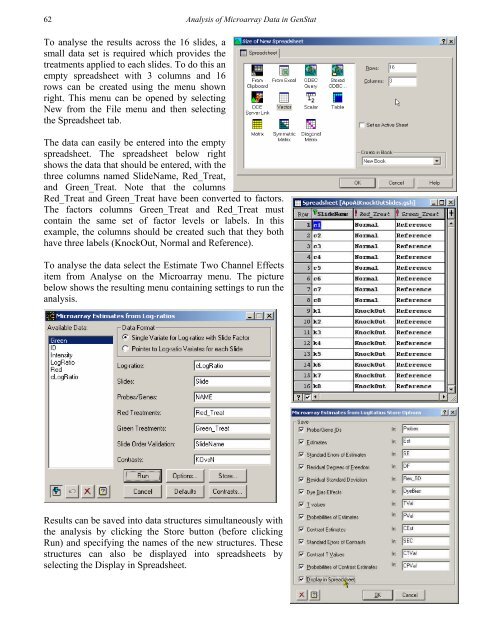
62<strong>Analysis</strong> <strong>of</strong> Microarray Data in GenStatTo analyse the results across the 16 slides, asmall <strong>data</strong> set is required which provides thetreatments applied to each slides. To do this anempty spreadsheet with 3 columns and 16rows can be created using the menu shownright. This menu can be opened by selectingNew from the File menu and then selectingthe Spreadsheet tab.The <strong>data</strong> can easily be entered into the emptyspreadsheet. The spreadsheet below rightshows the <strong>data</strong> that should be entered, with thethree columns named SlideName, Red_Treat,and Green_Treat. Note that the columnsRed_Treat and Green_Treat have been converted to factors.The factors columns Green_Treat and Red_Treat mustcontain the same set <strong>of</strong> factor levels or labels. In thisexample, the columns should be created such that they bothhave three labels (KnockOut, Normal and Reference).To analyse the <strong>data</strong> select the Estimate Two Channel Effectsitem from Analyse on the Microarray menu. The picturebelow shows the resulting menu containing settings to run theanalysis.Results can be saved into <strong>data</strong> structures simultaneously withthe analysis by clicking the Store button (before clickingRun) and specifying the names <strong>of</strong> the new structures. Thesestructures can also be displayed into spreadsheets byselecting the Display in Spreadsheet.


