

Analysis of microarray data - VSN International
Analysis of microarray data - VSN International
Analysis of microarray data - VSN International
- No tags were found...

Create successful ePaper yourself
Turn your PDF publications into a flip-book with our unique Google optimized e-Paper software.
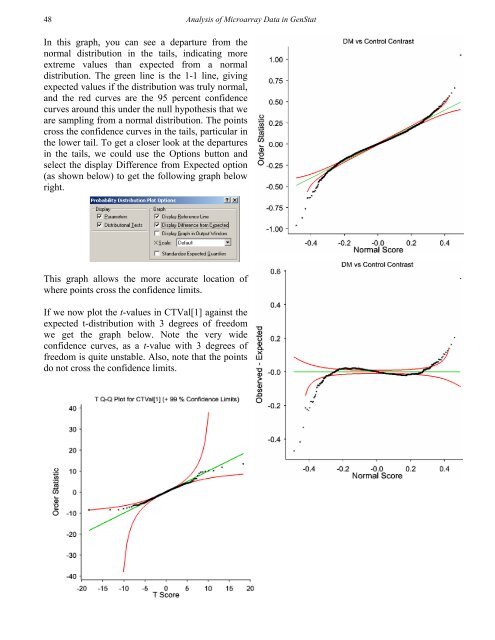
48<strong>Analysis</strong> <strong>of</strong> Microarray Data in GenStatIn this graph, you can see a departure from thenormal distribution in the tails, indicating moreextreme values than expected from a normaldistribution. The green line is the 1-1 line, givingexpected values if the distribution was truly normal,and the red curves are the 95 percent confidencecurves around this under the null hypothesis that weare sampling from a normal distribution. The pointscross the confidence curves in the tails, particular inthe lower tail. To get a closer look at the departuresin the tails, we could use the Options button andselect the display Difference from Expected option(as shown below) to get the following graph belowright.This graph allows the more accurate location <strong>of</strong>where points cross the confidence limits.If we now plot the t-values in CTVal[1] against theexpected t-distribution with 3 degrees <strong>of</strong> freedomwe get the graph below. Note the very wideconfidence curves, as a t-value with 3 degrees <strong>of</strong>freedom is quite unstable. Also, note that the pointsdo not cross the confidence limits.


