

Analysis of microarray data - VSN International
Analysis of microarray data - VSN International
Analysis of microarray data - VSN International
- No tags were found...

You also want an ePaper? Increase the reach of your titles
YUMPU automatically turns print PDFs into web optimized ePapers that Google loves.
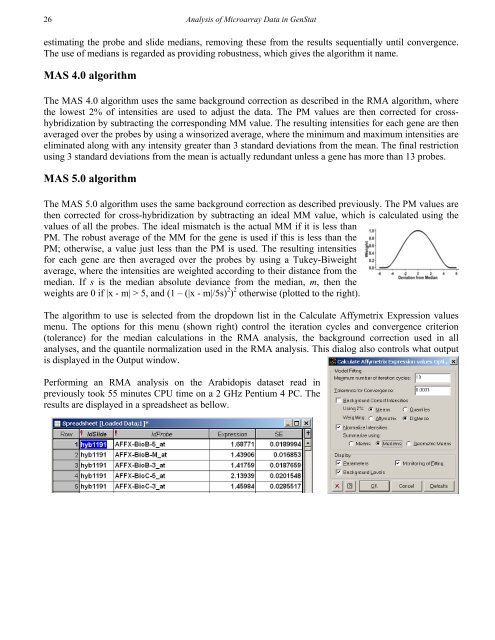
26<strong>Analysis</strong> <strong>of</strong> Microarray Data in GenStatestimating the probe and slide medians, removing these from the results sequentially until convergence.The use <strong>of</strong> medians is regarded as providing robustness, which gives the algorithm it name.MAS 4.0 algorithmThe MAS 4.0 algorithm uses the same background correction as described in the RMA algorithm, wherethe lowest 2% <strong>of</strong> intensities are used to adjust the <strong>data</strong>. The PM values are then corrected for crosshybridizationby subtracting the corresponding MM value. The resulting intensities for each gene are thenaveraged over the probes by using a winsorized average, where the minimum and maximum intensities areeliminated along with any intensity greater than 3 standard deviations from the mean. The final restrictionusing 3 standard deviations from the mean is actually redundant unless a gene has more than 13 probes.MAS 5.0 algorithmThe MAS 5.0 algorithm uses the same background correction as described previously. The PM values arethen corrected for cross-hybridization by subtracting an ideal MM value, which is calculated using thevalues <strong>of</strong> all the probes. The ideal mismatch is the actual MM if it is less thanPM. The robust average <strong>of</strong> the MM for the gene is used if this is less than thePM; otherwise, a value just less than the PM is used. The resulting intensitiesfor each gene are then averaged over the probes by using a Tukey-Biweightaverage, where the intensities are weighted according to their distance from themedian. If s is the median absolute deviance from the median, m, then theweights are 0 if |x - m| > 5, and (1 – (|x - m|/5s) 2 ) 2 otherwise (plotted to the right).The algorithm to use is selected from the dropdown list in the Calculate Affymetrix Expression valuesmenu. The options for this menu (shown right) control the iteration cycles and convergence criterion(tolerance) for the median calculations in the RMA analysis, the background correction used in allanalyses, and the quantile normalization used in the RMA analysis. This dialog also controls what outputis displayed in the Output window.Performing an RMA analysis on the Arabidopis <strong>data</strong>set read inpreviously took 55 minutes CPU time on a 2 GHz Pentium 4 PC. Theresults are displayed in a spreadsheet as bellow.


