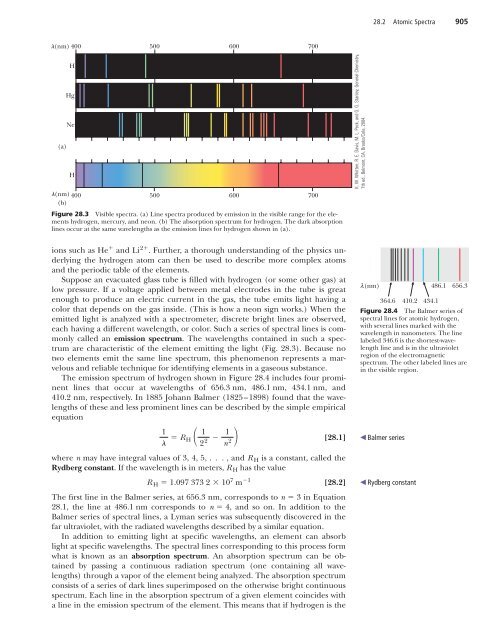
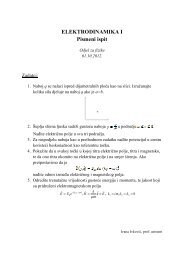
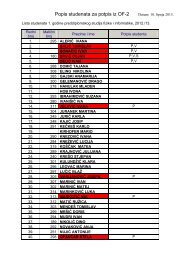
28.2 Atomic Spectra 905l(nm) 400 500 600 700(a)HHgNeHl(nm) 400 500 600 700(b)Figure 28.3 Visible spectra. (a) Line spectra produced by emission in the visible range for the elementshydrogen, mercury, and neon. (b) The absorption spectrum for hydrogen. The dark absorptionlines occur at the same wavelengths as the emission lines for hydrogen shown in (a).K. W. Whitten, R. E. Davis, M. L. Peck, and G. G. Stanley, General Chemistry,7th ed., Belmont, CA, Brooks/Cole, 2004.ions such as He and Li 2 . Further, a thorough understanding of the physics underlyingthe hydrogen atom can then be used to describe more complex atomsand the periodic table of the elements.Suppose an evacuated glass tube is filled with hydrogen (or some other gas) atlow pressure. If a voltage applied between metal electrodes in the tube is greatenough to produce an electric current in the gas, the tube emits light having acolor that depends on the gas inside. (This is how a neon sign works.) When theemitted light is analyzed with a spectrometer, discrete bright lines are observed,each having a different wavelength, or color. Such a series of spectral lines is commonlycalled an emission spectrum. The wavelengths contained in such a spectrumare characteristic of the element emitting the light (Fig. 28.3). Because notwo elements emit the same line spectrum, this phenomenon represents a marvelousand reliable technique for identifying elements in a gaseous substance.The emission spectrum of hydrogen shown in Figure 28.4 includes four prominentlines that occur at wavelengths of 656.3 nm, 486.1 nm, 434.1 nm, and410.2 nm, respectively. In 1885 Johann Balmer (1825–1898) found that the wavelengthsof these and less prominent lines can be described by the simple empiricalequation1 R H 1 [28.1]2 2 1 2 nwhere n may have integral values of 3, 4, 5, . . . , and R H is a constant, called theRydberg constant. If the wavelength is in meters, R H has the valueR H 1.097 373 2 10 7 m 1 [28.2]The first line in the Balmer series, at 656.3 nm, corresponds to n 3 in Equation28.1, the line at 486.1 nm corresponds to n 4, and so on. In addition to theBalmer series of spectral lines, a Lyman series was subsequently discovered in thefar ultraviolet, with the radiated wavelengths described by a similar equation.In addition to emitting light at specific wavelengths, an element can absorblight at specific wavelengths. The spectral lines corresponding to this process formwhat is known as an absorption spectrum. An absorption spectrum can be obtainedby passing a continuous radiation spectrum (one containing all wavelengths)through a vapor of the element being analyzed. The absorption spectrumconsists of a series of dark lines superimposed on the otherwise bright continuousspectrum. Each line in the absorption spectrum of a given element coincides witha line in the emission spectrum of the element. This means that if hydrogen is theλ(nm)364.6410.2 434.1486.1 656.3Figure 28.4 The Balmer series ofspectral lines for atomic hydrogen,with several lines marked with thewavelength in nanometers. The linelabeled 346.6 is the shortest-wavelengthline and is in the ultravioletregion of the electromagneticspectrum. The other labeled lines arein the visible region. Balmer series Rydberg constant
906 Chapter 28 Atomic <strong>Physics</strong>APPLICATIONDiscovery of Heliumabsorbing vapor, dark lines will appear at the visible wavelengths 656.3 nm,486.1 nm, 434.1 nm, and 410.2 nm, as shown in Figures 28.3b and 28.4.The absorption spectrum of an element has many practical applications. For example,the continuous spectrum of radiation emitted by the Sun must passthrough the cooler gases of the solar atmosphere before reaching the Earth. Thevarious absorption lines observed in the solar spectrum have been used to identifyelements in the solar atmosphere, including one that was previously unknown.When the solar spectrum was first being studied, some lines were found that didn’tcorrespond to any known element. A new element had been discovered! Becausethe Greek word for Sun is helios, the new element was named helium. It was lateridentified in underground gases on Earth. Scientists are able to examine the lightfrom stars other than our Sun in this way, but elements other than those presenton Earth have never been detected.Applying <strong>Physics</strong> 28.1Thermal or Spectral?On observing a yellow candle flame, your laboratorypartner claims that the light from the flame originatesfrom excited sodium atoms in the flame. You disagree,stating that because the candle flame is hot, the radiationmust be thermal in origin. Before the disagreementleads to fisticuffs, how could you determine whois correct?Explanation A simple determination could be madeby observing the light from the candle flame througha spectrometer, which is a slit and diffraction gratingcombination discussed in Chapter 25. If the spectrumof the light is continuous, then it’s probably thermalin origin. If the spectrum shows discrete lines, it’satomic in origin. The results of the experiment showthat the light is indeed thermal in origin and originatesfrom random molecular motion in the candleflame.Applying <strong>Physics</strong> 28.2AurorasAt extreme northern latitudes, the aurora borealisprovides a beautiful and colorful display in thenight sky. A similar display occurs near thesouthern polar region and is called the auroraaustralis. What’s the origin of the various colorsseen in the auroras?Explanation The aurora is due to high speed particlesinteracting with the Earth’s magnetic field andentering the atmosphere. When these particles collidewith molecules in the atmosphere, they excite themolecules in a way similar to the voltage in thespectrum tubes discussed earlier in this section. Inresponse, the molecules emit colors of light accordingto the characteristic spectrum of their atomicconstituents. For our atmosphere, the primaryconstituents are nitrogen and oxygen, which providethe red, blue, and green colors of the aurora.+ er– em eFigure 28.5 Diagram representingBohr’s model of the hydrogen atom.The orbiting electron is allowed onlyin specific orbits of discrete radii.Fv28.3 THE BOHR THEORY OF HYDROGENAt the beginning of the 20th century, scientists were perplexed by the failure ofclassical physics to explain the characteristics of spectra. Why did atoms of a givenelement emit only certain lines? Further, why did the atoms absorb only those wavelengthsthat they emitted? In 1913 Bohr provided an explanation of atomic spectrathat includes some features of the currently accepted theory. Using the simplestatom, hydrogen, Bohr developed a model of what he thought must be the atom’sstructure in an attempt to explain why the atom was stable. His model of the hydrogenatom contains some classical features, as well as some revolutionary postulatesthat could not be justified within the framework of classical physics. The basic assumptionsof the Bohr theory as it applies to the hydrogen atom are as follows:1. The electron moves in circular orbits about the proton under the influence ofthe Coulomb force of attraction, as in Figure 28.5. The Coulomb force producesthe electron’s centripetal acceleration.
- Page 1 and 2: Color-enhanced scanning electronmic
- Page 3: 876 Chapter 27 Quantum PhysicsSolve
- Page 6 and 7: 27.2 The Photoelectric Effect and t
- Page 8 and 9: 27.3 X-Rays 881even when black card
- Page 10 and 11: 27.4 Diffraction of X-Rays by Cryst
- Page 12 and 13: 27.5 The Compton Effect 885Exercise
- Page 14 and 15: 27.6 The Dual Nature of Light and M
- Page 16 and 17: 27.6 The Dual Nature of Light and M
- Page 18 and 19: 27.8 The Uncertainty Principle 891w
- Page 20 and 21: 27.8 The Uncertainty Principle 893E
- Page 22 and 23: 27.9 The Scanning Tunneling Microsc
- Page 24 and 25: Problems 897The probability per uni
- Page 26 and 27: Problems 89917. When light of wavel
- Page 28 and 29: Problems 90151.time of 5.00 ms. Fin
- Page 30 and 31: “Neon lights,” commonly used in
- Page 34 and 35: 28.3 The Bohr Theory of Hydrogen 90
- Page 36 and 37: 28.3 Th Bohr Theory of Hydrogen 909
- Page 38 and 39: 28.4 Modification of the Bohr Theor
- Page 40 and 41: 28.6 Quantum Mechanics and the Hydr
- Page 42 and 43: 28.7 The Spin Magnetic Quantum Numb
- Page 44 and 45: 28.9 The Exclusion Principle and th
- Page 46 and 47: 28.9 The Exclusion Principle and th
- Page 48 and 49: 28.11 Atomic Transitions 921electro
- Page 50 and 51: 28.12 Lasers and Holography 923is u
- Page 52 and 53: 28.13 Energy Bands in Solids 925Ene
- Page 54 and 55: 28.13 Energy Bands in Solids 927Ene
- Page 56 and 57: 28.14 Semiconductor Devices 929I (m
- Page 58 and 59: Summary 931(a)Figure 28.32 (a) Jack
- Page 60 and 61: Problems 9335. Is it possible for a
- Page 62 and 63: Problems 935tum number n. (e) Shoul
- Page 64 and 65: Problems 93748. A dimensionless num
- Page 66 and 67: Aerial view of a nuclear power plan
- Page 68 and 69: 29.1 Some Properties of Nuclei 941T
- Page 70 and 71: 29.2 Binding Energy 943130120110100
- Page 72 and 73: 29.3 Radioactivity 94529.3 RADIOACT
- Page 74 and 75: 29.3 Radioactivity 947INTERACTIVE E
- Page 76 and 77: 29.4 The Decay Processes 949Alpha D
- Page 78 and 79: 29.4 The Decay Processes 951Strateg
- Page 80 and 81: 29.4 The Decay Processes 953they we
- Page 82 and 83:
29.6 Nuclear Reactions 955wounds on
- Page 84 and 85:
29.6 Nuclear Reactions 957EXAMPLE 2
- Page 86 and 87:
29.7 Medical Applications of Radiat
- Page 88 and 89:
29.7 Medical Applications of Radiat
- Page 90 and 91:
29.8 Radiation Detectors 963Figure
- Page 92 and 93:
Summary 965Photo Researchers, Inc./
- Page 94 and 95:
Problems 967CONCEPTUAL QUESTIONS1.
- Page 96 and 97:
Problems 96924. A building has beco
- Page 98 and 99:
Problems 97157. A by-product of som
- Page 100 and 101:
This photo shows scientist MelissaD
- Page 102 and 103:
30.1 Nuclear Fission 975Applying Ph
- Page 104 and 105:
30.2 Nuclear Reactors 977Courtesy o
- Page 106 and 107:
30.2 Nuclear Reactors 979events in
- Page 108 and 109:
30.3 Nuclear Fusion 981followed by
- Page 110 and 111:
30.3 Nuclear Fusion 983VacuumCurren
- Page 112 and 113:
30.6 Positrons and Other Antipartic
- Page 114 and 115:
30.7 Mesons and the Beginning of Pa
- Page 116 and 117:
30.9 Conservation Laws 989LeptonsLe
- Page 118 and 119:
30.10 Strange Particles and Strange
- Page 120 and 121:
30.12 Quarks 993n pΣ _ Σ 0 Σ + S
- Page 122 and 123:
30.12 Quarks 995charm C 1, its anti
- Page 124 and 125:
30.14 Electroweak Theory and the St
- Page 126 and 127:
30.15 The Cosmic Connection 999prot
- Page 128 and 129:
30.16 Problems and Perspectives 100
- Page 130 and 131:
Problems 100330.12 Quarks &30.13 Co
- Page 132 and 133:
Problems 1005particles fuse to prod
- Page 134 and 135:
Problems 100740. Assume binding ene
- Page 136 and 137:
A.1 MATHEMATICAL NOTATIONMany mathe
- Page 138 and 139:
A.3 Algebra A.3by 8, we have8x8 32
- Page 140 and 141:
A.3 Algebra A.5EXERCISESSolve the f
- Page 142 and 143:
A.5 Trigonometry A.7When natural lo
- Page 144 and 145:
APPENDIX BAn Abbreviated Table of I
- Page 146 and 147:
An Abbreviated Table of Isotopes A.
- Page 148 and 149:
An Abbreviated Table of Isotopes A.
- Page 150 and 151:
Some Useful Tables A.15TABLE C.3The
- Page 152 and 153:
Answers to Quick Quizzes,Odd-Number
- Page 154 and 155:
Answers to Quick Quizzes, Odd-Numbe
- Page 156 and 157:
Answers to Quick Quizzes, Odd-Numbe
- Page 158 and 159:
Answers to Quick Quizzes, Odd-Numbe
- Page 160 and 161:
Answers to Quick Quizzes, Odd-Numbe
- Page 162 and 163:
Answers to Quick Quizzes, Odd-Numbe
- Page 164 and 165:
Answers to Quick Quizzes, Odd-Numbe
- Page 166 and 167:
Answers to Quick Quizzes, Odd-Numbe
- Page 168 and 169:
IndexPage numbers followed by “f
- Page 170 and 171:
Current, 568-573, 586direction of,
- Page 172 and 173:
Index I.5Fissionnuclear, 973-976, 9
- Page 174 and 175:
Index I.7Magnetic field(s) (Continu
- Page 176 and 177:
Polarizer, 805-806, 805f, 806-807Po
- Page 178 and 179:
South poleEarth’s geographic, 626
- Page 180 and 181:
CreditsPhotographsThis page constit
- Page 182 and 183:
PEDAGOGICAL USE OF COLORDisplacemen
- Page 184 and 185:
PHYSICAL CONSTANTSQuantity Symbol V