- Page 8 and 9: JSC IDGC Holding. Annual Report 201
- Page 10 and 11: Kirovsk
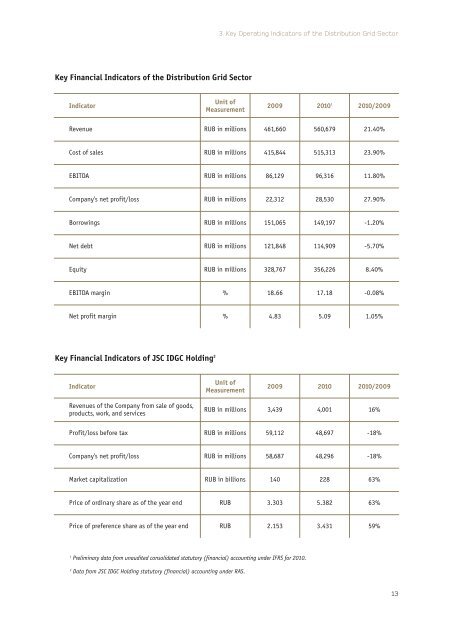
- Page 12 and 13: JSC IDGC Holding. Annual Report 201
- Page 16 and 17: JSC IDGC Holding. Annual Report 201
- Page 18 and 19: JSC IDGC Holding. Annual Report 201
- Page 20 and 21: Moscow
- Page 22 and 23: JSC IDGC Holding. Annual Report 201
- Page 24 and 25: JSC IDGC Holding. Annual Report 201
- Page 26 and 27: JSC IDGC Holding. Annual Report 201
- Page 28 and 29: Krasnodar Territory
- Page 30 and 31: JSC IDGC Holding. Annual Report 201
- Page 32 and 33: JSC IDGC Holding. Annual Report 201
- Page 34 and 35: JSC IDGC Holding. Annual Report 201
- Page 36 and 37: JSC IDGC Holding. Annual Report 201
- Page 38 and 39: JSC IDGC Holding. Annual Report 201
- Page 40 and 41: JSC IDGC Holding. Annual Report 201
- Page 42 and 43: Novorossiysk
- Page 44 and 45: JSC IDGC Holding. Annual Report 201
- Page 46 and 47: JSC IDGC Holding. Annual Report 201
- Page 48 and 49: JSC IDGC Holding. Annual Report 201
- Page 50 and 51: JSC IDGC Holding. Annual Report 201
- Page 52 and 53: JSC IDGC Holding. Annual Report 201
- Page 54 and 55: JSC IDGC Holding. Annual Report 201
- Page 56 and 57: JSC IDGC Holding. Annual Report 201
- Page 58 and 59: JSC IDGC Holding. Annual Report 201
- Page 60 and 61: JSC IDGC Holding. Annual Report 201
- Page 62 and 63: JSC IDGC Holding. Annual Report 201
- Page 64 and 65:
JSC IDGC Holding. Annual Report 201
- Page 66 and 67:
JSC IDGC Holding. Annual Report 201
- Page 68 and 69:
JSC IDGC Holding. Annual Report 201
- Page 70 and 71:
JSC IDGC Holding. Annual Report 201
- Page 72 and 73:
JSC IDGC Holding. Annual Report 201
- Page 74 and 75:
JSC IDGC Holding. Annual Report 201
- Page 76 and 77:
JSC IDGC Holding. Annual Report 201
- Page 78 and 79:
Veliky Novgorod
- Page 80 and 81:
JSC IDGC Holding. Annual Report 201
- Page 82 and 83:
JSC IDGC Holding. Annual Report 201
- Page 84 and 85:
JSC IDGC Holding. Annual Report 201
- Page 86 and 87:
JSC IDGC Holding. Annual Report 201
- Page 88 and 89:
JSC IDGC Holding. Annual Report 201
- Page 90 and 91:
Kaliningrad
- Page 92 and 93:
JSC IDGC Holding. Annual Report 201
- Page 94 and 95:
JSC IDGC Holding. Annual Report 201
- Page 96 and 97:
JSC IDGC Holding. Annual Report 201
- Page 98 and 99:
JSC IDGC Holding. Annual Report 201
- Page 100 and 101:
JSC IDGC Holding. Annual Report 201
- Page 102 and 103:
Izhevsk
- Page 104 and 105:
JSC IDGC Holding. Annual Report 201
- Page 106 and 107:
JSC IDGC Holding. Annual Report 201
- Page 108 and 109:
JSC IDGC Holding. Annual Report 201
- Page 110 and 111:
JSC IDGC Holding. Annual Report 201
- Page 112 and 113:
Ulyanovsk
- Page 114 and 115:
JSC IDGC Holding. Annual Report 201
- Page 116 and 117:
JSC IDGC Holding. Annual Report 201
- Page 118 and 119:
JSC IDGC Holding. Annual Report 201
- Page 120 and 121:
JSC IDGC Holding. Annual Report 201
- Page 122 and 123:
JSC IDGC Holding. Annual Report 201
- Page 124 and 125:
JSC IDGC Holding. Annual Report 201
- Page 126 and 127:
JSC IDGC Holding. Annual Report 201
- Page 128 and 129:
JSC IDGC Holding. Annual Report 201
- Page 130 and 131:
JSC IDGC Holding. Annual Report 201
- Page 132 and 133:
JSC IDGC Holding. Annual Report 201
- Page 134 and 135:
Kislovodsk
- Page 136 and 137:
JSC IDGC Holding. Annual Report 201
- Page 138 and 139:
JSC IDGC Holding. Annual Report 201
- Page 140 and 141:
JSC IDGC Holding. Annual Report 201
- Page 142 and 143:
JSC IDGC Holding. Annual Report 201
- Page 144 and 145:
JSC IDGC Holding. Annual Report 201
- Page 146 and 147:
JSC IDGC Holding. Annual Report 201
- Page 148 and 149:
JSC IDGC Holding. Annual Report 201
- Page 150 and 151:
JSC IDGC Holding. Annual Report 201
- Page 152 and 153:
JSC IDGC Holding. Annual Report 201
- Page 154 and 155:
JSC IDGC Holding. Annual Report 201
- Page 156 and 157:
Omsk
- Page 158 and 159:
JSC IDGC Holding. Annual Report 201
- Page 160 and 161:
JSC IDGC Holding. Annual Report 201
- Page 162 and 163:
JSC IDGC Holding. Annual Report 201
- Page 164 and 165:
Stavropol Territory
- Page 166 and 167:
JSC IDGC Holding. Annual Report 201
- Page 168 and 169:
JSC IDGC Holding. Annual Report 201
- Page 170 and 171:
JSC IDGC Holding. Annual Report 201
- Page 172 and 173:
JSC IDGC Holding. Annual Report 201
- Page 174 and 175:
Ekaterinburg
- Page 176 and 177:
JSC IDGC Holding. Annual Report 201
- Page 178 and 179:
JSC IDGC Holding. Annual Report 201
- Page 180 and 181:
JSC IDGC Holding. Annual Report 201
- Page 182 and 183:
JSC IDGC Holding. Annual Report 201
- Page 184 and 185:
JSC IDGC Holding. Annual Report 201
- Page 186 and 187:
JSC IDGC Holding. Annual Report 201
- Page 188 and 189:
JSC IDGC Holding. Annual Report 201
- Page 190 and 191:
JSC IDGC Holding. Annual Report 201
- Page 192 and 193:
Sochi
- Page 194 and 195:
JSC IDGC Holding. Annual Report 201
- Page 196 and 197:
JSC IDGC Holding. Annual Report 201
- Page 198 and 199:
Mezhdurechensk
- Page 200 and 201:
JSC IDGC Holding. Annual Report 201
- Page 202 and 203:
JSC IDGC Holding. Annual Report 201
- Page 204 and 205:
JSC IDGC Holding. Annual Report 201
- Page 206 and 207:
JSC IDGC Holding. Annual Report 201
- Page 208 and 209:
JSC IDGC Holding. Annual Report 201
- Page 210 and 211:
JSC IDGC Holding. Annual Report 201
- Page 212 and 213:
JSC IDGC Holding. Annual Report 201
- Page 214 and 215:
JSC IDGC Holding. Annual Report 201
- Page 216 and 217:
Rybinsk
- Page 218 and 219:
JSC IDGC Holding. Annual Report 201
- Page 220 and 221:
JSC IDGC Holding. Annual Report 201
- Page 222 and 223:
JSC IDGC Holding. Annual Report 201
- Page 224 and 225:
JSC IDGC Holding. Annual Report 201
- Page 226 and 227:
JSC IDGC Holding. Annual Report 201
- Page 228 and 229:
JSC IDGC Holding. Annual Report 201
- Page 230 and 231:
JSC IDGC Holding. Annual Report 201
- Page 232 and 233:
JSC IDGC Holding. Annual Report 201
- Page 234 and 235:
JSC IDGC Holding. Annual Report 201
- Page 236 and 237:
JSC IDGC Holding. Annual Report 201
- Page 238 and 239:
JSC IDGC Holding. Annual Report 201
- Page 240 and 241:
JSC IDGC Holding. Annual Report 201
- Page 242 and 243:
JSC IDGC Holding. Annual Report 201
- Page 244 and 245:
JSC IDGC Holding. Annual Report 201
- Page 246 and 247:
JSC IDGC Holding. Annual Report 201
- Page 248 and 249:
Date and place of birthNationalityJ
- Page 250 and 251:
Education, academic degree (if any)
- Page 252 and 253:
Date ofTaking OfficeinManagementBod
- Page 254 and 255:
2010 JSC IDGC Holding2010 JSC FGC U
- Page 256 and 257:
2010 JSC IDGC HoldingMember of the
- Page 258 and 259:
Moscow State Pedagogical University
- Page 260 and 261:
Period of Employment Entity Name an
- Page 262 and 263:
1. Experimental Nuclear Physics2. B
- Page 264 and 265:
Date ofTaking OfficeinManagementBod
- Page 266 and 267:
Positions held over the past 5 year
- Page 268 and 269:
Regulations for the Convening and H
- Page 270 and 271:
Regulations for Information Policy
- Page 272 and 273:
9 3.1 Chelyabinskoye Branchof Sberb
- Page 274 and 275:
36(39510) 4-00-764.24 Shelekhovskoy
- Page 276 and 277:
66 4.54 KrasnokamenskoyeBranch of S
- Page 278 and 279:
92 5.23 Krasnoyarskoye CityBranch o
- Page 280 and 281:
121 6.2 Tenkinskoye Branch ofSberba
- Page 282 and 283:
5053146 6.26 Megino-KangalasskoyeBr
- Page 284 and 285:
175 8.2 Tatarstan Bank Branch ofSbe
- Page 286 and 287:
201 10.18 Solikamskoye Branch4929/0
- Page 288 and 289:
227 10.43 Usinskoye Branch ofSberba
- Page 290 and 291:
257 11.18 Orlovskoye Branch ofSberb
- Page 292 and 293:
288 11.49 Ust-LabinskoyeBranch of S
- Page 294 and 295:
31731831912.9 Pavlovskoye Branch of
- Page 296 and 297:
341 12.33 ZemetchinskoyeBranch of S
- Page 298 and 299:
36712.59 Yenotaevskoye Branchof Sbe
- Page 300 and 301:
391 12.85 SengileevskoyeBranch of S
- Page 302 and 303:
415 13. Severo-Zapadny HeadOffice19
- Page 304 and 305:
436 14.15 Kurilskoye Branch ofSberb
- Page 306 and 307:
459 16.2 AleksandrovskoyeBranch of
- Page 308 and 309:
488 17.4 Zavodoukovskoye627140 Tyum
- Page 310 and 311:
22.9. Information Concerning Compli
- Page 312 and 313:
Company’s Board of Directors.6 No
- Page 314 and 315:
12 The articles of association of t
- Page 316 and 317:
18 Internal documents of the joint-
- Page 318 and 319:
26 The board of d irectors has es t
- Page 320 and 321:
of suc h c ompany’s boa rd of di
- Page 322 and 323:
45 Internal documents of the joint-
- Page 324 and 325:
of d irectors o f th e jo int-stock
- Page 326 and 327:
64 The board of directors has appro
- Page 328 and 329:
75 The audit committee evaluates th
- Page 330 and 331:
Amendments to Certain Legislative A
- Page 332 and 333:
May 26, 2010 12-2296 Concerning the
- Page 334 and 335:
July 19, 2010 5-3138 The instructio
- Page 336 and 337:
07/13909) concerning the implementa
- Page 338 and 339:
January 20, 2010 10-147 The instruc
- Page 340 and 341:
Government of the Russian Federatio
- Page 342 and 343:
separate divisionSeptember 7, 2010
- Page 344 and 345:
Russian Federation (Tsarikovsky, AT
- Page 346 and 347:
2production pl ant l ocated at : Re
- Page 348 and 349:
4in OAO IDGC of t he Urals Training
- Page 350 and 351:
6- as a member of t he Board of Dir
- Page 352 and 353:
8S. I. Shmatko, N. N. Shvets, G. F.
- Page 354 and 355:
28. Defining of the position of JSC
- Page 356 and 357:
46. Defining of the position of JSC
- Page 358 and 359:
6OAO Nurenergo as the SellerSubject
- Page 360 and 361:
M I N U T E Sof the Meeting of the
- Page 362 and 363:
3billion, nine hundred twenty-two m
- Page 364 and 365:
52.1.12. The c ost estimate i n rel
- Page 366 and 367:
75.2.1. Organize t he i mplementati
- Page 368 and 369:
9Any holder of the Bonds shall also
- Page 370 and 371:
11Payment for the placed Bonds shal
- Page 372 and 373:
13value and accrued coupon income r
- Page 374 and 375:
1511.2. Member of the Board of Dire
- Page 376 and 377:
22. Approval of annual accounting s
- Page 378 and 379:
3. AlexanderMikhailovichKuryanov4.
- Page 380 and 381:
27. Approval of proprietary informa
- Page 382 and 383:
4V. M. Kravchenko did not participa
- Page 384 and 385:
67. Approval of proprietary informa
- Page 386 and 387:
8Dispute resolution:Any dispute, co
- Page 388 and 389:
10to the expiration date, the agree
- Page 390 and 391:
12If either party causes any damage
- Page 392 and 393:
14upon the terms and conditions gov
- Page 394 and 395:
167.10. The proprietary information
- Page 396 and 397:
18Any amendments and supplements to
- Page 398 and 399:
20early termination or expiration o
- Page 400 and 401:
22The D isclosing Party pr ovides a
- Page 402 and 403:
24S. I. ShmatkoChairman of the Boar
- Page 404 and 405:
21.2. The t ime of t he a nnual Gen
- Page 406 and 407:
4Holding.1.15. It shall be specifie
- Page 408 and 409:
M I N U T E Sof the Meeting of the
- Page 410 and 411:
31.5. The estimate of costs relatin
- Page 412 and 413:
57.1. The Report of the Management
- Page 414 and 415:
M I N U T E Sof the Meeting of the
- Page 416 and 417:
3S. I. Shmatko, N . N. Shvets, G .
- Page 418 and 419:
25. Approval of t he A greement for
- Page 420 and 421:
43. Approval of the Agreement for t
- Page 422 and 423:
6IDGC Holding and OAO Karachayevo-C
- Page 424 and 425:
852:18:05 00 00 :0000:04898:V, whic
- Page 426 and 427:
10M. Yu. Kurbatov “Abstained.”O
- Page 428 and 429:
12S. I. ShmatkoChairman of the Boar
- Page 430 and 431:
2At t he s uggestion of m ember of
- Page 432 and 433:
43. THE FOLLOWING PERSON WAS HEARD:
- Page 434 and 435:
M I N U T E Sof the Meeting of the
- Page 436 and 437:
3IT WAS RESOLVED AS FOLLOWS:3.1. No
- Page 438 and 439:
M I N U T E Sof Meeting of the Boar
- Page 440 and 441:
3- Scientific a nd T echnical C oun
- Page 442 and 443:
5- OAO Kubanenergo (member of the B
- Page 444 and 445:
7• registered ordinary shares (st
- Page 446 and 447:
M I N U T E Sof the Meeting of the
- Page 448 and 449:
3S. I. Shmatko, N. N. Shvets, V. A.
- Page 450 and 451:
5Conditions f or t he Pl acement of
- Page 452 and 453:
75. Amendments to the decision adop
- Page 454 and 455:
98.2. The related party transaction
- Page 456 and 457:
2assets a nd construction-in-progre
- Page 458 and 459:
4- quantity of the sha res held by
- Page 460 and 461:
6kopecks;- book value of the stake
- Page 462 and 463:
84. Approval of t he A greement to
- Page 464 and 465:
10IT WAS RESOLVED AS FOLLOWS:7.1. N
- Page 466 and 467:
12Approved by a majority of votes.8
- Page 468 and 469:
M I N U T E Sof the Meeting of the
- Page 470 and 471:
3S. I. Shmatko, N. N. Shvets, S. R.
- Page 472 and 473:
22.7. Formation of t he Investment
- Page 474 and 475:
Approved unanimously.42.5. Review o
- Page 476 and 477:
6IT WAS RESOLVED AS FOLLOWS:The dec
- Page 478 and 479:
M I N U T E Sof the Meeting of the
- Page 480 and 481:
3- acquisition method: through bidd
- Page 482 and 483:
2Agenda1. Review of the consolidate
- Page 484 and 485:
4Review of the report on the implem
- Page 486 and 487:
M I N U T E Sof the Meeting of the
- Page 488 and 489:
3rubles in millionsPlan Actual Devi
- Page 490 and 491:
M I N U T E Sof the Meeting of the
- Page 492 and 493:
3S. V. Serebryannikov, V. V. Tatsiy
- Page 494 and 495:
5connection with mobilization train
- Page 496 and 497:
ubles7rubles1. Below 10,000,0002. 1
- Page 498 and 499:
911. Defining of the position of JS
- Page 500 and 501:
M I N U T E Sof the Meeting of the
- Page 502 and 503:
3S. I. Shmatko and V. V. KudryavyIT
- Page 504 and 505:
5S. I. Shmatko, N. N. Shvets, S. R.
- Page 506 and 507:
73.1. The pow ers o f Secretary of
- Page 508 and 509:
21.2. The agreement for contributin
- Page 510 and 511:
M I N U T E Sof the Meeting of the
- Page 512 and 513:
3Term of t he A greement: the A gre
- Page 514 and 515:
M I N U T E Sof the Meeting of the
- Page 516 and 517:
3associated with transferring title
- Page 518 and 519:
5Note sha ll be taken of i nformati
- Page 520 and 521:
Budget of theconstituent entity oft
- Page 522 and 523:
M I N U T E Sof the Meeting of the
- Page 524 and 525:
3Volga’s real property and acquir
- Page 526 and 527:
5United E lectric G rid C ompany, w
- Page 528 and 529:
77. Approval of the a greement fo r
- Page 530 and 531:
9hundred seventy-eight thousand, th
- Page 532 and 533:
JSC INTERREGIONAL DISTRIBUTIONGRID
- Page 534 and 535:
JSC INTERREGIONAL DISTRIBUTIONGRID
- Page 536 and 537:
JSC INTERREGIONAL DISTRIBUTIONGRID
- Page 538 and 539:
ased on t he fi rst p hase i mpleme
- Page 540 and 541:
JSC INTERREGIONAL DISTRIBUTIONGRID
- Page 542 and 543:
2.4. It s hall be recommended t o t
- Page 544 and 545:
It was resolved as follows:1.1. Not
- Page 546 and 547:
JSC INTERREGIONAL DISTRIBUTIONGRID
- Page 548 and 549:
JSC INTERREGIONAL DISTRIBUTIONGRID
- Page 550 and 551:
2.2. The Head of the Department for
- Page 552 and 553:
Seppo RemesChairman of the Audit Co
- Page 554 and 555:
Agenda1. THE FOLLOWING PERSON WAS H
- Page 556 and 557:
6. THE FOLLOWING PERSONS WERE HEARD
- Page 558 and 559:
INVESTMENT COMMITTEEOF THE BOARD OF
- Page 560 and 561:
2. Prior to December 22, 2010, the
- Page 562 and 563:
INVESTMENT COMMITTEEOF THE BOARD OF
- Page 564 and 565:
INVESTMENT COMMITTEEOF THE BOARD OF
- Page 566 and 567:
2. Note sha ll be t aken o f t he c
- Page 568 and 569:
Nomination and Remuneration Committ
- Page 570 and 571:
Schedule (Yearly)” (Appendix 2.2
- Page 572 and 573:
Nomination and Remuneration Committ
- Page 574 and 575:
JSC INTERREGIONAL DISTRIBUTIONGRID
- Page 576 and 577:
JSC INTERREGIONAL DISTRIBUTIONGRID
- Page 578 and 579:
Voting results:“FOR” - 11 perso
- Page 580 and 581:
two (2,019,892,442) 4 additional un
- Page 582 and 583:
Issue 5: Approval of the Decision o
- Page 584 and 585:
E. V. DodChairman of the Strategy C
- Page 586 and 587:
Issue 1: Determination of the posit
- Page 588 and 589:
JSC INTERREGIONAL DISTRIBUTIONGRID
- Page 590 and 591:
The va lue of the s ervices p rovid
- Page 592 and 593:
Pavel Vladilenovich Golubev - Head
- Page 594 and 595:
Voting results:“FOR” - 8 person
- Page 596 and 597:
JSC INTERREGIONAL DISTRIBUTIONGRID
- Page 598 and 599:
JSC INTERREGIONAL DISTRIBUTIONGRID
- Page 600 and 601:
1. R epresentatives of J SC ID GC H
- Page 602 and 603:
JSC INTERREGIONAL DISTRIBUTIONGRID
- Page 604 and 605:
Voting results:“FOR” - 11 perso
- Page 606 and 607:
Ballots attached.V. M. KravchenkoCh
- Page 608 and 609:
Due to that this is sue was referre
- Page 610 and 611:
M. Yu. Kurbatov, member of the Comm
- Page 612 and 613:
JSC INTERREGIONAL DISTRIBUTIONGRID
- Page 614 and 615:
VARIANT 2. Transfer of one or more
- Page 616 and 617:
JSC INTERREGIONAL DISTRIBUTIONGRID
- Page 618 and 619:
Voting results:“FOR” - 9 person
- Page 620 and 621:
Issue 1: Purchase of a dditional or
- Page 622 and 623:
It shall be recommended to the Boar
- Page 624 and 625:
JSC INTERREGIONAL DISTRIBUTIONGRID
- Page 626 and 627:
Subject matter of the Agreement:The
- Page 628 and 629:
VALUATION COMMITTEEof the Board of
- Page 630 and 631:
“ABSTAINED” - 2 votes (E. V. Pe
- Page 632 and 633:
VALUATION COMMITTEEof the Board of
- Page 634 and 635:
VALUATION COMMITTEEof the Board of
- Page 636 and 637:
VALUATION COMMITTEEof the Board of
- Page 638 and 639:
IT WAS NOTED AS FOLLOWS:1. Need to
- Page 640 and 641:
JSC IDGC Holding. Annual Report 201
- Page 642 and 643:
JSC IDGC Holding. Annual Report 201
- Page 644 and 645:
JSC IDGC Holding. Annual Report 201
- Page 646 and 647:
JSC IDGC Holding. Annual Report 201
- Page 648 and 649:
JSC IDGC Holding. Annual Report 201