Evaluation Sourcebook (.pdf) - School of Natural Resources and ...
Evaluation Sourcebook (.pdf) - School of Natural Resources and ...
Evaluation Sourcebook (.pdf) - School of Natural Resources and ...
- No tags were found...

Create successful ePaper yourself
Turn your PDF publications into a flip-book with our unique Google optimized e-Paper software.
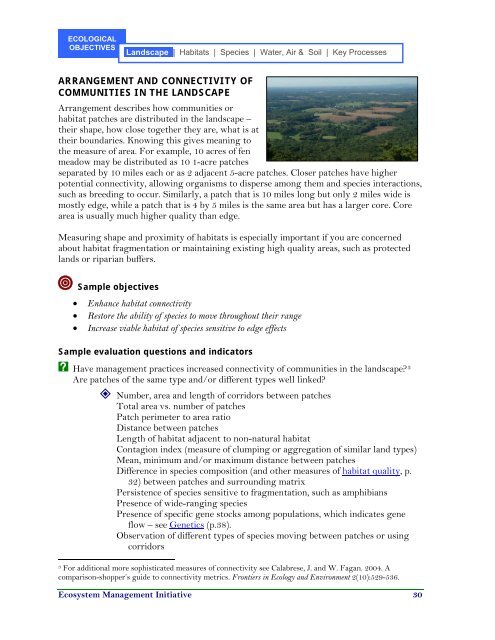
ECOLOGICALOBJECTIVESL<strong>and</strong>scape..| Habitats | Species | Water, Air & Soil | Key ProcessesARRANGEMENT AND CONNECTIVITY OFCOMMUNITIES IN THE LANDSCAPEArrangement describes how communities orhabitat patches are distributed in the l<strong>and</strong>scape –their shape, how close together they are, what is attheir boundaries. Knowing this gives meaning tothe measure <strong>of</strong> area. For example, 10 acres <strong>of</strong> fenmeadow may be distributed as 10 1-acre patchesseparated by 10 miles each or as 2 adjacent 5-acre patches. Closer patches have higherpotential connectivity, allowing organisms to disperse among them <strong>and</strong> species interactions,such as breeding to occur. Similarly, a patch that is 10 miles long but only 2 miles wide ismostly edge, while a patch that is 4 by 5 miles is the same area but has a larger core. Corearea is usually much higher quality than edge.Measuring shape <strong>and</strong> proximity <strong>of</strong> habitats is especially important if you are concernedabout habitat fragmentation or maintaining existing high quality areas, such as protectedl<strong>and</strong>s or riparian buffers.V Sample objectives• Enhance habitat connectivity• Restore the ability <strong>of</strong> species to move throughout their range• Increase viable habitat <strong>of</strong> species sensitive to edge effectsSample evaluation questions <strong>and</strong> indicatorsX Have management practices increased connectivity <strong>of</strong> communities in the l<strong>and</strong>scape? 3Are patches <strong>of</strong> the same type <strong>and</strong>/or different types well linked? Number, area <strong>and</strong> length <strong>of</strong> corridors between patchesTotal area vs. number <strong>of</strong> patchesPatch perimeter to area ratioDistance between patchesLength <strong>of</strong> habitat adjacent to non-natural habitatContagion index (measure <strong>of</strong> clumping or aggregation <strong>of</strong> similar l<strong>and</strong> types)Mean, minimum <strong>and</strong>/or maximum distance between patchesDifference in species composition (<strong>and</strong> other measures <strong>of</strong> habitat quality, p.32) between patches <strong>and</strong> surrounding matrixPersistence <strong>of</strong> species sensitive to fragmentation, such as amphibiansPresence <strong>of</strong> wide-ranging speciesPresence <strong>of</strong> specific gene stocks among populations, which indicates geneflow – see Genetics (p.38).Observation <strong>of</strong> different types <strong>of</strong> species moving between patches or usingcorridors3 For additional more sophisticated measures <strong>of</strong> connectivity see Calabrese, J. <strong>and</strong> W. Fagan. 2004. Acomparison-shopper’s guide to connectivity metrics. Frontiers in Ecology <strong>and</strong> Environment 2(10):529-536.Ecosystem Management Initiative 30