- Page 1 and 2:
Value through InnovationCorporate M
- Page 3 and 4:
our businesses66 [ prescription med
- Page 7:
value through innovationperspective
- Page 10 and 11:
56° 40' 59" N, 5° 6' 14" Wglencoe
- Page 12 and 13:
56° 40' 59" N, 5° 6' 14" Wglencoe
- Page 14 and 15:
PERSPECTIVES FORSOCIETYIn all our a
- Page 16 and 17:
50 NATIONSPeople from around 50 nat
- Page 18 and 19:
“RLDP journey: a great learning o
- Page 20 and 21:
SHONA MCDONALD, SHONAQUIP[ south af
- Page 22 and 23:
SEHNAZ LAYIKEL, RUSIHAK[ turkey ]he
- Page 24 and 25:
Thalita Guimaraes joins the “Boeh
- Page 26 and 27:
When handling chemicals, employees
- Page 28 and 29:
11 With its own wastewater treatmen
- Page 30 and 31:
21 Dr Carolyn R. Bertozzi received
- Page 32 and 33:
PERSPECTIVES FOR THE SOCIETYOF TOMO
- Page 34 and 35:
The opening ceremony of IMB:Interac
- Page 36 and 37:
CIRCUIT MECHANICS OF EMOTIONSUnders
- Page 38 and 39:
BIBERACH UNIVERSITY OF APPLIEDSCIEN
- Page 40 and 41:
22° 41' 0" S, 14° 32' 0" Eswakopm
- Page 42 and 43:
22° 41' 0" S, 14° 32' 0" Eswakopm
- Page 44 and 45:
PERSPECTIVES FORMEDICAL INNOVATIONB
- Page 46 and 47:
RESEARCH PARTNERSHIPS WITHACADEMIA
- Page 48 and 49:
collaborate innovate accelerateTRAN
- Page 50 and 51:
GLORIA-AF®Registry programme for p
- Page 52 and 53:
BOEHRINGER INGELHEIM ONCOLOGY FRANC
- Page 54 and 55:
AFATINIB BLOCKS THE ERBB RECEPTORSE
- Page 56 and 57:
HEPTATIS C VIRUS (HCV) INFECTIONHCV
- Page 58 and 59:
1viral entryrnareleasernatranslated
- Page 60 and 61:
12THE MAIN COMPLICATIONS OF DIABETE
- Page 62 and 63:
ASTHMAAsthma is a chronic disease c
- Page 64 and 65:
THERAPEUTIC AREA (TA) REVIEW CORE T
- Page 66 and 67:
6° 59' 15" N, 125° 16' 15" Eapo,
- Page 68 and 69:
icardo f. solitariadistrict manager
- Page 70 and 71:
PERSPECTIVES FORBETTER HEALTHBoehri
- Page 72 and 73:
“My photo shows Frau Röhrigfrom
- Page 74 and 75:
OUR CARDIOVASCULAR PORTFOLIOaggreno
- Page 76 and 77:
HOW ATRIAL FIBRILLATION (AF)LEADS T
- Page 78 and 79:
FINDING THE RIGHT MOLECULE“Findin
- Page 80 and 81:
PATIENTS AT CARDIOVASCULAR RISKMost
- Page 82 and 83:
TRAJENTA® / TRADJENTA®trajenta®
- Page 84 and 85:
WORLD DIABETES DAYWorld Diabetes Da
- Page 86 and 87:
SPIRIVA®: 10 YEARS AND MORE OF CLI
- Page 88 and 89:
BEHAVIOUR CHANGE INTYPE 2 DIABETEST
- Page 90 and 91:
Rapid progress in global healthcare
- Page 92 and 93:
KEY GOALS OF GLOBAL BUSINESS SERVIC
- Page 94 and 95:
“The perspectives that open upune
- Page 96 and 97:
OUR GLOBAL SWITCH TEAMThe Switch un
- Page 98 and 99:
“For me, the photo shows thatthe
- Page 100 and 101:
2 Disposable single use bioreactorw
- Page 102 and 103:
“The hard-working beessuccessfull
- Page 104 and 105:
“There are many things and experi
- Page 106 and 107:
OUR GLOBAL SCIENTIFIC NET WORKIN AN
- Page 108 and 109:
2 31 Scientists in Hannover working
- Page 110 and 111:
“Living and working on a differen
- Page 112 and 113:
1 Phoenix, the first captive-bredOr
- Page 114 and 115:
55° 21' 0" N, 131° 40' 24" Wketch
- Page 116 and 117:
scott zhangstrategic effectiveness
- Page 118 and 119:
PERSPECTIVES FORQUALITY IN OPERATIO
- Page 120 and 121:
With the quality risk management sy
- Page 122 and 123:
In order to ensure patient safety,
- Page 124 and 125:
37° 34' 48" N, 14° 16' 34" Esicil
- Page 126 and 127:
37° 34' 48" N, 14° 16' 34" Esicil
- Page 128 and 129:
PERSPECTIVES FORESTABLISHED MARKETS
- Page 130 and 131:
Spain is one of the countries struc
- Page 132 and 133:
21 View of Athens.2 Production site
- Page 134 and 135:
1 View of San Francisco, the leadin
- Page 136 and 137:
211 View of Tokyo with Japan’s hi
- Page 138 and 139:
IF YOU HAVE ANY QUERIES OR COMMENTS
- Page 140 and 141:
Value through InnovationBusiness Ye
- Page 142 and 143:
product portfolio70 [ branded presc
- Page 144 and 145:
usiness year 2012our companyOUR COM
- Page 146 and 147:
usiness year 2012the shareholders
- Page 148 and 149:
usiness year 2012the shareholders
- Page 150 and 151:
usiness year 2012 key aspects 2012S
- Page 152 and 153:
usiness year 2012 key aspects 2012F
- Page 154 and 155:
usiness year 2012 key aspects 2012B
- Page 156 and 157:
usiness year 2012corporate bodiesCO
- Page 158 and 159:
usiness year 2012group management r
- Page 160 and 161:
usiness year 2012group management r
- Page 162 and 163:
usiness year 2012group management r
- Page 164 and 165:
usiness year 2012group management r
- Page 166 and 167:
usiness year 2012group management r
- Page 168 and 169:
usiness year 2012group management r
- Page 170 and 171:
usiness year 2012group management r
- Page 172 and 173:
usiness year 2012group management r
- Page 174 and 175:
usiness year 2012group management r
- Page 176 and 177:
usiness year 2012group management r
- Page 178 and 179:
usiness year 2012consolidated finan
- Page 180 and 181:
usiness year 2012consolidated finan
- Page 182 and 183:
usiness year 2012consolidated finan
- Page 184 and 185: usiness year 2012consolidated finan
- Page 186 and 187: usiness year 2012consolidated finan
- Page 188 and 189: usiness year 2012consolidated finan
- Page 190 and 191: usiness year 2012consolidated finan
- Page 192 and 193: usiness year 2012consolidated finan
- Page 194 and 195: usiness year 2012consolidated finan
- Page 196 and 197: usiness year 2012consolidated finan
- Page 198 and 199: usiness year 2012consolidated finan
- Page 200 and 201: usiness year 2012consolidated finan
- Page 202 and 203: usiness year 2012consolidated finan
- Page 204 and 205: usiness year 2012consolidated finan
- Page 206 and 207: usiness year 2012auditor’s report
- Page 208 and 209: product portfolioa selection2012PRO
- Page 210 and 211: product portfoliobranded prescripti
- Page 212 and 213: product portfoliobranded prescripti
- Page 214 and 215: product portfoliobranded prescripti
- Page 216 and 217: product portfoliobranded prescripti
- Page 218 and 219: product portfoliobranded prescripti
- Page 220 and 221: product portfolioconsumer health ca
- Page 222 and 223: product portfolioconsumer health ca
- Page 224 and 225: product portfolioconsumer health ca
- Page 226 and 227: product portfolioconsumer health ca
- Page 228 and 229: product portfolioanimal healthIndic
- Page 230 and 231: product portfolioanimal healthIndic
- Page 232 and 233: product portfolioanimal healthIndic
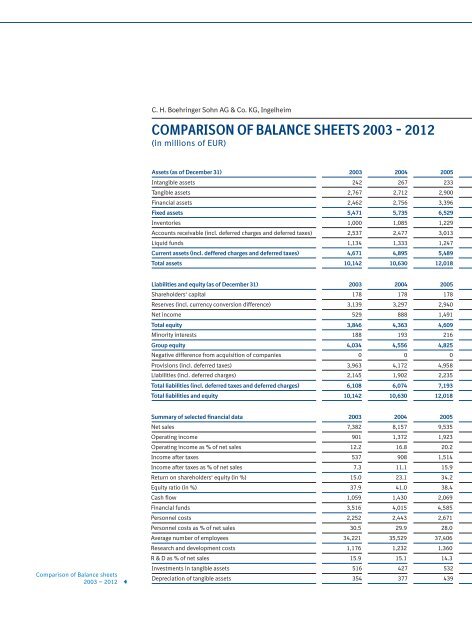
- Page 236 and 237: usiness year 2012financial data2006
- Page 238: www.boehringer-ingelheim.comannualr