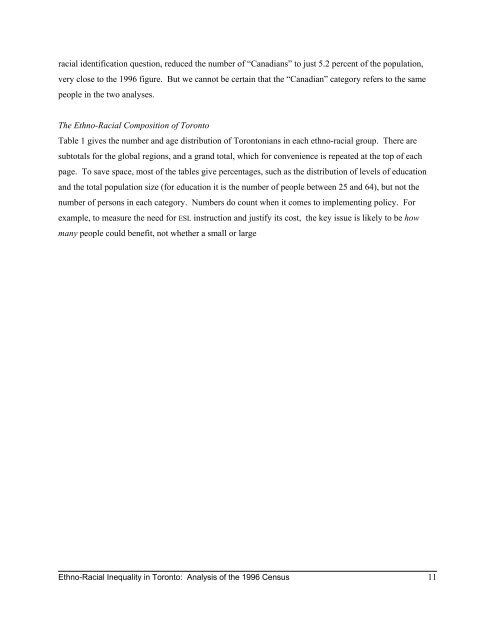
acial identification question, reduced <strong>the</strong> number <strong>of</strong> “Canadians” to just 5.2 percent <strong>of</strong> <strong>the</strong> population,very close to <strong>the</strong> 1996 figure. But we cannot be certa<strong>in</strong> that <strong>the</strong> “Canadian” category refers to <strong>the</strong> samepeople <strong>in</strong> <strong>the</strong> two analyses.The <strong>Ethno</strong>-<strong>Racial</strong> Composition <strong>of</strong> <strong>Toronto</strong>Table 1 gives <strong>the</strong> number and age distribution <strong>of</strong> <strong>Toronto</strong>nians <strong>in</strong> each ethno-racial group. There aresubtotals for <strong>the</strong> global regions, and a grand total, which for convenience is repeated at <strong>the</strong> top <strong>of</strong> eachpage. To save space, most <strong>of</strong> <strong>the</strong> tables give percentages, such as <strong>the</strong> distribution <strong>of</strong> levels <strong>of</strong> educationand <strong>the</strong> total population size (for education it is <strong>the</strong> number <strong>of</strong> people between 25 and 64), but not <strong>the</strong>number <strong>of</strong> persons <strong>in</strong> each category. Numbers do count when it comes to implement<strong>in</strong>g policy. Forexample, to measure <strong>the</strong> need for ESL <strong>in</strong>struction and justify its cost, <strong>the</strong> key issue is likely to be howmany people could benefit, not whe<strong>the</strong>r a small or large<strong>Ethno</strong>-<strong>Racial</strong> <strong>Inequality</strong> <strong>in</strong> <strong>Toronto</strong>: <strong>An</strong>alysis <strong>of</strong> <strong>the</strong> 1996 Census 11
Table 1<strong>Toronto</strong>, by Size and AgeAge(percentage distribution)Total Populationunder 75 or<strong>Ethno</strong>-<strong>Racial</strong> Group Number Percent 15 15-24 25-44 45-64 65-74 older TotalTotal 2,363,870 100.0 18.0 12.5 35.3 21.4 8.0 4.8 100.0Total: Aborig<strong>in</strong>al 21,670 0.9 25.2 15.1 41.4 15.6 1.7 0.9 100.0Aborig<strong>in</strong>al 3,850 0.2 18.4 12.5 42.2 22.5 2.7 1.7 100.0Aborig<strong>in</strong>al and British/French 6,990 0.3 18.7 14.7 46.1 17.9 1.7 0.9 100.0Aborig<strong>in</strong>al and non-British/French 10,830 0.5 31.9 16.3 38.1 11.8 1.4 0.6 100.0Total: African, Black and Caribbean 226,525 9.6 29.1 15.5 35.9 15.3 2.9 1.3 100.0Ethiopian 7,005 0.3 22.3 12.2 61.0 3.9 0.4 0.4 100.0Ghanaian 15,465 0.7 42.8 16.0 34.1 4.6 1.9 0.6 100.0Somali 7,200 0.3 34.9 10.1 47.8 6.9 0.3 0.0 100.0O<strong>the</strong>r African Nations 16,910 0.7 26.3 13.5 46.6 11.3 1.8 0.6 100.0African and South/East Asian 2,710 0.1 32.5 16.8 29.5 17.7 2.0 1.3 100.0African and European/Arab/West Asian 4,320 0.2 30.4 17.2 35.5 13.1 1.9 1.7 100.0African and Black 17,430 0.7 44.1 15.9 25.2 11.2 2.4 1.2 100.0Barbadian 3,785 0.2 10.4 10.7 37.1 32.9 6.9 2.0 100.0Guyanese 13,110 0.6 20.3 14.3 37.3 19.5 5.9 2.8 100.0Jamaican 70,350 3.0 26.8 16.3 33.7 18.3 3.4 1.5 100.0Tr<strong>in</strong>idadian and Tobagonian 10,450 0.4 19.4 18.7 36.3 21.6 2.3 1.7 100.0West Indian 15,720 0.7 22.8 14.9 37.5 20.0 3.3 1.5 100.0O<strong>the</strong>r Caribbean nations 8,460 0.4 18.9 16.1 42.1 18.6 3.3 0.9 100.0Multiple Caribbean 5,340 0.2 47.8 19.3 20.8 10.6 0.8 0.8 100.0Caribbean and South Asian 9,265 0.4 25.9 16.2 37.2 16.2 3.6 0.8 100.0Caribbean and East Asian 3,420 0.1 34.2 15.6 32.3 13.7 2.0 1.9 100.0Caribbean & European/Arab/Lat<strong>in</strong> American 15,585 0.7 36.7 15.2 30.8 12.8 2.5 1.9 100.0Total: South Asian 197,960 8.4 25.3 14.2 37.5 17.5 4.1 1.3 100.0Indian 127,890 5.4 23.8 14.3 36.4 19.4 4.5 1.6 100.0Pakistani and Bangladeshi 10,280 0.4 30.0 15.8 40.0 11.7 2.1 0.4 100.0Sri Lankan 20,395 0.9 27.3 12.3 42.9 13.8 3.2 0.5 100.0Tamil 13,500 0.6 27.8 11.8 42.7 13.9 3.1 0.8 100.0Multiple South Asian 15,130 0.6 24.9 14.9 38.4 16.5 4.5 0.9 100.0South Asian and East Asian 2,050 0.1 40.2 18.0 25.9 11.0 3.7 1.0 100.0South Asian and European/Arab/West Asian 8,715 0.4 29.9 17.0 31.9 15.3 4.6 1.4 100.0Source: Statistics Canada 1996 Census; Tabulation by Michael Ornste<strong>in</strong>, Institute for Social Research, York University<strong>Ethno</strong>-<strong>Racial</strong> <strong>Inequality</strong> <strong>in</strong> <strong>Toronto</strong>: <strong>An</strong>alysis <strong>of</strong> <strong>the</strong> 1996 Census 12
- Page 6 and 7: origin, South Asians, Arab and West
- Page 8 and 9: Table of ContentsExecutive Summary.
- Page 10 and 11: IntroductionThis Report provides de
- Page 12 and 13: Methodological NotesThis Report pro
- Page 14 and 15: Chapter 1Defining Ethno-Racial Grou
- Page 16 and 17: question, described above. The “C
- Page 18 and 19: “Barbadians.” Likewise, people
- Page 22 and 23: Table 1, continuedEthno-Racial Grou
- Page 24 and 25: percentage of a group has the need.
- Page 26 and 27: ARAB AND WEST ASIAN ORIGINSApproxim
- Page 28 and 29: EUROPEAN ORIGIN GROUPS TEND TO BE O
- Page 30 and 31: The key question involves the numbe
- Page 32 and 33: Table 2, continuedPercentage and Nu
- Page 34 and 35: A second policy concern involves th
- Page 36 and 37: NON-NATIONAL, “RACIAL” AND MULT
- Page 38 and 39: Table 3, continuedKnowledge of Engl
- Page 40 and 41: majority of people speak English. T
- Page 42 and 43: Fully 96.1 percent of Torontonians
- Page 44 and 45: Chapter 2EducationIf educational cr
- Page 46 and 47: Table 4, continuedHighest Level of
- Page 48 and 49: Ethno-Racial Inequality in Toronto:
- Page 50 and 51: Educational Attainment of AdultsAbo
- Page 52 and 53: EUROPEAN ORIGINAmong Europeans, edu
- Page 54 and 55: GROUPS WITH HIGHER PROPORTIONS OF N
- Page 56 and 57: Table 5, continuedSchool Attendance
- Page 58 and 59: Ethno-Racial Inequality in Toronto:
- Page 60 and 61: Of most concern are the small numbe
- Page 62 and 63: Not counted as unemployed are “di
- Page 64 and 65: Table 6, continuedLabour Force Char
- Page 66 and 67: Ethno-Racial Inequality in Toronto:
- Page 68 and 69: percent for the African, Black and
- Page 70 and 71:
LATIN AMERICAN ORIGINSThe two Latin
- Page 72 and 73:
Table 7, continuedIncome from Emplo
- Page 74 and 75:
efore coming to Canada likely refle
- Page 76 and 77:
Table 8a, continuedOccupations of W
- Page 78 and 79:
Table 8bOccupations of Men by Ethno
- Page 80 and 81:
Table 8b, continuedOccupations of M
- Page 82 and 83:
Ethno-Racial Inequality in Toronto:
- Page 84 and 85:
eing an employee; just 3.2 percent
- Page 86 and 87:
Table 9, continuedIncidence of Self
- Page 88 and 89:
AFRICAN, BLACK AND CARIBBEAN ORIGIN
- Page 90 and 91:
esult in similar levels of income.
- Page 92 and 93:
Among the individual ethno-racial g
- Page 94 and 95:
Chapter 4Poverty and Individual and
- Page 96 and 97:
Introduction to the TablesThe first
- Page 98 and 99:
Table 10, continuedIncidence of Pov
- Page 100 and 101:
Ethno-Racial Inequality in Toronto:
- Page 102 and 103:
Table 11, continuedIncidence of Chi
- Page 104 and 105:
Ethno-Racial Inequality in Toronto:
- Page 106 and 107:
types of families are not an intuit
- Page 108 and 109:
children and 12.8 percent of Arab/W
- Page 110 and 111:
Table 12, continuedIncidence of Pov
- Page 112 and 113:
Southeast Asians and Pacific Island
- Page 114 and 115:
Table 13, continuedMedian Family In
- Page 116 and 117:
Ethno-Racial Inequality in Toronto:
- Page 118 and 119:
Table 14, continuedMedian Individua
- Page 120 and 121:
Ethno-Racial Inequality in Toronto:
- Page 122 and 123:
SOUTH ASIAN ORIGINSWhile just over
- Page 124 and 125:
LATIN AMERICAN ORIGINSDue to statis
- Page 126 and 127:
There are remarkable ethno-racial d
- Page 128 and 129:
Table 15, continuedHome Ownership o
- Page 130 and 131:
percent of Italian families own the
- Page 132 and 133:
The most severe disadvantage affect
- Page 134 and 135:
Men in Lower SkillJobs(Table 8b/Cha
- Page 136 and 137:
which included all other African na
- Page 138 and 139:
In Lower Skill Non-Manual Occupatio
- Page 140 and 141:
skilled non-manual occupations in 1
- Page 142:
segregation, the effects of unequal