Environmental Scan - Government of Nova Scotia
Environmental Scan - Government of Nova Scotia
Environmental Scan - Government of Nova Scotia
Create successful ePaper yourself
Turn your PDF publications into a flip-book with our unique Google optimized e-Paper software.
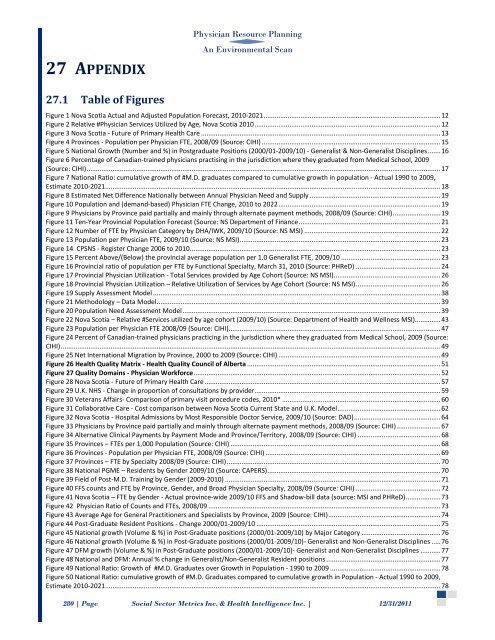
27 APPENDIXPhysician Resource PlanningAn <strong>Environmental</strong> <strong>Scan</strong>27.1 Table <strong>of</strong> FiguresFigure 1 <strong>Nova</strong> <strong>Scotia</strong> Actual and Adjusted Population Forecast, 2010-2021 ................................................................................................ 12Figure 2 Relative #Physician Services Utilized by Age, <strong>Nova</strong> <strong>Scotia</strong> 2010 ..................................................................................................... 12Figure 3 <strong>Nova</strong> <strong>Scotia</strong> - Future <strong>of</strong> Primary Health Care .................................................................................................................................. 13Figure 4 Provinces - Population per Physician FTE, 2008/09 (Source: CIHI) ................................................................................................. 15Figure 5 National Growth (Number and %) in Postgraduate Positions (2000/01-2009/10) - Generalist & Non-Generalist Disciplines ....... 16Figure 6 Percentage <strong>of</strong> Canadian-trained physicians practising in the jurisdiction where they graduated from Medical School, 2009(Source: CIHI) ................................................................................................................................................................................................ 17Figure 7 National Ratio: cumulative growth <strong>of</strong> #M.D. graduates compared to cumulative growth in population - Actual 1990 to 2009,Estimate 2010-2021...................................................................................................................................................................................... 18Figure 8 Estimated Net Difference Nationally between Annual Physician Need and Supply ....................................................................... 19Figure 10 Population and (demand-based) Physician FTE Change, 2010 to 2022 ........................................................................................ 19Figure 9 Physicians by Province paid partially and mainly through alternate payment methods, 2008/09 (Source: CIHI) .......................... 19Figure 11 Ten-Year Provincial Population Forecast (Source: NS Department <strong>of</strong> Finance ............................................................................. 21Figure 12 Number <strong>of</strong> FTE by Physician Category by DHA/IWK, 2009/10 (Source: NS MSI) .......................................................................... 22Figure 13 Population per Physician FTE, 2009/10 (Source: NS MSI) ............................................................................................................. 23Figure 14 CPSNS - Register Change 2006 to 2010 ........................................................................................................................................ 23Figure 15 Percent Above/(Below) the provincial average population per 1.0 Generalist FTE, 2009/10 ...................................................... 23Figure 16 Provincial ratio <strong>of</strong> population per FTE by Functional Specialty, March 31, 2010 (Source: PHReD) .............................................. 24Figure 17 Provincial Physician Utilization - Total Services provided by Age Cohort (Source: NS MSI) .......................................................... 26Figure 18 Provincial Physician Utilization – Relative Utilization <strong>of</strong> Services by Age Cohort (Source: NS MSI) .............................................. 26Figure 19 Supply Assessment Model ............................................................................................................................................................ 38Figure 21 Methodology – Data Model .......................................................................................................................................................... 39Figure 20 Population Need Assessment Model ............................................................................................................................................ 39Figure 22 <strong>Nova</strong> <strong>Scotia</strong> – Relative #Services utilized by age cohort (2009/10) (Source: Department <strong>of</strong> Health and Wellness MSI).............. 43Figure 23 Population per Physician FTE 2008/09 (Source: CIHI) ................................................................................................................... 47Figure 24 Percent <strong>of</strong> Canadian-trained physicians practicing in the jurisdiction where they graduated from Medical School, 2009 (Source:CIHI) .............................................................................................................................................................................................................. 49Figure 25 Net International Migration by Province, 2000 to 2009 (Source: CIHI) ........................................................................................ 49Figure 26 Health Quality Matrix - Health Quality Council <strong>of</strong> Alberta ......................................................................................................... 51Figure 27 Quality Domains - Physician Workforce ...................................................................................................................................... 52Figure 28 <strong>Nova</strong> <strong>Scotia</strong> - Future <strong>of</strong> Primary Health Care ................................................................................................................................ 57Figure 29 U.K. NHS - Change in proportion <strong>of</strong> consultations by provider ..................................................................................................... 59Figure 30 Veterans Affairs- Comparison <strong>of</strong> primary visit procedure codes, 2010* ...................................................................................... 60Figure 31 Collaborative Care - Cost comparison between <strong>Nova</strong> <strong>Scotia</strong> Current State and U.K. Model ........................................................ 62Figure 32 <strong>Nova</strong> <strong>Scotia</strong> - Hospital Admissions by Most Responsible Doctor Service, 2009/10 (Source: DAD) ............................................... 64Figure 33 Physicians by Province paid partially and mainly through alternate payment methods, 2008/09 (Source: CIHI) ........................ 67Figure 34 Alternative Clinical Payments by Payment Mode and Province/Territory, 2008/09 (Source: CIHI) ............................................. 68Figure 35 Provinces – FTEs per 1,000 Population (Source: CIHI) .................................................................................................................. 68Figure 36 Provinces - Population per Physician FTE, 2008/09 (Source: CIHI) ............................................................................................... 69Figure 37 Provinces – FTE by Specialty 2008/09 (Source: CIHI) .................................................................................................................... 70Figure 38 National PGME – Residents by Gender 2009/10 (Source: CAPERS) .............................................................................................. 70Figure 39 Field <strong>of</strong> Post-M.D. Training by Gender (2009-2010) ..................................................................................................................... 71Figure 40 FFS counts and FTE by Province, Gender, and Broad Physician Specialty, 2008/09 (Source: CIHI) .............................................. 72Figure 41 <strong>Nova</strong> <strong>Scotia</strong> – FTE by Gender - Actual province-wide 2009/10 FFS and Shadow-bill data (source: MSI and PHReD) ................... 73Figure 42 Physician Ratio <strong>of</strong> Counts and FTEs, 2008/09 .............................................................................................................................. 73Figure 43 Average Age for General Practitioners and Specialists by Province, 2009 (Source: CIHI) ............................................................. 74Figure 44 Post-Graduate Resident Positions - Change 2000/01-2009/10 .................................................................................................... 75Figure 45 National growth (Volume & %) in Post-Graduate positions (2000/01-2009/10) by Major Category ........................................... 76Figure 46 National growth (Volume & %) in Post-Graduate positions (2000/01-2009/10)- Generalist and Non-Generalist Disciplines ..... 76Figure 47 DFM growth (Volume & %) in Post-Graduate positions (2000/01-2009/10)- Generalist and Non-Generalist Disciplines ........... 77Figure 48 National and DFM: Annual % change in Generalist/Non-Generalist Resident positions .............................................................. 77Figure 49 National Ratio: Growth <strong>of</strong> #M.D. Graduates over Growth in Population - 1990 to 2009 ............................................................ 78Figure 50 National Ratio: cumulative growth <strong>of</strong> #M.D. Graduates compared to cumulative growth in Population - Actual 1990 to 2009,Estimate 2010-2021...................................................................................................................................................................................... 78280 | Page Social Sector Metrics Inc. & Health Intelligence Inc. | 12/31/2011


