- Page 1 and 2:
PRACTICING PRECAUTION and ADAPTIVE
- Page 3 and 4:
ACKNOWLEDGEMENTSPracticing Precauti
- Page 5 and 6:
A- EXECUTIVE SUMMARYINTRODUCTIONWit
- Page 7 and 8:
This study must be considered as an
- Page 9 and 10:
The regulatory scheme does not expl
- Page 11 and 12:
increased the TAC. However, for cod
- Page 13 and 14:
B - INTRODUCTION: UNCERTAINTY, PREC
- Page 15 and 16:
mechanisms of participation, such a
- Page 17 and 18:
Some causes of uncertainty are more
- Page 19 and 20:
The distinction between principle a
- Page 21 and 22:
estimates serve as a notional bench
- Page 23 and 24:
1 As Jonathan Wiener emphasizes, re
- Page 25 and 26:
C- RESEARCH METHODOLOGYEVALUATING I
- Page 27 and 28:
questionnaire: for each concept, th
- Page 29 and 30:
D-2
- Page 31 and 32:
Nathalie Chalifour & Yves Prévost
- Page 33 and 34:
III.B.4. Principe 4.4 Il devrait y
- Page 35 and 36:
Le Canada a aussi des obligations e
- Page 37 and 38:
En septembre 2001, le gouvernement
- Page 39 and 40:
données de l’ACIA. Le Service ca
- Page 41 and 42:
II.B. Les NIMP 2 et les ARP’s de
- Page 43 and 44:
L’AF se qualifie comme OQ, car l
- Page 45 and 46:
II.C. Les règlements additionnels
- Page 47 and 48:
II.C.1e. Règlement sur l’indemni
- Page 49 and 50:
II.C.2d. Règlement sur l’indemni
- Page 51 and 52:
défi est donc de savoir quand s’
- Page 53 and 54:
III.B.3. Principe 4.3 L’applicati
- Page 55 and 56:
arrivent aux ports canadiens tous l
- Page 57 and 58:
VI. ANNEXE I. ABRÉVIATIONSACIAAgen
- Page 59 and 60:
29 Kai N. Lee, « Appraising Adapti
- Page 61 and 62:
D-34
- Page 63 and 64:
Jennifer A. Chandler - The Regulati
- Page 65 and 66:
Jennifer A. Chandler - The Regulati
- Page 67 and 68:
As a result, a new plant is exempt
- Page 69 and 70:
decision-maker “shall” refuse t
- Page 71 and 72:
the intermediate situation, proof o
- Page 73 and 74:
data and relevant scientific inform
- Page 75 and 76:
The PBO has already anticipated the
- Page 77 and 78:
As noted earlier, the environmental
- Page 79 and 80:
Biosafety Office (PBO). The plants
- Page 81 and 82:
In the judgment of the Expert Panel
- Page 83 and 84:
espect to the test data submitted a
- Page 85 and 86:
40 These are (1) the potential of t
- Page 87 and 88:
93 Ibid.94 Directive 94-08, supra n
- Page 89 and 90:
C. Scott Findlay & Annik Déziel -
- Page 91 and 92:
C. Scott Findlay & Annik Déziel -
- Page 93 and 94:
III. A BRIEF HISTORY OF PESTICIDE R
- Page 95 and 96:
into account its conditions or prop
- Page 97 and 98:
manner representative of the route,
- Page 99 and 100:
Precisely how the various uncertain
- Page 101 and 102:
In the past, special reviews have b
- Page 103 and 104: VIII.C. Is PMRA practicing precauti
- Page 105 and 106: From these considerations, the mini
- Page 107 and 108: effects of decisions are systematic
- Page 109 and 110: eported. Note furthermore that this
- Page 111 and 112: Pest Management Regulatory Agency (
- Page 113 and 114: Dan E. Lane - Setting TACs in the 4
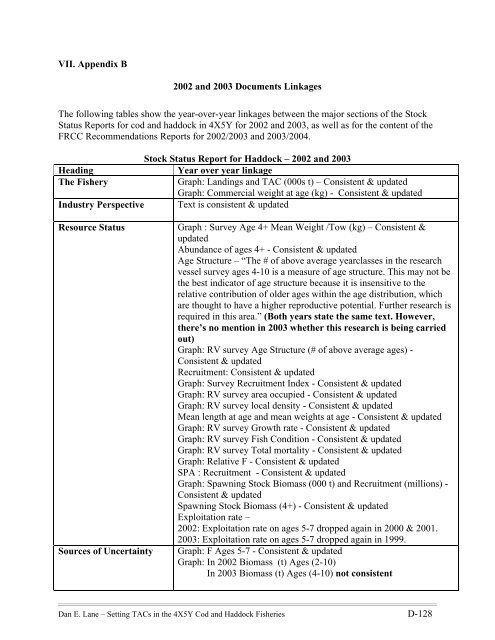
- Page 115 and 116: LIST OF TABLESTable 1. Stock Status
- Page 117 and 118: Environment). As it expanded, Canad
- Page 119 and 120: 3) FRCC prepare TAC recommendations
- Page 121 and 122: 4) The Minister’s Final DecisionB
- Page 123 and 124: 7) Outlook - highlights of the abun
- Page 125 and 126: ultimate authority for all access a
- Page 127 and 128: II. CASE STUDYII.A. Setting TACs in
- Page 129 and 130: Scotian Shelf. Approximately 50% of
- Page 131 and 132: The prognoses of the stocks for 200
- Page 133 and 134: F0.1, used as the benchmark rate, m
- Page 135 and 136: Sources ofUncertaintyAge Structure:
- Page 137 and 138: Sources ofUncertaintyPrincipal sour
- Page 139 and 140: OutlookIndicators of Abundance:Indi
- Page 141 and 142: ManagementConsiderationsEcosystemCo
- Page 143 and 144: constructed on the basis of the wei
- Page 145 and 146: expected growth in the stock, and t
- Page 147 and 148: IV. RECOMMENDATIONSIV.A. Case study
- Page 149 and 150: V. REFERENCESCanada 2005. A Framewo
- Page 151 and 152: Hutchings, J.A. 1996. Spatial and t
- Page 153: VI. APPENDIX AStock Status Report D
- Page 157 and 158: Sources of UncertaintyOutlookSPA -
- Page 159 and 160: E- COMMENTARY AND ANALYSIS OF RESEA
- Page 161 and 162: COMMENTARY AND ANALYSIS OF RESEARCH
- Page 163 and 164: TABLE OF CONTENTSI. PRACTICING PREC
- Page 165 and 166: I. PRACTICING PRECAUTION - EXPLORAT
- Page 167 and 168: Table 3: Questions with missing dat
- Page 169 and 170: Figure 1. The raw data from the que
- Page 171 and 172: Figure 4. S(n) versus n for Part II
- Page 173 and 174: I.F.2. Approach #2 (dimension reduc
- Page 175 and 176: Data reduction to 2 variablesII_220
- Page 177 and 178: I_1210-1-21pest 2fish 3gmo 4frstcas
- Page 179 and 180: II. PRACTICING PRECAUTION EXPLORATO
- Page 181 and 182: II.C. GoalsThe goal of this examina
- Page 183 and 184: Figures 16, 17, and 18 do not contr
- Page 185 and 186: Conclusions & Summary F-2
- Page 187 and 188: Conclusions & Summary F-4
- Page 189 and 190: one government department to anothe
- Page 191 and 192: involves the scrutiny of procedural
- Page 193 and 194: can assess the risks inherent in a
- Page 195 and 196: entrenched in the treaties and legi
- Page 197 and 198: III. REFORM POSSIBILITIESFactoring
- Page 199 and 200: ased decision-making. Finally, thes
- Page 201 and 202: The answers will depend on context,
- Page 203 and 204: ased on the administrative principl
- Page 205 and 206:
decisions must maintain the adminis
- Page 207 and 208:
Potential Future WorkAmong the many
- Page 209 and 210:
On the South Australia Environment,
- Page 211 and 212:
G - APPENDICES:i. Document Question
- Page 213 and 214:
Practicing PrecautionTo which case
- Page 215 and 216:
10) The following is a list of "pre
- Page 217 and 218:
15) There are many different source
- Page 219 and 220:
• Decisions are treated as scient
- Page 221 and 222:
Revised February 25, 2005PRACTICING
- Page 223 and 224:
II.1. Does the legislation constitu
- Page 225 and 226:
III.2.a Does the legislation contai
- Page 227 and 228:
III.8.i “endangered”III.8.j “
- Page 229 and 230:
III.13.a Uncertainty about effects
- Page 231 and 232:
IV.5.g Monitoring is conducted by t
- Page 233 and 234:
V.7.Do decision-makers have access
- Page 235 and 236:
iii. WORKSHOP SUMMARY“Precaution,
- Page 237 and 238:
science, to Type I and Type II erro
- Page 239 and 240:
iv. WORKSHOP PARTICIPANTSMARCH 8 th
- Page 241 and 242:
NATHALIE DES ROSIERS613-562-5902nat
- Page 243:
Mike WilsonDirector, Strategic Issu