- Page 6:
Retrotransposons of rice as a tool
- Page 11 and 12:
First, the Rice Genetics Cooperativ
- Page 13 and 14:
OverviewRice genetics from Mendel t
- Page 15 and 16:
Rice genetics from Mendelto functio
- Page 17 and 18:
nese cultivar Nipponbare. The chrom
- Page 19:
Gene symbolization in riceIn the ab
- Page 26 and 27:
Table 2. Some examples of mapping g
- Page 28 and 29:
and YAC libraries, respectively. Th
- Page 30 and 31:
gene from wild species is the intro
- Page 32 and 33:
ReferencesAbbasi FM, Brar DS, Carpe
- Page 35 and 36:
Nagao S. 1951. Genic analysis and l
- Page 37:
Yoshimura S, Yamanouchi U, Katayose
- Page 40 and 41:
important traits for which segregat
- Page 42 and 43:
trolled by a single recessive gene,
- Page 44 and 45:
AromaAromatic rice varieties often
- Page 46 and 47:
Submergence tolerance is an interes
- Page 48 and 49:
Kinoshita T, Maekawa M. 1986. Genet
- Page 50 and 51:
NotesAuthors’ addresses: J.N. Rut
- Page 52 and 53:
The Rockefeller Foundation has a lo
- Page 54 and 55:
Evolution and implementation of the
- Page 56 and 57:
Scientific progress and outputsIn t
- Page 58 and 59:
Another salient example is that of
- Page 60 and 61:
BOX NO. 1recent international works
- Page 62 and 63:
For the purposes of this discussion
- Page 64 and 65:
Because of the great diversity (sci
- Page 66 and 67:
eeders where final products to enha
- Page 68 and 69:
Chen S, Lin XH, Xu CG, Zhang Q. 200
- Page 70 and 71:
Toenniessen GH. 1998. Rice biotechn
- Page 73 and 74:
Molecular markers,genetic diversity
- Page 75 and 76:
Evolution and domestication of rice
- Page 77 and 78:
ABCDO. barthiiO. rufipogonO. longis
- Page 79 and 80:
Wild(O. rufipogon)Geographical diff
- Page 81 and 82:
South Asia (particularly on the wes
- Page 83 and 84:
al 1992, Sun et al 1996a,b,c), thou
- Page 85 and 86:
wild and cultivated types (Est10, W
- Page 87 and 88:
Cai HW, Morishima H. 2000a. Diversi
- Page 89:
Sato YI, Tang SX, Yang LU, Tang LH.
- Page 92 and 93:
The solid base laid by classical ri
- Page 94 and 95:
The synthesis shown in Figure 1 is
- Page 96 and 97:
Arabidopsis, long heralded as a “
- Page 98 and 99:
Monocots and eudicots: Is there sti
- Page 100 and 101:
Zhang H, Jia J, Gale MD, Devos KM.
- Page 102 and 103:
ility of rice productivity (Lu 1999
- Page 104 and 105:
Table 1 continuedIntrageneric class
- Page 106 and 107:
Molecular markers and evolutionary
- Page 108 and 109:
A100100521010078100991009894100O. s
- Page 110 and 111:
Two distinct types of sequences wer
- Page 112 and 113:
arthii and O. longistaminata, and t
- Page 114 and 115:
testing Ka/Ks between the homeologo
- Page 116 and 117: Roschevicz RI. 1931. A contribution
- Page 119 and 120: Miniature inverted repeattransposab
- Page 121 and 122: eau and Wessler 1992, 1994), rice (
- Page 123 and 124: MITEs as a source of allelic divers
- Page 125 and 126: ATIR Olo-D* Olo-CTIRBCas Exp Wan Sn
- Page 127 and 128: Le QH, Wright S, Yu Z, Bureau T. 20
- Page 129 and 130: Microsatellite markers in rice:abun
- Page 131 and 132: make the best SSR markers for rice.
- Page 133 and 134: Predicted frequency100,00080,000Cla
- Page 135 and 136: Relationship between SSRs and genes
- Page 139 and 140: are indicated with RM locus designa
- Page 141 and 142: SSRs have been used to define intro
- Page 143 and 144: provide a bridge for moving rapidly
- Page 145 and 146: Ishii T, McCouch SR. 2000. Microsat
- Page 147: NotesAuthors’ addresses: S.R. McC
- Page 150 and 151: traits of economic importance (Mack
- Page 152 and 153: Table 2. Tagging and mapping of som
- Page 154 and 155: even at the juvenile stage. Several
- Page 156 and 157: Chen et al (2000) transferred the b
- Page 158 and 159: genome sequence of rice, this will
- Page 160 and 161: Kurata N, Nagamura Y, Yamamoto K, H
- Page 162 and 163: Witcombe JR, Hash CT. 2000. Resista
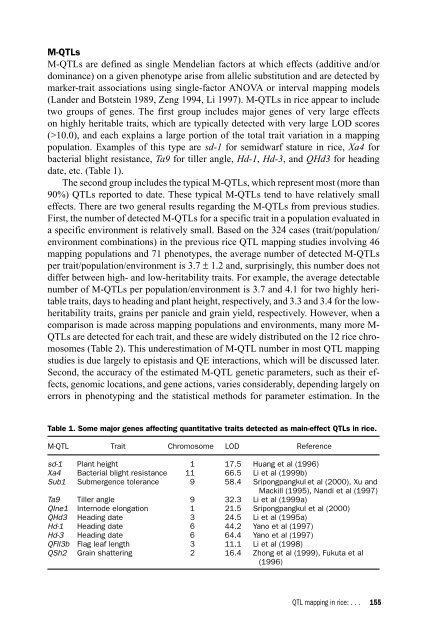
- Page 165: QTL mapping in rice:a few critical
- Page 169 and 170: (genetic/statistical models and cor
- Page 171 and 172: Table 5. The percentage of three ty
- Page 173 and 174: Table 7. Some environment-specific
- Page 175 and 176: ferently to the environments. Simil
- Page 177 and 178: (case 3), one may infer that this g
- Page 179 and 180: Simultaneous QTL introgression and
- Page 181 and 182: Doebley J, Stec A, Gustus C. 1995.
- Page 183: Visscher PM, Haley CS, Thompson R.
- Page 186 and 187: unavailable until recently with the
- Page 188 and 189: Table 1 continued.Trait QTL a Flank
- Page 190 and 191: the remaining parts of the linkage
- Page 192 and 193: Table 3. QTLs detected for yield an
- Page 194 and 195: Table 6. Correlations of various pa
- Page 196 and 197: The functions of these sequences ne
- Page 199 and 200: Structural and functional genomicsT
- Page 201 and 202: The International Rice GenomeSequen
- Page 203 and 204: the RGP, a PAC (P1-derived artifici
- Page 205 and 206: Progress of sequencing in the RGPWe
- Page 207 and 208: ice genome sequencing to organize a
- Page 209 and 210: Strategies and techniquesfor finish
- Page 211 and 212: uses the quality values generated b
- Page 213 and 214: with the advanced techniques requir
- Page 215 and 216: times contain sufficient data to ma
- Page 217 and 218:
amplification of regions that previ
- Page 219 and 220:
4. Structure problems—subcloning
- Page 221 and 222:
estriction maps or optical maps are
- Page 223 and 224:
nal assembly may point to areas tha
- Page 225 and 226:
McMurray AA, Sulston JE, Quail MA.
- Page 227 and 228:
Sequence-tagged connector/DNA finge
- Page 229 and 230:
1999). The development of multiple-
- Page 231 and 232:
Transposable elements in the rice H
- Page 233 and 234:
ers, maps, mapping populations, and
- Page 235 and 236:
Miropeats-OSJNBa0065H03 1.2 cMThres
- Page 237:
NotesAuthors’ addresses: R.A. Win
- Page 240 and 241:
Sasaki 1997). Such analysis is ofte
- Page 242 and 243:
ABNipponbare × KasalathF 2QTL anal
- Page 244 and 245:
were classified into two groups bas
- Page 246 and 247:
effective at determining the genoty
- Page 248 and 249:
addition, some accessions of wild r
- Page 250 and 251:
Sasaki T, Burr T. 2000. Internation
- Page 252 and 253:
Mutational analysis has long been t
- Page 254 and 255:
marked by a deletion/chromosomal re
- Page 256 and 257:
analysis suggests that the mutation
- Page 258 and 259:
For drought-response screening, our
- Page 260 and 261:
Pi-7(t)Xa21Xa10Xa3Xa4Pi-1(t)Pi-k, P
- Page 262 and 263:
Although mutants with discrete gene
- Page 265 and 266:
Generation of T-DNA insertionaltagg
- Page 267 and 268:
Aprobe AEEprobe BpGA1633RBgus Tn p3
- Page 269 and 270:
Number of loci36%224%170%010 20 30F
- Page 271 and 272:
Table 2. GUS assay in roots of tran
- Page 273 and 274:
1999, Krysan et al 1999, Sato et al
- Page 275 and 276:
Transposons and functionalgenomics
- Page 277 and 278:
cesses. To study the interactions a
- Page 279 and 280:
Constructs were made with the aim o
- Page 281 and 282:
RBcis-effect of the adjacent strong
- Page 283 and 284:
Ac knockout mutagenesisThe Ac lines
- Page 285 and 286:
Table 2 summarizes the transformati
- Page 287 and 288:
ReferencesBaldwin D, Crane V, Rice
- Page 289:
NotesAuthors’ addresses: R. Greco
- Page 292 and 293:
These include T-DNA (Azpiroz-Leehan
- Page 294 and 295:
polyproteins and two identical 138-
- Page 296 and 297:
mutant. The mutation in the ent-kau
- Page 298 and 299:
primers (G1, G2) and two Tos17-spec
- Page 300 and 301:
of insertion mutants by sequencing
- Page 302 and 303:
Grandbastien M-A, Spielman A, Caboc
- Page 304 and 305:
NotesAuthors’ addresses: H. Hiroc
- Page 306 and 307:
human endeavor, greatly contributed
- Page 308 and 309:
Equally important as the genomic in
- Page 310 and 311:
Oryzabase is one of the most recent
- Page 312 and 313:
Database structureA characteristic
- Page 314 and 315:
types of users. An annotation datab
- Page 316 and 317:
ReferencesAntonio BA, Fang Z, Sanch
- Page 319 and 320:
Gene isolation and functionEnhancin
- Page 321 and 322:
Enhancing deployment of genes forbl
- Page 323 and 324:
mochi and Tsuyuake (Wu et al 1996).
- Page 325 and 326:
tive indica rice varieties supports
- Page 327 and 328:
transcription factor, resulting in
- Page 329 and 330:
facilitate breeding durable resista
- Page 331 and 332:
(Inukai et al 1994, Yu et al 1996,
- Page 333 and 334:
Rossman AY, Howard RJ, Valent B. 19
- Page 335 and 336:
Molecular signaling in diseaseresis
- Page 337 and 338:
AOsRac1IED II III IV 214aaOsRac1 KC
- Page 339 and 340:
Japonica rice variety Kinmaze, whic
- Page 341 and 342:
Table 1. Characteristics of lesion-
- Page 343 and 344:
an effective inducer of host resist
- Page 345:
Takahashi A, Kawasaki T, Henmi K, S
- Page 348 and 349:
et al 2000). Sequence analysis of t
- Page 350 and 351:
612-amino acid protein, including t
- Page 352 and 353:
Genetic dissection of the Xa21-medi
- Page 354 and 355:
ReferencesAnderson PA, Lawrence GJ,
- Page 357 and 358:
Isolation of candidate genesfor tol
- Page 359 and 360:
Materials and methodsPlant material
- Page 361 and 362:
Microarray hybridization and data a
- Page 363 and 364:
Table 3. Most abundant transcripts
- Page 365 and 366:
Microarray technologyThe rapid accu
- Page 367 and 368:
view of procedures, pitfalls, and n
- Page 369 and 370:
Log(2) ratio1.51.0OC104E01—WCP1OC
- Page 371 and 372:
Table 5. Strongly regulated transcr
- Page 373 and 374:
ReferencesAdams MD, Soares MB, Kerl
- Page 375:
Acknowledgments: We thank Chris Bor
- Page 378 and 379:
y cells separating during tissue de
- Page 380 and 381:
(Erwee and Goodwin 1983). The sympl
- Page 382 and 383:
tion between the abundance of CDK t
- Page 384 and 385:
in a complex of 105 kDa. These resu
- Page 386 and 387:
Drew MC, Jackson MB, Giffard S. 197
- Page 388 and 389:
Umeda M, Umeda-Hara C, Yamaguchi M,
- Page 390 and 391:
asexual reproduction through apomix
- Page 392 and 393:
MPManual pollination by breeders×
- Page 394 and 395:
Search for apomixis in riceThere ar
- Page 396 and 397:
Issues related to achieving synthet
- Page 398 and 399:
come and may use imprinting to achi
- Page 400 and 401:
Embryo-inducing geneInactive ablati
- Page 402 and 403:
M 1 3 3 4 5 6 7 8 9 10 11 12 13 14
- Page 404 and 405:
embryos, several genes characterist
- Page 406 and 407:
Our search for a rice homologue of
- Page 408 and 409:
sequenced the two rice DMC1 genes a
- Page 410 and 411:
Gustine DL, Sherwood RT, Huff DR. 1
- Page 412 and 413:
Peel MD, Carman JG, Leblanc O. 1997
- Page 415 and 416:
TransformationEngineering for virus
- Page 417 and 418:
Engineering for virusresistance in
- Page 419 and 420:
proteins, (2) the expression of dys
- Page 421 and 422:
Antisense and cosuppression RNA. Ex
- Page 423 and 424:
Table 1. Transgenic rice with patho
- Page 425 and 426:
the disease symptoms. Efforts from
- Page 427 and 428:
an ambisense coding strategy (Fig.
- Page 429 and 430:
first produced and shown to have vi
- Page 431 and 432:
McLean GD, Evans G. 1997. Some pote
- Page 433:
Waterhouse PM, Upadhyaya NM. 1998.
- Page 436 and 437:
duction in response to dehydration
- Page 438 and 439:
(KIKEKLPG) in the carboxyl terminus
- Page 440 and 441:
These three plasmids were used to t
- Page 442 and 443:
We now show the effects of the toba
- Page 444 and 445:
Since one major goal of plant scien
- Page 446 and 447:
Table 4. Copy number of transgenes
- Page 448 and 449:
Chan M-T, Chang H-H, Ho S-L, Tang W
- Page 450 and 451:
NotesAuthors’ address: Department
- Page 452 and 453:
initially fixed by phosphoenolpyruv
- Page 454 and 455:
High-level expression of maize C 4-
- Page 456 and 457:
The effect of illumination on PPDK
- Page 458 and 459:
ate in 2% O 2 can be limited by Pi
- Page 461 and 462:
Transgene integration,organization,
- Page 463 and 464:
duced by organogenesis, somatic emb
- Page 465 and 466:
ing transgene organization. FISH an
- Page 467 and 468:
ments and the integration of exogen
- Page 469 and 470:
Level 2: activation of local repair
- Page 471 and 472:
strongly suggested that plant facto
- Page 473 and 474:
other cases it was not. We observed
- Page 475 and 476:
Gorbunova V, Levy AA. 1997. Non-hom
- Page 477 and 478:
Gene silencing and itsreactivation
- Page 479 and 480:
Carbofuran (trade name, Furadan) is
- Page 481 and 482:
Akb4xHpaIIJKA52 (R 0)52-6 (R 1)52-9
- Page 483 and 484:
ABCDhptuidAmUbi1kb10.08.05.04.13.0F
- Page 485 and 486:
Fig. 4. X-gluc staining of germinat
- Page 487 and 488:
eflect different causes for silenci
- Page 489 and 490:
Table 4. Suppressors of silencing f
- Page 491 and 492:
Garrick D, Fiering S, Martin DI, Wh
- Page 493:
Xu Y, Buchholz WG, DeRose RT, Hall
- Page 496 and 497:
Rice molecular breeding workshopThi
- Page 498 and 499:
the working group can develop a net
- Page 500:
Rice genetics cooperativeA meeting