Impetus - Universität zu Köln
Impetus - Universität zu Köln
Impetus - Universität zu Köln

Create successful ePaper yourself
Turn your PDF publications into a flip-book with our unique Google optimized e-Paper software.
IMPETUSWest AfricaAn Integrated Approach to theEfficient Management of Scarce Water Resourcesin West Africa:Case studies for selected river catchmentsin different climatic zonesSecond Final ReportPeriod: 1.5.2003 - 31.7.2006An interdisciplinary project of the Universities of Cologne and Bonn31.07. 2006
Az:IMPETUS Abschlussbericht Phase2.docCo-ordinating institutionsUniversity of CologneInstitute of Geophysics and MeteorologyProf. Dr. P. Speth (Director)Kerpener Str. 13D-50923 KölnTelefon: 0221-470 3679Fax: 0221-470 5161E-mail: speth@meteo.uni-koeln.deUniversity of BonnInstitute of GeographyProf. Dr. B. Diekkrüger (Vice Director)Meckenheimer Allee 166D-53115 BonnTelefon: 0228-73 2107Fax: 0228-73 5393E-mail: b.diekkrueger@uni-bonn.deKontaktadresse:Universität <strong>zu</strong> KölnInstitut für Geophysik und MeteorologieDr. Michael Christoph (Geschäftsführer)Kerpener Strasse 13D – 50923 KölnGermanyTelefon: +49 221 470 3690Fax: +49 221 470 5161E-mail: christoph@meteo.uni-koeln.deContact us:University of CologneInstitute of Geophysics and MeteorologyDr. Michael Christoph (Project Manager)Kerpener Strasse 13D – 50923 CologneGermanyTelephone: +49 221 470 3690Fax: +49 221 470 5161E-mail: christoph@meteo.uni-koeln.deDas diesem Bericht <strong>zu</strong>grundeliegende Vorhaben wurde mit Mitteln des Bundesministeriumsfür Bildung und Forschung unter dem Förderkennzeichen 01LW0301A, mit Mittelndes Ministeriums für Innovation, Wissenschaft, Forschung und Technologie desLandes Nordrhein-Westfalen unter dem Förderkennzeichen 313-21200200, sowie durchdie Universitäten Köln und Bonn gefördert. Die Verantwortung für den Inhalt dieserVeröffentlichung liegt bei den Autoren.
IMPETUSInhaltsverzeichnis / ContentsPageZusammenfassung 1I. Einleitung / Introduction 5II. Szenarienentwicklung / Developement of scenariosII.1 Methode / MethodII.1.1 Hintergrund: Relevanz von Szenarien für IMPETUSBackground: relevance of scenarios for IMPETUSII.1.2 Szenarienentwicklung in IMPETUSDevelopment of scenarios in IMPETUSII.1.3 Skalen der SzenarienScales of scenariosII.1.4 Einbeziehung der “Stakeholder” in die Entwicklung der SzenarienIntegration of stakeholder into the development of scenariosII.1.5 Zukünftige ArbeitsschritteFuture work stepsII.2 Allgemeine Szenarien / General scenariosII.3 Klimaszenarien / Climate scenariosIII. Problemkomplexe / Problem clustersIII.1 Methode / MethodIII.2 Übersicht der Problemkomplexe / Overview of problem clusters999111415151736414345IV. Capacity Building 55V. IMPETUS Publikationen / Publications 62VI. Darstellung der Teilprojekte / Presentation of the subprojects 67Part A:Der hydrologische Kreislauf des Ouémé-Ein<strong>zu</strong>gsgebietes und sozioökonomischeImplikationenThe hydrological cycle of the Ouémé-Catchment and socio-economic implicationsAB1 Externe Klima-Antriebsszenarien auf der globalen und kontinentalen SkalaExternal climate forcing scenarios on the global to continental scaleA1 Szenarien der raum-zeitlichen Variabilität von Niederschlag und Verdunstungauf der regionalen und lokalen SkalaScenarios of the spatio-temporal variability of precipitation and evaporation onthe regional to local scale676991
IMPETUSA2 Bodenwasserdynamik, Oberflächenabfluss, Grundwasserneubildung undBodendegradation auf der lokalen und regionalen SkalaSoil water dynamics, surface runoff, groundwater recharge and soil degradationon local to regional scaleA3 Funktionale Beziehungen zwischen raumzeitlicher Vegetationsdynamik undWasserkreislaufFunctional relationships between spatio-temporal vegetation dynamics and watercycleA4 Sozioökonomische Entwicklung im Hinblick auf die Verfügbarkeit der Ressourcen– Agrarsektormodellierung und WasserbedarfsanalyseSocio-economic development against the background of resourceavailability – agricultural sector modelling and water demand analysisA5 Verfügbarkeit, Qualität und Management von natürlichen Ressourcen:Sozialwissenschaftliche und medizinische PerspektivenAvailability, quality and management of natural resources: social and medicalperspectivesPart B:Die Wasserbilanz des Drâa-Ein<strong>zu</strong>gsgebietes und sozioökonomischeImplikationenWater-balance of the Drâa-catchment area and socio-economic implications107125149169187AB1 Externe Klima-Antriebsszenarien auf der globalen und kontinentalen SkalaExternal climate forcing scenarios on the global to continental scaleB1 Regionale und lokale Szenarien der raum-zeitlichen Variabilität von Niederschlagund Verdunstung in MarokkoRegional and local scenarios of the spatio-temporal variability of precipitationand evaporation in MoroccoB2 Wasserverfügbarkeit und BodendegradationWater availability and soil degradationB3 Steuerfunktionen der Vegetation für den Gebietswasserhaushalt des Drâa-Ein<strong>zu</strong>gsgebietesFunctional relations between the vegetation and the water budget of the Drâa-CatchmentB4 Modellierung von Landnut<strong>zu</strong>ngsveränderung vor dem Hintergrund knapperRessourcen und globalisierter AgrarmärkteModelling of the land use changes against the backround of scarce resourcesand globalized agricultural markets189193207227243
IMPETUSB5 Soziokultureller Wandel und Wassernut<strong>zu</strong>ng im Ein<strong>zu</strong>gsgebiet des DrâaSocio-cultural changes and water use in the Drâa-CatchmentPart C:Integration, Organisation und DatenmanagementIntegration, organisation and data managementC2 Datenmanagement und übergeordnete ArbeitenData and general management253267269VII. IMPETUS-Atlanten / IMPETUS-Atlases 276
2IMPETUS Zusammenfassungist (lose gekoppeltes System). Am Ende der Bearbeitung dieser Problemkomplexe stehen unterschiedlicheLösungen in Form von Handlungsoptionen, die die Grundlagen für die Bereitstellungvon „Decision Support Systems“ im Laufe der dritten Phase beschreiben. Auf Basis der inIMPETUS vorhandenen Fachkompetenz und der inzwischen langjährigen Erfahrung in denbetreffenden Ländern wurden für Benin 20 solcher Problemkomplexe und für Marokko 13 definiertund mit den lokalen Kooperationspartnern abgestimmt. Aus Gründen der Übersichtlichkeitwurden die Problemkomplexe in die vier folgenden so genannten „Themenbereiche“ gruppiert:(i) Ernährungssicherung (in Benin) bzw. Existenzsicherung (in Marokko), (ii) Hydrologie (Wasserdargebot,Wasserverbrauch, Wasserqualität), (iii) Landnut<strong>zu</strong>ng sowie (iv) Gesellschaft undGesundheit (in Benin) bzw. Gesellschaft (in Marokko).Ein weiterer bedeutender Meilenstein der durchgeführten übergreifenden Arbeiten war die Erstellungeines Atlasses für Benin bzw. Marokko, der auch als digitale Version auf CD bzw. imInternet vorliegt. Ziel war es hierbei, die Kluft zwischen Wissenschaftlern und Anwendern oderanderen interessierten Personen ab<strong>zu</strong>bauen. Darüber hinaus kann der Atlas bereits als Werkzeug<strong>zu</strong>r Analyse von Prozessen und als erste Grundlage für Entscheidungen herangezogen werden.Die bestehende IMPETUS-Metadatenbank wurde intensiv gepflegt und erweitert und ist ebenfallseine wichtige Grundlage für die Arbeiten der dritten Phase. Der ständig aktualisierte Internetauftrittsowie die regelmäßigen Mitteilungsbriefe in Deutsch und Französisch hielten die Beteiligtenhinsichtlich neuester interner und externer Entwicklungen auf dem Laufenden.In disziplinärer Hinsicht werden die wichtigsten Ergebnisse nachfolgend genannt:Nach den verheerenden Dürren Anfang der 1970er und Mitte der 1980er Jahre haben sich dieMonsunniederschläge im Sahel wieder leicht erhöht, ohne das Niveau der feuchten 1950er und1960er Jahre <strong>zu</strong> erreichen. Auch in der Guineaküstenregion, in welcher die überwiegende Mehrzahlder Westafrikaner lebt, verharren die Niederschläge seit 1990 auf unternormalem Niveau.Modellrechnungen weisen auf das Risiko von wieder abnehmenden Niederschlägen im Sahelhin. Diese Entwicklung hängt mit der weiter fortschreitenden Reduzierung der Waldbestände<strong>zu</strong>gunsten von Acker- und Weideflächen <strong>zu</strong>sammen.Wachsende Bevölkerungszahlen in Benin führen <strong>zu</strong> einem rasch <strong>zu</strong>nehmenden Landverbrauch.Da die Bauern außer <strong>zu</strong>r Baumwolle kaum düngen, verarmen die Böden rasch an pflanzenverfügbarenNährstoffen. Die Brachezeiten sind für eine Bodenregeneration <strong>zu</strong> kurz. Dies erhöhtden Landbedarf weiter und führt damit <strong>zu</strong> rasch weiter fortschreitender Rodung der Baumsavannen.Pflanzen- und Bodenanalysen ergaben, dass selbst die gedüngte Baumwolle oft nicht harmonischund ausreichend versorgt ist. Es besteht je nach Kulturart Mangel an Spurenelementen(z.B. Zink und Mangan), aber auch Schwefel und sogar Kalium. Ebenso nimmt der Gehalt anorganischer Substanz im Boden und damit auch dessen Speicherungsvermögen für Wasser durchdie Nut<strong>zu</strong>ng rasch ab. Mit aus mitteleuropäischer Sicht geringen Aufwendungen für eine angepassteniedrige Düngung lassen sich die Erträge oft mehr als verdoppeln. Die Ausnut<strong>zu</strong>ng dervorhandenen Niederschläge würde damit deutlich verbessert, der Landverbrauch könnte verringertund die Versorgungssicherheit erhöht werden.Die Viehhaltung in Benin expandiert annähernd im Gleichschritt mit dem raschen Zuwachs derBevölkerung. Dies stellt ein <strong>zu</strong>nehmendes Problem für die nachhaltige Nut<strong>zu</strong>ng von Land, Vegetationund Wasser dar. Die Produktivität der Viehwirtschaft in Benin hat sich seit der Unabhän-
Zusammenfassung IMPETUS 3gigkeit 1960 nur unwesentlich verändert; es gibt kaum Ansätze <strong>zu</strong> verbesserten Haltungsformenwie etwa Zäune, Stallhaltung oder den Ersatz von natürlichem Weidefutter durch Futteranbauund -konservierung. Rinder, Schafe und Ziegen werden fast ausschließlich in extensiver Weidehaltunggehalten. Der Flächenverbrauch dieser Haltungsform ist je produzierter Einheit Fleischoder Milch im Vergleich <strong>zu</strong> Koppel- oder Stallhaltungsformen sehr hoch. Außerdem sorgt die<strong>zu</strong>nehmende Ausdehnung der Ackerflächen aufgrund des Bevölkerungswachstums für wachsendenDruck auf die Weidegebiete. Konflikte zwischen Viehhaltern und Ackerbauern, die meistunterschiedlichen Ethnien angehören, sind somit vorprogrammiert. Obgleich die lokalen Viehrassenan Perioden mit Wassermangel gut angepasst sind, bedingen die niedrigen täglichen Zunahmendennoch eine relativ geringe Effizienz des Tränkewassereinsatzes: Um ein KilogrammFleisch <strong>zu</strong> erzeugen, werden in Benin nach grober Schät<strong>zu</strong>ng etwa 226 Liter Wasser verbraucht,doppelt so viel wie im weltweiten Durchschnitt und siebenmal so viel wie in Industrieländern.Das obere Ein<strong>zu</strong>gsgebiet des Ouémé in Benin ist seit mehr als drei Jahrzehnten Zielregion fürMigrationen von Kleinbauern aus den dicht besiedelten südlichen und nordwestlichen Landesteilen.Gleichzeitig stellen die großen <strong>zu</strong>sammenhängenden Waldflächen und das dichte Gewässernetzdieses Raumes ein wichtiges Weide- und Wasserreservoir für Nomaden aus Benin und denangrenzenden Staaten Niger und Nigeria dar. Besiedlung, Landnahme und Beweidung erfolgendabei ohne jegliche Intervention durch den beninischen Staat oder Organisationen der internationalenEntwicklungs<strong>zu</strong>sammenarbeit. In vielen Gebieten leben bereits heute mehr Migranten alsEinheimische, und das Zusammenleben der verschiedenen ethnischen Gruppen gestaltete sich inder Vergangenheit meist friedlich. Allerdings kommt es mittlerweile in den Gebieten, in denensich die Bevölkerung durch Zuwanderung während der letzten 10 Jahre verdoppelt hat, durchden <strong>zu</strong>nehmenden Druck auf die natürlichen Ressourcen immer häufiger <strong>zu</strong> z.T. gewaltsamenKonflikten (so genannte „Hot Spots“). In diesen Auseinanderset<strong>zu</strong>ngen um den Zugang <strong>zu</strong> Land,Wasser und Forstressourcen stehen sich in wechselnden Konstellationen einheimische Landbesitzerund Holzfäller, <strong>zu</strong>gewanderte Migranten und Nomaden gegenüber. Es zeigte sich, dass beieiner weiterhin ungeplanten Agrarkolonisierung in einigen Gebieten bis 2025 die letzten Wälderund Waldsavannen verschwunden sein werden.Wasser spielt auch eine bedeutende Rolle hinsichtlich des Gesundheits<strong>zu</strong>standes der Bevölkerung.Durch den Konsum von verschmutztem Trinkwasser werden Krankheiten wie Cholera,Typhus, Amöbenruhr und Hepatitis übertragen. Untersuchungen <strong>zu</strong>r bakteriologischen und virologischenTrinkwasserqualität im IMPETUS-Labor in Parakou haben gezeigt, dass 70% allerBrunnen und Wasserlöcher mit Keimen der Fäkalflora kontaminiert sind. In 7% der untersuchtenTrinkwasserquellen wurde eine virale Kontamination durch Adenoviren nachgewiesen. DesWeiteren konnten in 8% der Fälle Kontaminationen durch Salmonellen festgestellt werden, derenSerotypen in Deutschland weitgehend unbekannt sind. Mangelnde oder un<strong>zu</strong>reichende sanitäreAnlagen spielen für die Verbreitung der Kontaminationen eine wichtige Rolle. OffeneSchmutzwasserlachen bilden <strong>zu</strong>sätzlich eine ideale Brutstätte für verschiedene Mückenarten (Überträgervon Malaria, Flussblindheit und Gelbfieber). Die Existenzsicherung der Bevölkerungwird durch krankheitsbedingten Arbeitsausfall massiv gefährdet. Im Schnitt war die Bevölkerungim Untersuchungsgebiet 26 Tage im Jahr arbeitsunfähig auf Grund von eigener Erkrankung oderder Pflege Angehöriger. Der tatsächliche Ausfall dürfte weit höher liegen, da nur langwierige
4IMPETUS ZusammenfassungErkrankungen mit einer Dauer von über 3 Tagen erfasst wurden. Zusätzlich <strong>zu</strong> den Einkommensverlustenmüssen die Behandlungskosten getragen werden. Die Behandlungen der in derUntersuchungsgruppe erhobenen Erkrankungen kosteten 55 € pro Fall – dies entspricht ein biszwei lokalen Monatsgehältern.Die in den letzten Jahrzehnten beobachtete Erwärmung der Atmosphäre hat bereits <strong>zu</strong> wenigerSchneefall und einem Rück<strong>zu</strong>g der Gletscher der mittleren Breiten und der Subtropen geführt.Eine weitere, maßgeblich durch Zunahme der Treibhausgase bedingte Erwärmung wird dieseEntwicklung verstärken. Ergebnisse klimatologischer Untersuchungen und Simulationen mitRegionalklimamodellen zeigen, dass die Auswirkungen der Klimaänderung gerade im Atlasgebirgesehr folgenreich sind. Die Schneegrenze wird weiter in die hohen Gipfelregionen des Atlasgebirgesverschoben werden. Die Anzahl der Frost- und Eistage pro Jahr, an denen Schneeliegen bleiben kann, wird auch in den höchsten Regionen nicht wie bisher Monate, sondern nurnoch Wochen betragen. Dabei ist der touristische Aspekt des Schnees von untergeordneter Bedeutung.Der Niederschlag hat im Atlasgebirge zwei wichtige Aspekte: Auf der einen Seite versorgter Bevölkerung und Landwirtschaft mit Wasser, auf der anderen Seite führen Starkniederschlägeimmer wieder <strong>zu</strong> Zerstörungen durch Überflutungen und Erdrutsche. Weil bei großenNiederschlagsmengen ein Teil des Niederschlags als Schnee liegen bleibt und nicht direkt alsAbfluss <strong>zu</strong> Überflutungen beiträgt, wirkt die Schneedecke als Puffer zwischen Niederschlagsereignisund Abfluss. Sie verhält sich wie ein Speicher, der sogar in der beginnenden sommerlichenTrockenzeit noch Wasser liefert. Die von Klimamodellen vorhergesagte Verkleinerung derSchneefläche führt oberhalb des Stausees bei Ouarzazate <strong>zu</strong> einer Verlängerung der ohnehinschon langen Zeit des Wassermangels um nochmals 1-2 Wochen, was die Lebensumstände inder bereits heute von Landflucht gezeichneten Region des Hohen Atlas weiter verschlechtert.„Palmenmeere“ aus Dattelpalmen prägen das Bild des südlichen Drâa-Tals bis <strong>zu</strong>m nördlichenSahararand, wo sich der Fluss seit dem Bau des Staudamms bei Ouarzazate verliert. ZurückgehendeNiederschläge sowie eine verstärkte Konkurrenz um Wasser führten in den vergangenenJahren <strong>zu</strong>r Reduktion der am Stausee gesteuerten Bewässerungskampagnen (Lachées). Im Rahmenvon IMPETUS wurde mit Hilfe von Gaswechselmessgeräten das Transpirationsverhaltenvon Dattelpalmen in der Oase Ternata (Zagora) bestimmt. Die Erhebungen ergaben, dass Dattelpalmenbei guter Wasserversorgung etwa 700 mm Wasser jährlich verdunsten. Die potenzielleVerdunstung freier Wasseroberflächen in diesem Gebiet liegt bei etwa 3000 mm, die Transpirationder natürlichen Vegetation in der Umgebung des Tals bei etwa 12 mm. Somit verbraucht 1Hektar Dattelpalmen soviel wie etwa 60 Hektar der natürlichen Vegetation. Schlechtere Wasserversorgungführte in beiden Fällen <strong>zu</strong>r Reduktion der Transpirationsleistung um ca. 60-70%. ImFalle der Dattelpalmen hatte dies eine starke Beeinträchtigung der Populationen <strong>zu</strong>r Folge, währenddie natürliche Vegetation mit einer Reduktion der individuellen Biomasse reagierte, diePopulationsdichte aber unbeeinflusst blieb.
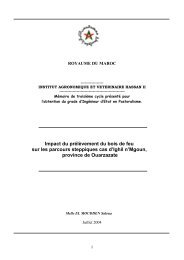
Introduction IMPETUS 5I. Einleitung / IntroductionShortage of fresh water is expected to be the dominant water problem of the 21 st Century and onethat, along with water quality, may well jeopardise all other efforts to secure sustainable development,and even in some cases lead to social and political instability. Fresh water has alreadybecome critically scarce in many regions. Some estimates suggest that today the amount of freshwater available for each person in Africa is only about a quarter of that in 1950 (Obasi, 1999),and that fresh water supply could become problematic especially in parts of Northwest and WestAfrica, where about 30 years of drought have been observed. The physical mechanisms responsiblefor the variability of climates in these regions are still relatively poorly known and understood.The possibility of human-induced climate change adds additional serious aspects to thechallenging water-related problems already encountered in many parts of the world.MotivationIn order to solve present and possible future problems with regard to fresh water supply, a clearlyinterdisciplinary and holistic approach is necessary. This is done for West Africa in the presentinitiative named IMPETUS, a joint venture of the universities of Cologne and Bonn, Germany.In the first three-year phase the focus was mainly on the diagnosis of different aspects of the waterbudget and their interactions. Based on this, in the second three-year phase methods weredeveloped to assess the bandwidth of changes expected during the coming decades. In the finalthree years the collected insights of all the disciplines involved will be used for the developmentand provision of operational tools for local decision makers. Such decision support systems willallow stakeholders to assess risks and likely impacts on the local and regional scale.Choice of catchmentsWest Africa was chosen because (i) it has experienced the most pronounced inter-decadal variabilityof climate in the world during the 20th century, (ii) relations to the climates of Europemight exist via complex atmosphere-ocean interactions in the area of the tropical/ subtropicaland north Atlantic ocean, and (iii) the regions north and south of the Sahara might be linked viaatmospheric teleconnection processes with regard to precipitation anomalies; first results giveevidence for the existence of such a link by atmospheric moisture transports out of the area of theITCZ over the Western Sahel zone northward across the Sahara towards the Atlas mountains.(Knippertz et al., 2003).Between the Atlas Mountains and the Gulf of Guinea (Fig. I-1) two reasonable sized river catchmentswere chosen along a transect according to the following criterias: feasibility (< 100.000km 2 ), availability of pre-existing data sets, political stable conditions, relevance and representativenessin the following sense: the Drâa catchment in the south east of Morocco is typical for agradient from humid/sub-humid subtropical mountains to their arid foothills; the Ouémé basin inBenin is typical of an alternating sub-humid climate (“Guinea-Soudanian”) of the outer tropicsembedded within a transect from the Sahelian to the Guinean Coast climate.
6IMPETUS IntroductionFig. I-1:The two river catchments of consideration: The DRÂA catchment in Morocco and theOUÉMÉ catchment in Benin are boldly bordered.Past and present situationMoroccan precipitation is strongly related to the large-scale atmospheric circulation over thesubtropical and extra-tropical North Atlantic and the Mediterranean Sea, with the bulk of precipitationoccurring in winter between November and March). Since the late 1970s, Morocco hasexperienced a number of extremely dry winter seasons, the causes of which are not fully understood.Against this background, the development of sustainable water resource management iseven more a necessity. The considered wadi Drâa possesses two main tributaries, the wadi Dadesand the wadi Ouarzazate which drain the south-eastern and the south-western parts of the Atlasand confluence near the city of Ouarzazate thereby forming the wadi Drâa. At the site of confluenceconstruction of a storage lake was completed in 1972 with an original storage capacity of560 million m 3 . Due to strong sedimentation a capacity of only 440 million m 3 remains today.Approximately 250 million m 3 of stored water is released in normal years for irrigation purposes.The irrigated perimeter covers a total area of approximately 26.500 ha. Since the snow melt inspring contributes significantly to the annual discharge of the main storage lake tributaries, diagnosingthe spatial distribution of accumulated snow water equivalent in the elevated areas of thecatchment is particularly desirable. An effective and sustainable management of water in theDrâa valley is essential to enable the competing users (water power generation, irrigation, do-
Introduction IMPETUS 7mestic consumption) to have adequate supplies, and to prevent social tensions related to waterresources.Since the early 1970s tropical West Africa has suffered from a prolonged drought that reached itsfirst climax in the first half of the eighties. The average rainfall deficit over 1971-1990 was ofthe order of 180 mm/year compared with the interval 1951-1970. From the semi-arid Sahel andthe subhumid Sudanese zone down to the humid Gulf of Guinea, all climatic zones have beenaffected. The prolonged West African drought has already brought about a profound deteriorationin the economic and social development of the West African countries. As a consequenceriver discharges in West Africa have decreased by about 40-60% in recent decades, causingshortages in river water available for domestic and agricultural purposes. As a consequence thishas led to extensive migrations in the past. During the rain-rich fifties, water power stations werebuilt in the Guinea coast zone to supply a substantial amount of energy to West African countries.Low discharges of the main tributaries are the main reason for frequent shortages in energyproduction experienced in recent years.Apart from the decreasing availability of fresh water per capita both in Morocco and in Benin thecurrent situation north and south of the Sahara is also characterized by increasing population(population growth rate more than 3% per year), increasing degradation of the natural vegetationdue to overgrazing (Morocco), demands in fire wood, and shifting cultivation (Benin). As a consequencesoils quickly erode in Morocco (to a lesser degree also in Benin) and salt contents risedue to intensive irrigation practices. In combination the aforementioned factors are likely to acceleratethe degradation and desertification processes for the coming decades.ConceptDue to the importance of the hydrological cycle regarding the availability of fresh water, its differentcomponents and their interactions were identified in its complexity and quantified in thecourse of the first three-year phase of this project. In an integrated approach a sequence of existingmodels (both numerical and expert models) of the individual disciplines involved have beenadapted and validated in order to describe the relationships and dependencies within the hydrologicalcycle in its present state. Local conditions and problems of each catchment also had to betaken into account. Basic research was only carried out if existing competence and experienceproved to be insufficient.After the project had begun in 2000 it turned out that the pre-existing data bases were poor orincomplete for the needs of some of the disciplines involved. In these cases intensive data acquisitioncampaigns and surveys were carried out especially in the field of socio-economy, anthropologyand medicine. For the better adaptation and validation of the numerical models of thenatural sciences the existing national monitoring networks were enforced in some parts by installingmeasurement instruments along the height gradient in Morocco and by setting up a socalled “super test site” in Benin.In the second three-year phase (May 2003 – July 2006) the focus was set on future development.This was done on the basis of coupling suitable models. Since the integration of coupled modelsin a single system seemed too complex, disciplinary models were loosely coupled depending onthe questions to be addressed. Due to the large uncertainty of models the future cannot be pre-
8IMPETUS Introductiondicted precisely. Therefore the bandwidth of future developments has to be assessed with thehelp of likely scenarios. This will also serve as a basis for assessment of suitable managementoptions for decision makers. In a first step coarse scenarios were designed based on the generaldevelopment in the countries under consideration and in agreement with local stakeholders. In asecond step these coarse scenarios were regionalised and detailed for specific problems. Thedesign of scenarios took into account the following aspects: climate change, socio-culturalchange, institutional change, population dynamics, economic development, and technologicalinnovation. The scale-dependent assessment (in time and space) of future development constitutesthe indispensable foundation for the design and implementation of management toolsneeded for decision makers in the course of the last three-year phase (starting in 2006).
Development of scenarios IMPETUS 9II.II.1Szenarienentwicklung / Development of scenariosMethodik / MethodII.1.1 Hintergrund: Relevanz von Szenarien für IMPETUS /Background: relevance of scenarios for IMPETUSScenarios help to describe potential future problems and to think about alternatives in the contextof uncertainties. Furthermore, they might help to increase our common understanding of problems,to detect and to test our assumptions and to identify useful problem-solving approaches.Scenarios enable us to combine the analysis of long-term development of the natural environment(in this case water) with the analysis of long-term impacts of political programs and measures.At the same time scenarios help us to better understand the mutual relationships betweennational, regional and local levels.Scenarios are consistent and plausible images of alternative futures that are rich enough to supportdecision making. A meaningful scenario shows different societal, ecologic and technologicalaspects of the system under investigation. Scenarios are no predictions or forecasts but alternativedevelopment routes of complex systems. In a nutshell, scenarios widen the informationbasis for decision-making in Benin and Morocco, especially through:• The identification of the most important driving forces on the national and regional level• The identification of sub-regional developments or events that are of national relevance• The identification of the most important inter-linkages between national and regional development• Identification of the most important knowledge gaps und unanswered questions whichpoint to further action needs.Many of our decisions will have far-reaching consequences that might trigger drastic and sometimesirreversible change in the future. The concept of sustainable development requires, however,that coming generations should have at least the same basic conditions and options for agood life as present generations have. The availability of fresh water is of crucial concern in thisregard, since it strongly influences economic, social and environmental development in Beninand Morocco. Therefore it is necessary to know how decisions taken today could affect futuredevelopments. Scenario analysis is a common tool for this exercise and allows to better asses therelative importance and the relative uncertainty of potential future trends and developments. Assessmentsof the suitability and impacts of measures of regional development thus can be combinedwith a robust and plausible orientation framework. The analysis of future trends and developmentsin Benin and Morocco is executed in IMPETUS mainly with the help of suited models.Due to the uncertainties that are associated with the modelling and the determination of thedriving forces, an exact prognosis of the direction of future development is not possible. Insteadwe use scenario analysis to estimate the bandwidth of plausible developments in order to enableour target group to deduce suitable advice from the results.
10IMPETUS Development of scenariosScenario requirementsScenarios can be developed both qualitatively or quantitatively. It is, however, state-of-the-art tocombine qualitative and quantitative analysis. Prominent examples are the scenarios of the IntergovernmentalPanel on Climate Change (IPCC, 2001) or the scenarios of the Millennium EcosystemAssessment von UNEP (UNEP, 2005). The following criteria are relevant for scenariodevelopment:• Qualitative storylines are generated that describe the general characteristics of the scenarioand the main driving forces, but also the degree of their mutual interaction.• The driving forces will be quantified on the basis of the storylines and are used for thesimulation of impacts.• Generation of storylines and the definition of indicators should be done in cooperationwith decision-makers and stakeholders.• Quite often, so called reference- or base scenarios are developed first that describe possiblegeneral developments of the system under investigation. Afterwards intervention (orpolitical)-scenarios are generated which analyse the influence of certain external events(war, economic crisis), policies, programmes or single measures on the system under investigation.DefinitionsThe terminus driving forces refers to these activities or structures, which influence a system, butare not influenced by the system itself (see EEA, 2001). Examples for driving forces are the trafficdevelopment in a country, its industry structure, the demographic development or the level ofpolitical stability. These driving forces trigger specific environmental pressures that can be measuredvia specific indicators (pressures) and lead to a certain state of the environment that can beassessed via state indicators (states). This triggers reactions from society and economy. Responseindicators describe these societal reactions to environmental problems or other societal problems.This concerns, for example, impacts like the effectiveness of programmes or measuresalike. An example for a response indicator in the area of climate protection is the volume of expendituresfor research projects concerning energy efficiency (Coehnen, 2000).The linkage of the defined aspects is broadly accepted by now and is widely used in the indicatormodels of the OECD and the European Environment Agency (Driving-Forces/Pressure/State/Impact/Response-(DPSIR) Models, EEA, 2005; OECD, 1993).
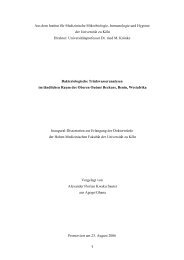
Development of scenarios IMPETUS 11II.1.2Szenarienentwicklung in IMPETUS / Development of scenarios inIMPETUSAt the beginning of the 2nd phase of IMPETUS basic methodical questions were clarified, likefor example the division of the research area into scenario regions, the scaling of these areas andthe development of a consistent approach for the creation of the scenarios (Fig. II.1-1). This stepof analysis was based on an extensive literature review.Afterwards, the main characteristics and scales of the scenarios were defined. The selection ofindicators and main driving forces occurred in a next step. This was followed by a broad qualitativeanalysis: on the one hand the indicators and driving forces were qualitatively described. Resultswere compiled in form of a qualitative trend-matrix (Tab. II.1.1). On the other hand, thestorylines for different scenarios were developed (see section II.2). The quantification of drivingforces and indicators with the help of different models took place within problem clusters thathave been defined by the IMPETUS partners. The consultation and participation of stakeholdershas been a constant feature of the whole process (see section II.1.4).In the following chapters we will briefly discuss the present state of work first before describinginto detail the outstanding research needs. They refer in particular to the assessment of problemsolutions and the analysis of impacts of certain measures in intervention scenarios.1 Problem-Analysis2 Basic definitions of scenarios(e.g. characteristics, scales)3 Determination of driving forcesand indicatorsProblemclusters4 Qualitative description ofindicators and driving forcesQualitative AnalysisQuantitative Analysis5 Quantificationa) of driving forcesb) of indicators by models4 Development of storylinesStakeholder consultation6 Intervention Scenarios7 Assessment(economic, ecologic)Fig. II.1-1:Overview of the scenario development process in the IMPETUS project
12IMPETUS Development of scenariosTab. II.1.1:Extract of the qualitative trend-matrix of Morocco. Presented are qualitative developments of a totalof 80 variables for three scenarios (M1-M3) and three regions (Fig. II.1.1). ’+’ means that the describedvariable will increase, ’-’it that it will decrease. The number of plus or minuses announcesthe intensity of change.Scenario M1 M2 M3Driving forces andindicatorsHighAtlasOZZBasinOasesHighAtlasOZZBasinOasesHighAtlasOZZBasinPopulation dynamicsPopulation (absolute) 0 + 0 + ++ + + ++ +Natural populationgrowth (without migration,absolute) + + + + + + ++ ++ ++Emigration ++ ++ +++ 0 0 0 + + ++Immigration 0 + 0 0 + 0 0 + 0Urban population n.a. +++ ++ n.a. +++ ++ n.a. ++ +Infant mortality ++ 0 ++ -- - -- + 0 +OasesInstitutional changetraditional water management(importance) 0 -- -- + + + 0 -- -public water management(importance) n.a. - - + ++ ++ n.a. 0 0Contents of scenariosThe storylines describe the following main thematic issues:• main economic development• development in the agricultural sector• development of political framework conditions• demographic development / life quality• environment / natural resourcesBasically three different scenarios are developed that follow different basic logics. The aim wasto cover a broad spectrum of possible developments. Therefore, two scenarios were developedthat reflect more extreme, yet realistic development paths whereas the third scenario was constructedas a business-as-usual scenario. The related storylines are fully represented in chapterII.2.Climate is not an explicit thematic issue described in the above mentioned storylines. Instead wedefined 3 climate reference scenarios for each catchment (see chapter II.3) which serve as externaldrivers of the more general scenarios (see chapter II.2). This procedure allows for a moreflexible combination of the two types of scenarios. We took into account both information ongreenhouse gas emissions (based on the IPCC-SRES scenarios) and on land use changes (FAO).In the following chapters meaningful summaries are presented.
Development of scenarios IMPETUS 13BeninScenario B1 “Economic growth and consolidation of decentralization” describes a scenario ofpolitical stability and economic growth. Living conditions of the population improve and theoverall pressure of resource depletion decreases due to technical innovations.Scenario B2 “Economic stagnation and institutional insecurity” sketches a development path ofa continuing and mutually influencing spiral of political destabilisation and economic depression.Declining world market prices for the main export products, decreasing grants of donorassistance and declining rates of regional and local economic cooperation lead to a negativeoverall economic development which undermines also the political stability of the country. Livingconditions worsen or stagnate on a low level. Resource depletion and resulting conflicts increase.Scenario B3 “Business as usual” extrapolates the current trends. Against this background economicdevelopment and social welfare does not increase in general. The country is successful inmaintaining its political stability but fails in improving its position on the world markets and itsoverall competitiveness. Population growth continues to decline and the traditional power structureson the local level remain rather unchanged.MoroccoIn Scenario M1 “Marginalisation – non-support of the Drâa-Region” governmental and internationalinstitutions withdraw their support. As a result, the marginalisation of the region and theimpoverishment of the local population accelerate.Scenario M2 “Rural development in the Drâa-Region through regional funds” is a constant economicgrowth scenario. Against the background of overall political stability and supported bygovernmental aid programs, under-developed regions like the Drâa-Region experience an improvementof overall living conditions and economic development, too. As a results, migrationdeclines and the population increases.Scenario M3 “Business as usual” extrapolates the dominant trends of past decades. The status asa marginalised region remains unchanged and only incremental improvements in the overall livingconditions and economic development occur.
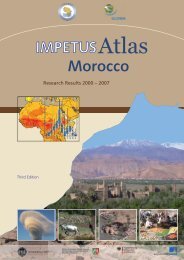
14IMPETUS Development of scenariosII.1.3Skalen der Szenarien / Scales of scenariosWe divided the regions of the catchments into homogenous sub-regions that differ regarding themain driving forces. The construction of sub-regions considers:• administrative boundaries• demographic framework conditions• economic framework conditions• natural framework conditionsIn the research area in Benin, which covers most of catchment area of the Ouémé river, we distinguishthe following three scenario sub-regions.• Higher-Ouémé: This sub-region can be characterized as a rural region with a low populationdensity and only one rain period.• Middle-Ouémé: This sub-region is also a rural region and the southern border of transhumance.• Lower-Ouémé: This sub-region, in contrast, is characterised by a well-developed infrastructureand shows a high rate of urbanization that goes hand in hand with a high populationdensity. There are two rain periods.In the research area in Morocco, the upper Drâa valley till Lake Iriki, we distinguish the followingthree scenario regions:• High Atlas: This sub-region can be characterised as a marginalised mountain region witha poorly developed infrastructure. Water availability is, however, relatively good and isthus only a weak limiting factor for agricultural production.• Basin of Ouarzazate: The good water availability is a specific feature of this sub-regionthat is also characterised by a well-developed infrastructure and strong urban centresOuarzazate, Boumalne Dadès, Kalaat M'gouna, Taznakht and Tinghir.• Oases southern of Mansour Eddahbi Dam: Low water availability is a main impedimentfor economic development is this sub-region. Agriculture is dependent on the managementof the Mansour Eddahbi dam.The temporal resolution is 5 years. The target year is 2025 and 2020 for Benin and Morocco,respectively. This choice is motivated by pre-existing longterm strategy papers of local governments(Bénin 2025: ALAFIA, Stratégies de développement du Bénin à long terme, Minist. deCoord. Plan. Devel. Empl., PNUD (2000); Stratégie 2020 de développement rural, Document deRéference; Conseil Général du Développement Agricole au Maroc, (1999)).
Development of scenarios IMPETUS 15a) b)Fig. II.1-2:Scenario regions: a) Benin b) MoroccoII.1.4 Einbeziehung der „Stakeholder“ in die Entwicklung der Szenarien /Integration of stakeholder into the develoment of scenariosParticipation of societal actors plays an important role in the development of scenarios. On theone hand this helps us to create scenarios that are up to date; on the other hand it prevents usfrom making mistakes due to incorrect or insufficient information or a wrong interpretation ofdata, which can put the whole analysis into question.The scenarios have been developed in close cooperation with local stakeholders of the researcharea. A review of basic scenario assumptions and verification of scenario results was undertakenin meetings of the so-called “Comité de Pilotage”. The continuous participation of stakeholdersin such steering committees is necessary throughout the remaining project process, for severalreasons: This is needed for the definition of right and useful intervention scenarios, for makingsure that interesting and important political decisions can be tested and for securing that scenarioresults are properly diffused into decision and strategy/planning processes.II.1.5 Zukünftige Arbeitsschritte / Future work stepsThe chosen approach of scenario development has proved its functionality. We managed to developwell-founded and plausible scenarios in the second project phase that are well-suited toassess the bandwidth of possible societal, economic and ecological development in Benin andMorocco.
16IMPETUS Development of scenariosFor each problem cluster (see chapter III) there is a clear-defined concept for embedding the scenarios.Quantification of scenarios in the problem clusters has been accomplished for singleproblem-clusters and will be accomplished shortly for the remaining problem clusters.It is foreseen to use the third phase of the project especially for assessing impacts of specific programmesand measures under different framework conditions. This will be done with the help ofintervention scenarios which are the next step in the order of scenario development. They arenecessary insofar as they link the conceptual scenario development and scenario analysis withthe generation of relevant policy advice. They inform about possible impacts of certain programmesunder certain framework conditions. Thus they reduce uncertainties for political decision-making.They are an important feature of the envisaged Decision-Support-System.Intervention scenarios will be run in all problem clusters. However, it is necessary to distinguishbetween those intervention scenarios that affect all problem clusters and those intervention scenariosthat only affect specific policies, programmes and measures. The latter are only relevantfor certain problem clusters. The first category of intervention scenarios comprises general interventionslike civil wars in neighbour countries that might trigger large migration. The secondcategory of intervention scenarios comprises specific interventions like the introduction of newsalt tolerant plants in the Drâa Oases. These scenarios are only defined for problem clusters ofrelevance. The descriptions of the single problem clusters contain further examples of interventionscenarios.This step of analysis generates a broad data basis for the final economic and ecological evaluationof possible measures in Benin and Morocco. It is intended to provide relevant political decision-makersand societal actors with relevant project results. These should also be part of theintended decision-support-system. In the end these activities should support the capacitybuildingin the region. This concerns the further diffusion of the methods of scenario analysis aswell, which can be utilised in other decision-making processes.Furthermore it remains to be analysed whether the results of IMPETUS can be fruitfully utilisedin other processes of scenario development in Africa. For example, the existing scenarios forAfrica of the Global Environmental Outlook of UNEP are currently refined, with a view tostrengthen regional analysis. The results of IMPETUS can support the regionalisation of globalscenarios on the one hand. On the other hand data and assumptions of the GEO-scenarios can beused to validate the assumptions of the intervention scenarios in IMPETUS.
Development of scenarios IMPETUS 17II.2Allgemeine Szenarien / General scenariosII.2.1Tab. II.2.1:BeninCharacteristics of the scenarios for Beninscenario B1:Economic growth and consolidationof decentralisationscenario B2:Economic stagnation andinstitutional insecurityDevelopment of main economic framework conditions• Constant growth• Deepening of international competitiveness• Growing importance of industrialsectors• Consolidation of the role as atransit countryDevelopments within the agriculture sector• Increasing rate of technical andorganizational innovations• Expansion of agriculture areas• Increasing rates of processing ofagricultural products• Increases in exportsDevelopment of political framework conditions• Political stabilisation; decentralizedadministrative structuresperform well• Development cooperation continues• Foreign investments increase• Economic stagnation• Decoupling of global markets• Decreasing incomes• Loss of international competitiveness• Loss of the role as an importanttransit country• Missing innovations• Stagnation of productivity• Expansion of agricultureareas• Increasing importance ofsubsistence farmingDevelopment of demographic framework conditions / live quality• Accelerated decline of populationgrowth• Growth of regional cities (workingmigration)• Improvement of living conditions• Rise in overall level of educationEnvironment and resources• Management strategies are implemented• Resource conflicts decline• Water use increasesscenario B3:Business as usual• Strong informal and weak formaleconomic integration• Low competitiveness on world markets• Low rate of innovations• Expansion of agriculture areas andlivestock farming• Political destabilization • Established societal power structures• Dysfunctional decentralized prevailadministrative structures • Development cooperation continues,• Increasing societal conflicts but with a main focus on poverty reduction• Benin loses the status as amain target country for developmentcooperation• Slow decline of populationgrowth• Deterioration of living conditions• Continued decline of populationgrowth• Growth of regional cities• •Migration into foreign countries• Slight improvement in covering ofbasic needs, but no comprehensivesupply with elementary basis goods• Weak resource management • Resource conflicts due to shortages• Uncontrolled exploitation • Continued resource managementand use of resources• Resource conflicts prevail
18IMPETUS Development of scenariosStoryline for the scenario B1: Economic growth and consolidation of decentralisationI. Common trendsThis scenario assumes a stable economic development. The country manages to improve its economicprosperity and integration. Political stability deepens. Standards of living in many parts ofBenin change for the better. The pressure on natural resources decreases due to technical innovations.II. Trends according to issues and regionsDevelopment of main economic framework conditionsForeign direct investment increases in the context of the UEMOA and new marketing opportunitieson regional markets are developed. Traffic infrastructure is extended; Benin strengthens itsrole as transit country. Positive economic growth impulses result from the admission into HIPCand AGOA. Continuity regarding the coupling of CFA with the Euro leads to a high monetarystability. The country succeeds in improving its competitive position on international markets.Export revenues continue to be generated by the agriculture sector, the export of raw productsand the export of processed products. The processing of agriculture primary products increase;so does subsequently the industry share of the GDP. However, agriculture maintains its key positionin the country’s economy. Transfers from development cooperation remain largely unchanged.More ‚public private partnerships’ are developed.Expansion of road networks in Upper-Ouémé is financed through transfers from developmentcooperation. Thus, access to and marketing opportunities in regional and local markets changefor the better. New road networks which are also financed through transfers from developmentcooperation lower the pressure that lasts on the existing road networks in Lower-Ouémé.Developments within agricultureInnovation rates in the agricultural sector increase and agriculture areas expand in total. Worldmarket prices for major export products remain on a stable low level. Thus, the crisis of the cottonproducing industry continues. Institutional innovations regarding the organisation of agriculturalfarms, their distribution channels and technical innovations regarding the processing of agriculturalproducts enable a diversification of production strategies and an expansion of the productrange. Technical innovations, like mechanisation, the use of draft animals and the increasedutilisation of fertiliser increase productivity further. The agricultural sectors wins market sharesin regional markets and increases its export rates.The processing of agricultural primary products leads to added value.State support guarantees a continuation of cotton and cashew cultivation in Upper-Ouémé despiteof low world market prices. Land uptake of agriculture increases; new agricultural areas aredeveloped. More and more draft animals are used. Livestock husbandry is intensified throughtargeted management of animal feeding. Yams crops are kept in the region with the help ofboosted fertilisation.
Development of scenarios IMPETUS 19Contrary, agricultural areas are extended only marginally in Middle-Ouémé. Fruit-growing isexpanded in addition to the intensification of the cotton- and cashew production. Agriculturalproduction is intensified.Declining world market prices for palm-oil causes a reduction of plantation farming and a reductionof cultivation of mono-cultures in Lower-Ouémé. In contrast the profitability of small animalhusbandry and fruit- and vegetables growing improves. The main reason therefore is theraised demand in the cities. Fruits- and vegetables cultivation experience further reinvigorationthrough transfers from development cooperation. Through this the share of irrigated water areasfor fruit and vegetables production ascends, however, the proportion of agriculture areas in relationto the total area remains constant.Development of political framework conditionsAdministrative reforms which have been started in the context of democratisation and decentralisationshow first results. Especially measures of anti-corruption, better access to information anda stronger public control of political decision-makers result in a reduction of the abuse of authorityand crime. But continuing cash inflow from development cooperation and increased revenuesdue to the positive economic development are relevant in this context, too. The CADER is demonopolisedand takes over the role of funding local initiatives. However, the traditional powerstructures and the related problems of overlapping political competencies do not change.The participation of civil society representatives stagnates due to the improved living conditionsof the population. People do no longer have to lobby with the same intensity for satisfaction oftheir main basic needs.The enduring internal political stability leads to a continuation of international development cooperation.Benin is able to close several international treaties of cooperation. An increase offunds from development cooperation stabilises the expansion of water and energy supply, canalisation,transport infrastructure and education.Development of demographic framework conditions / live qualityThe population growth declines much faster than it was originally expected. This is caused bylower fertility rates and a stronger integration of women into the labour market. Temporaryworking migration from Togo grows. Middle size cities are attractive destinations for migration,their population increases accordingly.In Higher- and Middle-Ouémé population grows because of the immigration from the northernregions. Better living conditions trigger a reduction of temporary working migration. More jobsare created in the processing industry in Middle-Ouémé.In Lower-Ouémé there is a stronger spread of urban sprawl, especially a growth of the sub-urbancentres. These centres are in particular attractive due to their infrastructure and working opportunities.The quality of life increases in many regions. Basic supply with water, food and energy, but alsowith education and security improves in the cities as well as in rural areas. Accordingly, the levelof education rises. The strongest growth rates happen in Upper-Ouémé, but this region has, how-
20IMPETUS Development of scenariosever, also the lowest starting level. More and more people succeed in improving their basic livingconditions. This leads to a reduction of epidemics.Environment and resourcesProgress in the agricultural sector, better education and specialisation of the work force and theimprovement of living standards cause a decline in the exploitation of natural resources. Bettercapacities for a more effective, broader resource management are developed and the societalconflicts about scarce resources diminish. Forest protection and management gain higher importance.The national water strategies (PADEAR) are implemented and improve water supply. Thewater use boosts in all sectors, especially in cities. This is due to improvements with regards tothe access to water infrastructure and the growing material wealth which results in a strongerwater demand for laundry, food preparation and so on. The illegal timber industry is decliningdue to the continuing expansion of agriculture areas and better administrative controls. Reforestationmeasures become more lucrative and are therefore more often executed.Storyline for the scenario B2: Economic stagnation and institutional insecurityI. Common trendsThis scenario assumes a continuing and mutually influencing spiral of political destabilisationand economic depression. Declining world market prices for the main export products, decreasingsupport from development cooperation and declining rates of regional and local economiccooperation lead to a negative overall economic development. This undermines also the politicalstability of the country. Living conditions worsen or stagnate on a low level. Resource depletionand resulting conflicts increase.II. Trends according to issues and regionsDevelopment of main economic framework conditionsDeclining world market prices for the main export products like cotton lead to a decrease of exportrevenues. The resulting shortage of foreign currencies prohibits a continuation of supportprograms for the private sector, especially regarding the modernisation of companies and farms.Technical progress and economic growth stagnate. The international competitiveness of thecountry drops and inflation increases. The economy of Benin disconnects more and more fromthe international markets. Processes of intraregional economic integration with neighbour countriesfail on a large scale. Nigeria closes its boarders with the effect that the transit transportcomes to a stop. Markets in the neighbour countries with open boarders cannot be deliveredproperly which propels further economic downturn. Regional economic cooperation runs dry.Accordingly, the average incomes of the population decline.In Middle-Ouémé the transit volume drops due to which the incomes from trade with the villageslocated at the main road decline.In Lower-Ouémé the port as a regional important economic factor is weakened. This loss is especiallycaused by the weak economic development and the weakening of the overseas importandexport business. Changing of business location to Apapa did not stand the test and triggers a
Development of scenarios IMPETUS 21large relocation of automobile trade to Lomé (Togo). Insufficient capacities for complying withinternational norms and standards contribute to the economic unattractiveness of the port.Developments within agricultureAgriculture maintains its role as the main source of income and employment. However, innovationrates are low and productivity declines. The farmers try to compensate this development byexpanding the agriculture areas. Subsistent farming gains also importance due to the limited agriculturalmodernisation and the coexistent instability of alternative employment strategies.However, the extensive production systems cannot cope with the increasing pressure from differentland use patterns. The soils are exposed to increasing degradation and erosion resultinginto decreasing yields. Also the decrease of forest aggravates the erosion problems. The abandonmentof measures for resource protection contributes to this development.These problems get worse in High-Ouémé due to missing capital for the targeted acquisition offertilizer and seeds, the absence of draft animals and other technologies, but also the bad qualityof agricultural advisory services. The stagnation of infrastructure development causes a worseningof access conditions for farmers to markets. Labour force demand is met by greater rates ofimmigration.Extending the agricultural area does not really help to tackle the problem of scarce suitable agriculturalareas in Middle-Ouémé. The additional need for workers is thus low.Also in Lower-Ouémé remaining forest areas are converted into agricultural crop land. The remainingplantations for palm oil become obsolete.Development of political framework conditionsThe worsening of living conditions leads to civil uproar which triggers an increasing politicaldestabilisation of the country. Due to the growing corruption within the administration, legalrelationships become insecure and the credibility and trust into public administration is shattered.As a result, international donors withdraw their support arguing that the international standardsof development cooperation are no longer fulfilled. Consequently Benin looses its status as amain focus country of international development cooperation. Turmoil partially turns into violentconflicts, which are also motivated by the scarcity of natural resources like clean water and fertilesoils.Decentralised administrative structures prove to be dysfunctional. Missing capacities and susceptibilityto corruption prevent a sufficient implementation of policies and programmes. Politicalparties and administration loose public trust and watch helplessly the rate of conflicts increase.Non-governmental organisations gain importance. Also the individual civil engagement becomesmore and more important.Regional differences cannot be identified for this thematic issue.Development of demographic framework conditions / live qualityThe general population growth slows down marginally. Especially in rural areas, mortality increasesin crisis years. Reasons are the lack of food, worsening of water quality, lack of healthinstitutions and the spread of epidemics. Aids, Malaria and plagues become more frequent.
22IMPETUS Development of scenariosThe availability of agriculture areas and the demand for workers in this sector turn Upper-Ouéméinto an attractive target for migrants from other regions that are characterised by scarcity of agricultureareas. The growing demand for family workers derogates the success of the family planningprogrammes which contributed to the decrease of the population growth. The rate of childmortality is high due to insufficient basic medical treatment. This leads to an increase of the birthrate. The regional population in Upper-Ouémé grows, also due to immigration, both internallyand from neighbour countries. The strong demand for agricultural workers and the lack of alternativesin cities slow down the urbanisation of the region.However, growth rates in Middle-Ouémé are falling. The balance of migration is even - the regionno longer is an attractive target for immigration. Migration into the neighbour countriesNigeria, Togo and Ivory Coast, but also into Europe proliferates.There is a similar picture in Lower-Ouémé. But the rate of emigration is higher due to the scarcityof agricultural areas. Medium sized cities also grow faster. Target regions for migration areespecially Upper-Ouémé and Nigeria.Quality of life declines in all regions. The degradation of natural resources, the decline of developmentcooperation and growing conflicts reduce the capability of wider parts of the populationto respond effectively to crises. The supply in areas like medical care, education, energy, waterand food is inadequate. Local authorities cannot ensure resources for maintaining the infrastructure.Economic activities are reduced to satisfying basic needs in many regions. More and morechildren don’t go to school but have to work. Migration of children increases as a result. Alsoreligious conflicts intensify.Environment and resourcesThe increase pressure on natural resources triggers conflicts between different users about scarceresources. This holds especially true for Upper-Ouémé. Here conflicts arise especially betweenlivestock farmers and crop producers. In Middle-Ouémé the conflicts rise between autochthonsand immigrants. In Lower-Ouémé the conflicts concerns agriculture and housing development.In all regions uncontrolled processes of land use lead to deforestation. This aggravates processesof soil degradation. Water use does not really change. Unclear legal ownership structures facilitatean uncontrolled uptake of land and trigger related conflicts between different user groups.The administration is not able to secure a functioning resource management due to missing capacities(personal, financial resources, legitimacy, and political support). Accordingly they arealso not able to moderate user conflicts. These deficits are apparent in all areas, from the forestprotection over water protection to protection against erosion.
Development of scenarios IMPETUS 23Storyline for the scenario B3: Business as usualI. Common trendsThis scenario extrapolates the dominant trends of past decades. There is no general increase ofeconomic development and social welfare. The country is successful in maintaining its politicalstability but fails in improving its position on the world markets and its overall competitiveness.Population growth continues to decline and the traditional power structures on the local levelremain unchanged.II. Trends according to issues and regionsDevelopment of main economic framework conditionsAgriculture maintains its role as the key economic sector; industry and service do not reallygrow. At the same time, regional export stays on a low level and is subject to strong fluctuations.Informal economic activities gain importance, especially for securing individual livelihood. Fueland car smuggling becomes more important, although the whole automotive trade is relocated toLomé (Togo).Thus, creating sustainable grounds for a secure economic development fails. The country remainsdependent on the revenues from informal transit export and export of agricultural goods,which are subject to strong price fluctuations on world markets. The trade deficit remains andmore new public debts are made. Processes of regional economic cooperation are not really furthered.Developments within agricultureAgriculture maintains its role as the key economic sector. Agriculture areas and livestock farmingare extended. However, rise in agricultural outputs turn out lower than expected due to lowerinnovation rates. Intensive livestock farming gains importance in all regions. But the importanceof an organised creation of value according to the concept of the Filière for Cassava increases,too.In Upper-Ouémé agricultural areas of cashew, cassava, yams and mice are moderately extended,thus enabling according rise of output. We assume furthermore an intensification of productionthrough increased appliance of fertiliser and pesticides and a continuing mechanisation. An importantinfluence has been ascribed to the increasing monetarisation of rights of disposal forland. Due to decreasing world market prices the production of cotton is not becoming competitive.Extension of agricultural areas increases strongly in Middle-Ouémé. The main beneficiary is thecultivation of cassava. However, the fragmentation of land due to partition continues.The development in Lower-Ouémé is really different, since the agriculture area is not extended.A stronger differentiation of the production of single plants takes place (pineapple, teak, vegetables).Former areas for the production of oil palms are converted into production areas for maizeand cassava. The already widespread use of fertiliser and pesticides is increased once more. The
24IMPETUS Development of scenariosfragmentation of agricultural areas through partition, but also through speculation, takes placealso in this region.Development of political framework conditionsEstablished power structures remain constant in the decentralised administrative units. Localstructures between policy-makers and clients continue to exist. New actors like nongovernmentalorganisations enter the stage in all regions. The number of non-governmental organisationsincreases. But this does not automatically lead to an upgrade of their political influence.New responsibilities, and subsequently new actors, are also created in local administration.New responsibilities partly overlap, according to the policy area which creates a competitionbetween decision-makers in the old and new political arenas. Ineffective administrative structuresare the result, especially on the lower administrative levels.Administration is not very effective in all three regions. But there are continuous efforts to improvethe efficiency of administration.International development cooperation maintains its substantial importance and has a strong impactonto all economic sectors. Fighting poverty becomes a leitmotif of international developmentcooperation. Allocation of financial resources is increased and a stronger cooperation betweenall organisations results in an increased outflow of resources.Development of demographic framework conditions / live qualityThe general population growth declines further. However, population grows in the medium-sizedcities. At the same time more and more workers are migration into neighbour countries. Medicalcare is improved and the rates of child mortality, postnatal mortality and malaria infections declineslightly. They are on a high level, nonetheless. In none of the three regions is it possible tofully satisfy basic needs of the population (water, energy, medical care, education).Within Benin the Upper-Ouémé is the most important target region for migration, mainly bypeasants coming from Middle- and Lower-Ouémé. This form of inter-rural migration continueswithin the Upper-Ouémé. Accordingly, population in this region grows stronger than in the twoother regions.Environment and resourcesAn increased scarcity of resources can be observed in all three regions. This triggers conflictsbetween different user groups. However, programmes for resource protection are continues, likefor example water management programs like the PADEAR or forest protection programs likePAMF. Water use grows in private households, but stays constant in industry and agriculture.Especially in rural areas the water management remains insufficient.In a regional perspective water use increases in Lower-Ouémé. This is caused by stronger urbanisation.Resource conflicts between crop farmers and livestock farmers continue to exist.
Development of scenarios IMPETUS 25II.2.2MoroccoTab. II.2.2:Characteristics of scenariosscenario M1:Marginalisation – non-supportof the Drâa-Regionscenario M2:Rural development in the Drâa-Region through regional fundsDevelopment of main economic framework conditions• Region does not profit fromeconomic upswing• Industry remains marginal• Tourism stagnates• Agriculture dominatesDevelopments within the agriculture sector• Share of agriculture areas inrelation to the total area doesnot really change• Productivity of agricultureareas remains low• Cash-Crops loose importance• Number of animals in livestockfarming stays constant• Programs for„self-aid• Strong growth of tourism• Dominance of agricultureDevelopment of political framework conditions• Support programs are cut-back• Traditional mechanisms ofdecision-making gain importanceat local level• Support of agriculture innovations• Increase of productivity• Cash-Crops are produced forthe regional market• Reduction of number of animalsin livestock farming• Intensification of support programs(Strategie 2020)• Up-valuation of local administrationDevelopment of demographic framework conditions / live quality• Increased rates of migration• Demographic polarisation• Living standards worsenEnvironment and resources• Privatisation of water supply –increasing water prices• Energy costs rise => increaseduse of natural resources• Insufficient resource management• Decrease of migration due toalternative income possibilities• Living standards improvescenario M3:Business as usual• Low level of industrialisation• Individual tourism is restricted on afew areas• Dominance of agriculture• Share of agriculture areas in relationto the total area stays constant• Low innovation rates in agriculture• Number of animals in livestockfarming stays constant• Support programs are focused ontourism• Societal change - dualism• of official and traditional local administration• high rates of migration and childhoodmortality• Strong growth of population• Urbanisation expands• Education opportunities improve• Infrastructure is further extended(Pipelines for water sup-• Water scarcity constraints expan-• Higher energy costsply)sion of agriculture areas• Construction of sewage treatmentplants in cities• Use of renewable energies (=>landscape protection)• Energy costs increase
26IMPETUS Development of scenariosStoryline for scenario M1: Marginalisation- non-support of the Drâa-RegionI. Common trendsMorocco experiences an economic boom, but it has no positive consequences for the Drâaregion.Governmental and international institutions withdraw their support. Financial support isconcentrated in other regions. As a result, the marginalisation of the region and the impoverishmentof the local population accelerate. Especially young people migrate causing a demographicpolarisation. The pressure on natural resources and the environment grows.II. Trends according to issues and regionsDevelopment of political framework conditionsMorocco is a constitutional monarchy. The King has vast executive powers; the parliament hasan advisory function; Legislative and executive are strongly centralised.The government concentrates their economic support in regions where it expects a higher efficiencyof funding. Support is granted for the industrial sector, the service sector and the agriculturalsector especially in the coastal areas and in optimum areas for agriculture. The Drâa-regionis neglected and largely exempted from funding. Consequently, the marginalisation of the regioncontinues.Due to withdrawal of governmental support the traditional decision processes gain importance.Traditional law systems are remained and strengthened. However, the potential for conflictsrises, because individualisation of economic actions grows at the expense of community solidarity.Institutions to support rural development close down, because they receive no monetary support.Development of main economic framework conditionsThe economic integration of global markets for capital, goods and services proceeds. Processesof uncontrolled globalisation strengthen economic growth in Morocco. The Drâa-region does notbenefit from this development, however: It is unattractive for investors due to the underdevelopedinfrastructure and the low degree of industrialisation.Existing differences between urban and rural regions, between growth areas and marginalisedareas deepen as a result of this policy. Public funding agencies withdraw their engagement on alarge scale, which leads to further marginalisation and pauperisation of the region. Economicgrowth looses further momentum, investments into the infrastructure cannot be maintained andaccordingly, the infrastructure lapses. As a consequence, more and more people leave the region,especially young men.The industrial sector stays marginal in the whole research area.In the High Atlas no industries settle down.The industrial sector looses importance also in the Ouarzazate Basin. Instead a small increase ofthe construction sector can be witnessed. Activities in the informal sector boost, above all.
Development of scenarios IMPETUS 27Also in the Oases, the informal sector is the only sector that grows, whereas the industry sectorstagnates on a low level.Tourism does not provide the basis for a sustained economic development. In the High Atlas,only trekking tourism as an economic niche becomes important, whereas in the Ouarzazate Basinthe decline of the infrastructure leads to a strong decrease of tourism. Desert tourism does notreally kick off in the Oases and thus stagnates on a low level.Developments within agricultureThe amount of agriculture areas stays largely constant and decreases sometimes. Productivityremains on a low level, technological progress is static (fertiliser, better adopted plants etc.). Resourcesfor research and agricultural advisory services are lacking. The production of cash-cropsis decreasing: they are neither competitive on the globalise world markets nor on other regionalmarkets. Foreign investments are not to be expected. The importance of the subsistence farmingcontinues.In the High Atlas the amount of agricultural areas remains constant. This is true for the importanceof subsistence farming due to lacking employment alternatives, either. The production ofcash-crops is reduced due to lacking resources for the purchasing of seed, fertiliser and pesticides.The bad infrastructure does not allow for a meaningful marketing.Existing systems of water supply and distribution are preserved. In Ouarzazate Basin the subsistencefarming decreases due to a lack of eligible workers. The size of farms increases, in parallelto the commercialisation of production. The intensity of production on the subsistence farmingareas is quite low. More staple foods are marketed. Investments into the existing systems of watersupply cannot be maintained. This development takes place in a similar format in the Oases.However, marketing opportunities are even worse here.Livestock remains relatively constant, but declines slightly in the south. Climatic frameworkconditions have a strong influence on the actual size of the livestock.Livestock farming in the High Atlas maintains shaped by transhumance, which is, however, not areal competitor for crop farming. In Ouarzazate Basin the livestock stays constant; imports ofproducts from other parts of the country and abroad increases in the urban areas. In the Oases thesedentarisation of nomads gains importance which results in a stronger pressure on grassland inthe nearer surrounding of communities, where livestock farming is intensified. The pressure decreasesalongside the distance to the communities. In the southern oases professional cattlebreeders replace local farmers.Development of demographic framework conditions / live qualityMigration grows – especially young men leave the region and move to the coastal cities or in theRegion West-Sahara. Because the migrants support their families, money transfers into the regionsincrease. But even the increased transfer rates only help to satisfy basic needs. Internationalmigration is aggravated through the restrictive immigration policy of the EU, which remainsthe main target region for migration. Migration leads to demographic polarisation, with astrong share of very young and quite old persons. Birth rates and rates of childhood mortalityremain high due to the insufficient implementation of health care and family planning programs.
28IMPETUS Development of scenariosIn the High Atlas the population stays on a high level. Emigration towards the economic centresand towards Ouarzazate increases strongly, but is compensated by a strong increase of birthrates. We witness high rates of migration also in the Ouarzazate Basin. However, this is partiallycompensated by internal migration. Immigration occurs especially from the High Atlas and fromthe south. In the Ouarzazate Basin urbanisation gets more importance and urban life styles areadopted by more and more people.Living conditions worsen due to shrinking public funding. It becomes more and more problematicto maintain the regional infrastructure for education and vocational training. Schools depraveand teachers are less motivated to work in this region. Costs for education rise strongly, aggravatingthe possibility for families to send their children to school. The level of education thusstays low, especially regarding girls. Schools that teach the Koran are more and more accessed.Environment and resourcesThe disposal of waste and waste water remains unregulated in all three regions causing manifoldenvironmental and health problems especially in urban centres. The privatisation of water supplycauses a strong increase of water prices which constraints the access to water for parts of thepopulation. But it is primarily the increase of energy prices that has the strongest consequences:the population starts to make increasingly use of local firewood which increases the pressure onthe natural vegetation. The set-up of nature reserves is less helpful, since it happens usually onlypro forma. It is easier for the government to set-up nature reserves in this area compared to thecoastal regions where tourism is supposed to be supported. The high energy prices increase theattractiveness of photovoltaic installations.Commercialisation and declining public interest trigger a worsening of water management, leadingto an uncontrolled and unsustainable use of groundwater. The competition between communitieson the upper and lower river regions implies a strong potential for conflicts.Water availability is not a problem in the High Atlas. But the supply with drinking water ismainly dependent on the initiatives of the local population because public programmes are not inplace. Forest impaction is, however, in a balance with the rate of natural renewal.In Ouarzazate Basin the interest of public agencies in a functional and targeted water managementis also marginal, despite the importance of the sector for sustainable regional development.Instead, the public agencies withdraw their engagement in water management. Efficiency of usein agriculture remains on the same level. Domestic water use rises. Costs for water extraction(water pumps) increase, mainly due to the rise of energy prices.In the Oases the northern and southern oases have to be distinguished. Water quality decreases inthe two southern oases due to lacking funding for infrastructure renewal. Higher energy costsimpose increased costs of water extraction in this region also.
Development of scenarios IMPETUS 29Storyline for scenario M2: Rural development in the Drâa-Region through regional fundsI. Common trendsScenario M2 “Rural development in the Drâa-Region through regional funds” sketches a scenarioof constant economic growth. Against the background of overall political stability and supportedby governmental aid programs, also under-developed regions like the Drâa-region experiencean improvement of overall living conditions and economic development. As a results, migrationdeclines and the population increases.II. Trends according to issues and regionsDevelopment of political framework conditionsSocietal stability deepens in the region in the context of an overall positive economic developmentin Morocco. Rural development and especially agriculture as the most important sector interms of production and employment have a top ranking on the political agenda. The strategy2020 is fully implemented. It foresees the support of regions like the Drâa-Region which areeconomically or due to environmental conditions disadvantaged. Accordingly, the ORMVA’s(Offices Régionales de Mise en Valeur Agricole) are strengthened. At the same time the responsibilityof users is increased which enhances the identification with the program and the effectivenessof implementation (MADPRM, 1999, S. 50). On the local level traditional institutionsand structures are used to advocate development programmes and implement planning processes.This results in a strengthening of local authorities, like the tribal elders (“quabila”), traditionalwater use organisations and rural supply organisations. They function as an intermediary betweeninternational organisations and national authorities that provide funding for the local authorities.Development of main economic framework conditionsThe economic integration of the global markets for capital, goods and services proceeds continuously.Globalisation triggers positive impulses for economic growth in Morocco. The countryprofits from the strengthened integration into the European markets. Agriculture is not only ableto export vegetables and citrus fruits into the European Union, but also into other regions. Furtherresource reservoirs are exploited.Revenues from export and capital from international development cooperation enable a targetedsupport of disadvantaged regions like the Drâa-Region. This allows for the financing of infrastructureprojects that improve overall living conditions and conditions for economic developmentin the region, like for example through the introduction of adapted cash crops and theirmarketing.New sectors are successfully developed, like for example the processing of agricultural goods.Traditional craftwork is supported. A targeted granting of small credits enables economic independencyand a strengthening of the position of women in society. This targeted support reducesthe dependency on general support schemes and on transfers from migrants.
30IMPETUS Development of scenariosHowever, there is no allocation of industry in the High Atlas. The initial conditions are simplytoo bad in this region.In the Ouarzazate Basin economic development concentrates on the extension of processing ofagricultural goods.The same development strategy applies to the Oases. Thus, the industrial processing gains moderategrowth dynamics. But structural deficits in economic development and the overall strongconcentration on agriculture remain and are not really solved.Tourism increases in all regions, mainly due to the extension of the infrastructure (streets andcommunication) and the support of regional tourism enterprises.In the High Atlas trekking tourism gains more importance leading to marginal improvements inincome possibilities for the local population. Additionally, a steered mass tourism around certainsightseeing objectives evolves. This concerns, for example, the Dades valleys. In the OuarzazateBasin the package tourism dominates. This form of tourism grows strongly and develops into animportant income source for the local population. The region benefits from the funding of regionaltourism agencies as well as from the targeted support for decentred tourism spots (Skoura,Keela).Desert expeditions and tourism gain importance in the Oases and diversify income sources forthe local population (Kasbah). Especially the two most southern Oases are expanded and turnedinto centres of attraction for tourists.Developments within agricultureNumber and average size of the farmed areas increases slightly. Also the productivity of intensiveagriculture rises, whereas the importance of subsistence farming is on the decline. Agrostructuralfunding supports the development of agricultural innovations, like for example thecultivation of salt-resistant crops or marketable cash-crops. Techniques for the improvement ofwater use efficiency are introduced. Regional development plans are set up for this purpose andimplemented in accordance with the provisions of the Strategy 2020.Cash crops are produced more and more for the regional markets in all three regions (intensificationand agricultural innovations). Differences relate to the development of the agricultural areas:In the High Atlas the number increases slightly whereas it stays constant in both other regions.The development in the Ouarzazate Basin and in den Oases is further characterised by a continuousmodernisation of production techniques, like salt-resistant plants, fertiliser or pesticides.Livestock is further reduced but nomadism as a main way of living and working is being kept byparts of the population. The development of the climate framework conditions has a strong influenceon the composition of the livestock.Livestock farming in the High Atlas is characterised by a smaller number of cattle per capita buta higher productivity and thus better income possibilities. Increases in productivity are mainlyreached through better access of breeders to cattle markets and through extending veterinarymedical services. The system of rotating pastures is strengthened which allows a more sustainablepasture management. In this system certain pastures are excluded from grazing for a certaintime.
Development of scenarios IMPETUS 31Intensive cattle’s farming becomes important in the Ouarzazate Basin. The transhumance livestockfarming continues to exist, like in the High Atlas, but looses importance.In the Oases, parts of the population stick to the nomadism. Livestock is shaped by the availabilityof biomass, i.e. the available grassland. For this purpose livestock farmers are controlled bypublic authorities with the help of pasture management.Development of demographic framework conditions / live qualityOverall living conditions improve due to alternative income opportunities, like for exampleavailability of incomes and satisfaction of basic needs. The migration rates declines. Educationalinstitutions, especially schools, are expanded through governmental support. Family planningprogrammes are run in parallel and show first positive results, facilitated through increased literacyrates and a better adaptation to local demands. Improved hygienic conditions and a goodaccess to medical care result in a decline of childhood mortality and lead to an increase of thepopulation. The declining number of migrants has to be considered, too, in this context. Thegovernment is eager to develop and institutionalise vocational training, focusing on technicaljobs, tourism and handcraft. At the same time investments are made into educating farmers inorder to increase their adaptation potential in the context of global environmental change (capacitybuilding). The support schemes also simplify the access of women and girls to educationaloffers.Better hygienic conditions, supply with water, energy, food, housing and medical care, but alsothe increased educational levels and the success of the family planning programs lead to an increaseof the population in the High Atlas, partly brought forward by a decline in migration. Inthe Ouarzazate Basin, urbanisation increases also with regard to medium-sized cities like Kelaa,Boumalne, etc. The trend towards smaller families is strengthened. They often constitute individualhouseholds and respond stronger to urban living traditions. A similar development is discoveredfor the Oases region.Environment and resourcesThe financial resources that are available through national support programs, international developmentcooperation and better economic development are specifically used for improving theinfrastructure and basic medical care. Asphalt streets are increasingly constructed and electricityand telephone networks are extended.The expansion of renewable energies is of major importance in this context. Wind turbines andphotovoltaic applications are especially installed in remote areas that are hard to access. Theypartially cover the electricity demand of the population. Costs of energy supply raise or burdenthe budgets of private households in newly connected communities at least. Bottled gas is increasinglyused for cooking, in addition to using electricity. Landscape protection is improvedand felling is declining in all three regions. This is due to the better infrastructure and the successfulawareness training of public and private organisations (as for example regarding the introductionof more efficient cookers).The use of diesel-powered motor pumps for agriculture production decreases in the oases. Electro-and solar pumps are more frequently used.
32IMPETUS Development of scenariosIn the High Atlas, public water management concentrates on exploiting drinking water fromswellings and wells. Pipelines are increasingly installed to cover the demand for drinking water.State-driven support for the expansion of these local networks is, however, linked to higher costsfor the local population.Demand for irrigation water is covered through public accessible surface water. Extraction is notfully unregulated, but is more influenced and regulated by traditional patters of societal decisionmaking.However, the disposal of waste and waste water happens in a rather unregulated way.However, waste levels are very low due to high rates of recycling.In the Ouarzazate Basin water management is oriented towards ensuring the supply with drinkingwater via pipelines. This generates high investment costs which have to be covered partiallyby the consumers, via the water price. To secure supply, an exploitation of deep wells and theimport of drinking water from the High Atlas are necessary. Wells become subject to a stricterpublic control. The demand for water for irrigation is covered through the construction of smallreservoirs, but the irrigation with surface water continues to follow the traditional structures.More treatment plants are constructed in the cities to cope with waste water disposal. Waste disposalremains constrained to landfills in the urban areas, whereas dumping waste takes place in arather uncontrolled way in the rural regions. The waste volumes grow strongly.In the Oases water management is developing along a similar path like the Ouarzazate Basin.The focus is on installing pipelines and constructing deep wells. However, this strategy is confrontedwith the rising costs. A distinction has to be made between the northern oasis and the twosouthern oases. The southern oases are confronted with real problems concerning salted groundwater. As a result long-distance pipelines for water supply have to be installed. Securing a sufficientwater supply gets more and more the attention of public agencies which implement relatedmeasures to improve the situation.Regarding the treatment of waste and waste waster treatment plants are constructed in urban centres(Zagora). Otherwise, disposal is functioning relatively unregulated.
Development of scenarios IMPETUS 33Storyline for scenario M3: Business as usualI. Common trendsScenario M3 "Business as usual" extrapolates the dominant trends of past decades. Economicdevelopment in whole Morocco shows a slight upturn. This positive development is, however,reflected only in some parts of our research area. The status as a marginalised region thus remainsunchanged and only incremental improvements in the overall living conditions and economicdevelopment occur, although national and internationally financed programs for improvingconditions in the health sector, drinking water supply and education are set up. These programshave a limited reach of coverage and are thus only limited successful.The agriculture sector remains the dominant sector and employs the majority of the population.II. Trends according to issues and regionsDevelopment of political framework conditionsMorocco is a constitutional monarchy. The King has vast executive powers; the parliament hasan advisory function. Legislative and executive are strongly centralised.The research area is characterised by a legal and institutional pluralism, especially in the ruralareas; traditional and public institutions and legal conceptions exist in parallel. The family structureis subject to important change. More and more people orientate their living styles no longertowards the extended family structure but towards a nuclear family structure. More householdsare led by women, since their husbands are living as working migrants in foreign countries.Nonetheless, the dualism of traditional institutions and local arbitration continues to exist as doesthe dualism of state controlled administration and local authorities.Development of main economic framework conditionsIndustrialisation and agricultural production, which is orientated towards the world markets,concern foremost the large coastal cities and the climatic favoured agricultural regions in Morocco.Here it is possible to produce at lower cost. Products can also be marketed more easilydue to better infrastructure. In the Drâa-Region only tourism benefits from the general economicupswing. The nearly fully absence of manufacturing and processing industries leads us to beliefthat global trends will not strongly influence developments in the Drâa-Region.Subsistence farming remains the most important economic sector. Cash crops (for example date)are produced solely for the regional or national markets. International competitive agriculturalproducts are not produced. Industry continues to be of low importance. This concerns also theagricultural industry sectors. Individual tourism that is concentrated on a few interesting spots(Kashbas, desert, trekking), increases solely. In this case public support is having effects. Infrastructureis further extended, with the help of national funding and international help programs.This concerns for example the domestic water supply. Infrastructure development occurs especiallyin tourism centres. Transport connections are improved accordingly. Service sectors gainimportance in the medium-sized cities that show a strong growth record. But especially the informalsector continues to grow strongly.
34IMPETUS Development of scenariosTrekking tourism stabilises on a low level in the High Atlas. Industry is not located in this region.In Ouarzazate Basin the processing of agricultural products (roses, safran) stagnates on a lowlevel. The services sector is strongly expanding in the urban centre of Ouarzazate, but also in themiddle centres of the area. This is partly influenced by the increasing investments into tourism.In the Oases money from international migrants is used for purchasing motor pumps which areincreasingly used for the production of Lucerne for local markets. The desert tourism in thesouth is the main beneficiary of the positive development in the tourism sector.Developments within agricultureDue to the continuing dominance of subsistence farming most farmers remain to be landowners,too. The agriculture area is not really expanded, mainly because farmers are constraint to irrigationfarming. Innovations in the agriculture concern improvements of seeds and a more effectiveuse of fertiliser and pesticides, which are funded by regional organisations (for example ORM-VAO). The mechanisation of agriculture does not really increase, too, mainly due to the manysmall parcels of irrigated land. Only the use of motor pumps improves. Traditional distributionmechanisms nonetheless dominate irrigated agriculture, although they loose importance in someregions as motor pumps promote individualisation. The enforcement of individual rights overcollective rights is more and more furthered with the help of jurisdiction which is perceived asexpensive and corrupt.In the High Atlas changes in the agriculture will remain marginally. Only cash-crop production(like apples) for local markets is expected to increase. Agriculture area cannot be extendedwidely, so that expansion takes place at the expense of areas for subsistence farming. Traditionalsystems of water distribution continue to dominate due to the geological conditions, but also dueto the better water availability and a lower diffusion of motor pumps. Livestock farming continuesto be shaped by transhumance which is not in a competition with crop farming. Domesticlivestock remain on a low level.In the Ouarzazate Basin the Cash-Crop production stagnates. Transhumant breeders becomecompetitors to livestock owners especially in the foreland of the Atlas. Agriculture productionimproves through the increase of migration; in addition the commercialisation of agriculture isdeepened.In the Oases the production and marketing of dates is declining, mainly because the date diseaseBayod is not sufficiently treated and prices for imported dates are quite low. Due to the increasednumber of working migrants and a change of values especially among young men a shortage ofthe workforce occurs, despite the general population growth. Abandonment of agriculture areasis the consequence.Development of demographic framework conditions / live qualityPopulation grows, driven by a high birth rate. Family planning programmes are implemented butare not really successful. Population growth is compensated by the strongly growing rates ofmigration towards the economic centres of Morocco and a relatively high rate of childhood mortality.The increased rate of working migration leads to manifold changes in the family struc-
Development of scenarios IMPETUS 35tures. An indicator is the increased number of household led by women. Modern, more urban lifeconcepts gain more importance, propelled by migration experiences, but also better educationwhich benefits especially girls. Urbanisation increases, also in the surroundings of medium-sizedcities. The construction of schools and hiring of more teachers improve education possibilities inall regions. However, the quality of education is fluctuating strongly. Especially in remote areasthere is a rather low motivation of teachers and subsequently a low quality of education.Due to the fact that there are no urban middle centres in the High Atlas urbanisation does notreally play a role here.In the Ouarzazate Basin the population grows stronger than in the whole area. This is due tohigher immigration. Ouarzazate strengthens its position as a regional centre. The infrastructure(school, medical care) is expanded especially in urban centres, which again increases the attractivenessof the region for migrants.Despite the improvements in the infrastructure working migration continues to increase in Oasesdue to the bad income opportunities. Zagora as a middle centre gains importance, and wins moreinhabitants.Environment and resourcesIn the rural regions in all three regions the waste and waste water disposal is not really clarified.Treatment plants are only installed in urban centres. Local waste disposal is restricted to the notenvironmental friendly disposal on landfills. Bottled gas will be broader diffused as energysource for cooking, leading to higher energy prices in all areas. Water scarcity is a constraint tothe expansion of agricultural areas in all three regions.The topography of the High Atlas prevents an expansion of agriculture areas, despite good wateravailability. Water supply is unproblematic, however, due to the good general quality of water. Astable balance between livestock and plant growth is kept on pastures. The withdrawal of firewoodstagnates and does not lead to a depletion of resources.Water availability is declining towards south. Urbanisation causes a strong increase of urbanwater demand in the Ouarzazate Basin. Problems with water supply aggravate in the west of theregion, mainly due to the increasing salinisation of soil layers that transport ground water. Bothin the Ouarzazate Basin but also in Oases public water management remains ineffective. Publicinitiated institutions like the AUEAs (“Associations d’Usagers d’Eau Agricole”) are not able toachieve acceptance. Individual investments in agriculture become widespread.The intensive use of water in upper reaches reduces the water availability in Oases. Individualirrigation with motor pumps leads to a loss of importance of traditional systems of water controland supply. A maximisation of use for agriculture purposes is implemented, leading into a visibledecline of ground water levels in the Drâa-region due to uncontrolled withdrawal. This trendis aggravated due to new agriculture areas in Fejja, which are irrigated with ground water. Overuseof ground water triggers a salinisation of the aquifers in the southern oases which are usedfor drinking water supply.
36IMPETUS Development of scenariosII.3Klimaszenarien / Climate scenariosBeninTab. II.3.1:Characteristics of the climate scenarios for BeninSzenario X Szenario Y Szenario ZUpper Ouémé• strong reduction in annualrainfall due tostronger wind convergenceat the coast andland degradation,• substantial warming,• stronger climate extremesMiddle Ouémé• moderate weakening ofthe hydrological cycledue to less evapotranspirationupstream (enhancedland use),• considerable warming,• stronger climate extremes• strong reduction in annualrainfall,• less heavy rain events,• delayed monsoon onset,• remarkable warming -particularly in summer,• slight weakening of thehydrological cycle,• slightly enhanced seasonality,• strong warming• land degradation andwarmer surface temperaturesin the IndianOcean maintain the below-normalprecipitationanomalies,• warming of 0,2°C perdecade,• land degradation andwarmer surface temperaturesin the IndianOcean maintain the below-normalprecipitationanomalies,• warming of 0,2°C perdecade,Lower Ouémé• enhanced precipitationdue to an intensifiedsummer monsoon circulationand latent heatfluxes over the Gulf ofGuinea,• moderate warming• strong reduction in annualrainfall and delayedonset,• less heavy rain events,• reduced climate seasonalityand earlier onset,• strong warming,• land degradation andwarmer surface temperaturesin the IndianOcean maintain the below-normalprecipitationanomalies,• warming of 0,2°C perdecade,
Development of scenarios IMPETUS 37Storyline for scenario X: Process understandingIn the frame work of IMPETUS our knowledge of the effect of global warming on the climate oftropical Africa has been broadened. Increasing greenhouse gas concentrations warm the tropicaloceans and thus induce far-reaching anomalies of the atmospheric circulation, of the spatial distributionof high-reaching cloud covers, and of convective precipitation events. This process understandingsuggests an increase of the meridional precipitation gradient over the sub-SaharanWest Africa. This is due to the fact that a warming of the tropical Atlantic, especially of the Gulfof Guinnee, is in general associated with an enhancement of the convenctive activity in thecoastal areas of West Africa and with drier conditions farther inland like in the Sudanian andSahel regions. In the coastal areas up to 200 km inland the water vapour source for precipitationis the nearby ocean. The resulting direct influence of higher sea surface temperatures is enhancedby the rain-producing land-sea breeze circulation. For Benin such a development means higherprecipitation amounts in the southern parts of the country until 2025 and drier conditions in theUpper Ouémé Valley. The latter is explained by the fact that the precipitating water vapour in theUpper Ouémé Valley has partly its origin from the evapotranspiration over the regions upstreamof the southwesterlies. We assume that the so-called “water vapour recycling” will be furtherreduced due to land use changes in the humid Guinnee coast areas. Furthermore we expect thathigher water vapour contents will increase the intensity of extreme rainfall events. Increasinggreenhouse gas concentrations in the atmosphere and the warming of the oceans will also lead towarmer surface temperatures over land. An additional warming over the northern parts of thecountry is to be expected from reduced precipitation and evaporation. As a consequence solarradiation is transformed to a higher degree into sensible heat. Higher temperatures during thedry- and rainy season will enhance the saisonal drying of the soils and the water stress on plantsduring dry episodes in the course of the rainy season.This process-understanding scenario does not take into account teleconnections (e.g. El Niño/Southern Oscillation) or complex non-linear interactions within the climate system.Storyline for scenario Y: Climate model predictionFor a realistic assessment of the climatic development unitl 2025, complex scenarios were developpedin IMPETUS and used as a forcing for different climate models. Both increasinggreenhouse gas concentrations and progressive land use changes were taken into account. Theincrease of the greenhouse gas effect is based on the estimations of the IPCC (IntergovernmentalPanel on Climate Change). The so-called B2 emission scenario was chosen that describes aworld in which the emphasis is on local solutions to economic, social, and environmental sustainability.It is a world with continuously increasing population at a rate lower than A2, intermediatelevels of economic development, and less rapid and more diverse technological changethan in the B1 and A1 storylines. While the scenario is oriented toward environmental protectionand social equity, it focuses on local and regional levels. The land use change scenario comprisesan increasing destruction of the original vegetation cover and thus the soil degradation. Thegreenhouse gas induced warming of the tropical oceans and changes of the atmospheric circulationfrom a global climate model are used as a forcing at the boundaries of a regional climate
38IMPETUS Development of scenariosmodel. Recent studies show that regional climate models using a combination of greenhouse gasand land use scenarios can give reasonable simulations of future climate in Africa. Results forthe target year 2025 show a reduction of the annual precipitation averaged over Benin. There is,however, a regional difference with clearly reduced precipitations in the coastal areas and in theUpper Ouémé Valley, whereas in Central Benin slightly more humid conditions are expected.The trend towrd a drier climate is especially manifest in a reduction of intense rainfall events. Ingeneral the seasonality of rainfalls will weaken in the south and north of Benin, but strengthen inthe Middle Ouémé Valley. The onset of the rainy season is likely to be delayed in all parts of thecountry. At the coast the monsoon will begin up to 12 days later. Furthermore Benin will becharacterised by a significvant warming trend throughout the next two decades reaching morethan 2°C just within 20 years especially in the summer. The weakening of the hydrological cycleappears notably in the local recycling of precipitation and thus implies also a clear reduction ofevaporation in most parts of the country. We expect, however, no significant changes in themonsoon circulation.Uncertainties of modelled climate changes arise from the influence of mineral dust and biomassburning aerosols, which is not taken into account, and from the poor representation of the mostimportant rain-producing weather systems in West Africa, the organized meso-scale convectivesystems (MCS).Storyline for scenario Z: Persistence of recently observed trends (business as usual)For several decades the entire sub-Saharan West Africa has encountered an increasing number ofclearly below-normal amounts of annual rainfall. For Benin we also observe a trend toward reducedprecipitation amounts since the late 1960s. Since the mid- 1990s the water temperatures inthe tropical Atlantic have changed in a way that would favour higher precipitations throughoutthe entire tropical West Africa. However, rainfall amounts remain below the level they reachedduring the wet period in the middle of the 20 th century, despite the fact that in recent years a tendencytoward higher rainfall sums has been observed. The wet period then was associated with avery similar distribution of sea surface temperatures found in recent years. Model studies suggestthat the return to wetter conditions fails due to the degradation of the vegetation and the continuouswarming of the Indian Ocean. In this present scenario we assume that the two rainfallinhibitingfactors continue to exist. Hence we predict the persistence of below-normal precipationin all parts of Benin until 2025.In addition a progressive warming of the land surface was measured in the past. Under the assumptionof a continuous rise of global greenhouse gas concentrations and an increasingly uncontrolledland use change by a steadly growing population the warming trend will persist at arate of 0.2°C per decade.
Development of scenarios IMPETUS 39MoroccoTab. II.3.2:Characteristics of the climate scenarios for MoroccoSzenario X Szenario Y Szenario ZHigh Atlas• snow line rise by 200m,• more intense but lessfrequent precipitationevents,• not trend in annual precipitation,• more extreme precipitationeventsBasin of Ouarzazate• slightly increased precipitationamounts dueto enhanced moisturetransport for:a) tropical-extratropicalinteraction,b) pressure minima offthe Moroccan coast• snow line rise by 200m,• reduced precipitationdue to decreasing numberof lows from thenorth,• reduced seasonality,• strong warming in winter• substantially reducedprecipitation and seasonality,• more intense but lessfrequent precipitationevents from tropicalextratropicalinteraction,• strong warming in winter• snow line rise by 200m,• ongoing tendency towardsreduced precipitationin winter,• still large interannualvariability• no change in the longtermmean precipitationamount,• still tendency towarddry or wet periods ofseveral years (decadalvariability)Southern oasis• slightly increased precipitationamounts dueto enhanced moisturetransport for:a) tropical-extratropicalinteraction,b) pressure minima offthe Moroccan coast• slightly reduced precipitation,• more intense but lessfrequent precipitationevents from tropicalextratropicalinteraction,• reduced seasonality,• weak warming in winter• no change in the longtermmean precipitationamount,• still tendency towarddry or wet periods ofseveral years (decadalvariability)
40IMPETUS Development of scenariosFor all conceivable scenarios an increased warming of the atmosphere through rising greenhousegas concentrations is to be expected. The temperature increase will lead to a 200 m rise of thesnow line in the High Atlas and thus to an enhancement of the rainfall component of the precipitationwhich can percolate directly and thus enter the hydrological budget in the Drâa valley.Higher air temperatures reduce the sublimation of snow and enlarge the snowmelt. This holdstrue for all three scenarios, X, Y, Z.Storyline for scenario X: Enhancement of the humidity advectionIn the frame work of IMPETUS all processes leading to precipitation in the area south of theAtlas Mountains have been thoroughly investigated. Precitation in the High Atlas is generatedmainly by low pressure activity of the mid-latitudes during the cold months. Precipitation systemsreaching the ridges of the High Atlas from the north can also bring precipitation to thesouthern slopes. These systems are responsible for most part of the available water in the Drâaregion since especially in winter major parts of precipitation are blown in the form of snow fromthe north over the ridges of the Atlas Mountains. In the basin of Ouarzazate and in the southernoases this mechanism has no influence on the precipitation. In the latter regions precipitation isgenerated mainly by troughs or cut-off lows located west of the Moroccan coast. These systemsdraw their humidity either from local evaporation over the ocean or by tropical-extratropical interactionfrom areas south of the Sahara. In the latter mechanism a moisture input from convectiveclusters or squall lines over tropical Africa and the adjacent Atlantic Ocean, which is transportednorthward on the eastern side of a subtropical upper-level trough located to the west ofnorthwestern Africa, is a decisive factor. The advection of moist air from the south toward theslopes of the Atlas Mountains leads to forced lifting which results in the condensation of watervapour and eventually in the formation of precipitation.Due to the atmospheric warming as a result of increased greenhouse gas concentrations the aircan take up and transport more humidity. In this scenario X we assume that the dynamic processesof precipitation generation in the Drâa valley remain unchanged. The enhanced humidityadvection owing to the temperature rise leads to increased precipitation amounts. The statisticodynamicalregionalization of global climate model simulations with the help of the IMPETUSatmospheric model chain shows that for the southern oases a slight increase of cut-off lows westof the Moroccan coast can be expected. Although these events are quite rare they are responsiblefor the major part of the precipitation in the basin of Ouarzazate and in the southern oases. Onlya slight increase of such events leads to a noticeable rise of precipitation amounts. For the southernoases the area averaged annual precipitation amount rises from 31.9 mm to 34.3 mm(ECHMA4 climate scenario) or even to 40.5 mm (ECHAM4 climate scenario). In addition therise in air temperature is responsible for the increase in precipitible water available per event.Storyline for scenario Y: Displacement of the NAOA high number of climate models predict a displacement of the poles of the North Atlantic Oscillation(NAO; defined as normalized pressure difference between Iceland and the Azores) towardthe northeast leading to enhanced storm activity over northern Europe and drier conditions in the
Development of scenarios IMPETUS 41Mediterranian. This effect on the region under investigation can be studied with the help of theIMPETUS atmospheric model chain. Due to the northward displacement of the mean position ofthe polar front the cyclone tracks are also shifted to the north. As a consequence synoptic disturbancesof the midlatitudes reach the Atlas Mountains less frequently thereby clearly reducing thewinter precipitation in the High Atlas. This signal also extends to the regions south of the AtlasMountains. The results of the dynamical regionalization based on the model REMO show a precipitationreduction in the High Atlas of -38%. Diagnostic studies were carried out during thefirst phase of IMPETUS to investigate the underlying mechanisms of precipitation generation inthe southern parts of the catchment. Particularly the identified tropical-extratropical interactionmechanism, that is responsible for the advection of humidity from the tropics to the southernslopes of the Atlas Mountains, is not represented adequately by the coarse resolution of globalclimate models. The REMO model results show a reduction of precipitation also in the basin ofOuarzazate (-43%) and in the southern oases (-33%) due to boundary forcing by a global climatemodel (ECHAM4). In individual cases, however, the observed tropical-extratropical interactionis represented correctly by the LM model (“Lokalmodell” of the German Weather Service) undmore intense precipitation events are simulated due to enhanced humidity advection. The warmingof the atmosphere and the resulting enhancement of humidity transports can only compensatein part the predicted negative precipitation trend. We assume a tendeny toward les frequent butmore intense precipitation events by tropical-extratropical interaction throughout the transitionseasons. In summary the mean annual precipitation is reduced substatially in the High Atlas andonly moderately in the basin of Ouarzazte and the southern oases.Storyline for scenario Z: Trend extrapolationThe area south of the Atlas Mountains is charcterized by an extreme interannual variability ofprecipitation. Particularly in the basin of Ouarzazate and in the southern oases mean precipitationvalues result from averages over many very dry and some relatively humid years. Superimposedis a prominent decadal variability that can lead to misinterpretation of trends when consideringtoo short time intervals. Hence in the two southern sub-regions of the catchment no clear trendcan be diagnosed with respect to mean precipitation amounts. Solely in the High Atlas a reliabletrend toward a reduction of snowfall in winter is observed, despite the presence of high interannualvariablity. In this scenario Z we assume that the observed trend toward winters with lessprecipitation amounts together with a pronounced interannual varibability continues in the HighAtlas. In contrast the basin of Ouarzazate and the southern oases are better characterized by alarge decadal variability. If this tendency persists, the southern parts of the catchment will receiveconstant annual precipitation amounts but experience pronounced decadal variability. Theoccurrence of several consecutive dry or wet years will continue.
Problem clusters IMPETUS 43III.Problemkomplexe / Problem clustersIII.1Methodik / MethodThe term “problem cluster” describes a set of comprehensive and complex problems. Theseproblems require a multi-disciplinary approach in order to be successfully analysed and understood.Thus, when developing and implementing related problem solutions the future perspectivehas to be considered, too. Each problem cluster in the IMPETUS project comprises a number ofsingle thematic topics that portray the different disciplinary approaches that form the IMPETUSwork-packages and subprojects.The analysis of future development in Benin and Morocco in IMPETUS is mainly based on suitablemodels. We largely abstained from developing new models, but used existing models instead,after having checked their suitability. The models were adapted for the specific situation inthe country, sometimes also for the local level. We gathered a comprehensive collection of modelswhich can be utilised for the different kind of analyses needed in each problem cluster. Thismodel collection allows for flexibility when approaching specific research questions. The conceptof IMPETUS does not foresee the development of a single coupled modelling system butrather the loosely coupling of different system components (disciplinary models) in accordancewith the question that is at stake. Numerical models or expert models form the backbone of eachproblem cluster. Results of other models or problem cluster are used as input (Fig. III.1.1).We defined response indicators in order to be able to assess the problem cluster. Response indicatorsare figures that portray the system’s behaviour in an integrated way. An example is thepopulation supply with food (unit for example is kJ/d) where both aspects of food production andpopulation growth dynamics are of importance. The assessment of scenarios can be done in aqualitative way (indicator will increase or decrease) and in a quantitative way (indicator willdecrease about 20 percent if precipitation decreases about 10 percent). We defined criticalthresholds of response indicators (e.g. recommended nutrient intake is 10.000 kJ per day per personaccording to WHO) in order to assess the success of a certain strategy.We also needed to define the concrete thematic topics of analysis, for example the processes orprocess chains that had to be analysed: which processes directly influence the response indicators,which processes do only indirectly influence them? The thematic topics can be describedvia status indicators that characterise the state of the system (“state indicators”). They are eitherdirectly measurable and thus can be quantified (e.g. size of arable farm land) or they are onlyqualitatively assessable (like for example societal hierarchies in a village).We defined 20 problem clusters for the research area in Benin and 12 problem clusters for theresearch area in Morocco (see chapter III.2.). The problem clusters cover a wide spectrum ofsocio-economic and environmental-systemic problems and their interactions. Scenarios were fedinto in the problem cluster via the boundary conditions. The identification of problems and thedevelopment of suggestions for problem solutions were generated in close cooperation with thelocal partners in the IMPETUS project.
44IMPETUS Problem clustersCoupling via data exchangescenariosdriving forcesresponse indicatorsAt least one model is in the centreof each problem clusterFig. III.1.1:IMPETUS comprises a collection of models. One model is in the centre of each problem cluster,the results of the other models are used as input data.
Problem clusters IMPETUS 45III.2Übersicht der Problemkomplexe / Overview of problem clustersTab. III.2.1: Overview of problem clusters in BeninFood securityPK Be-E.1 Impact of resources pressure and rainfall variability on land use and food security in BeninPK Be-E.2PK Be-E.3PK Be-E.4PK Be-E.5PK Be-E.6PK Be-E.7HydrologyPK Be-H.1PK Be-H.2PK Be-H.3Land usePK Be-L.1PK Be-L.2PK Be-L.3PK Be-L.4Effects of land use change, climate change and plant management on soil degradation and cropyield in the Upper Ouémé valleySeasonal precipitation forecast in Benin and applications in agricultural planningInvestigation of suitable location and sustainable management for small scale barrages for agricultureand livestock farmingLand-use and water demand of livestock farming in BeninModelling of agrarian marginality in BeninThe potential of inland valleys for agricultural production in the Upper Ouémé catchmentWater availability and water consumption in the Upper Ouémé catchmentWater demand of the agriculture, households and industry sectors under consideration of potentialconflictsSatellite-based precipitation monitoring system for applications in agriculture and prediction ofdischargeLand use and land cover change in the Ouémé catchment. Assessment, causes, prognosis,measuresEconomic potentials of forest resources as a contribution to needs supplyThe impact of land use change scenarios on future precipitation and evaporation for three BenineseregionEco-volume dynamics and adaptation of agricultural system to climate change in the OuémécatchmentPK Be-L.5 Sustainable bush fire management for resource protectionSociety and healthPK Be-G.1 Population projections for the Ouémé catchmentPK Be-G.2PK Be-G.3PK Be-G.4PK Be-G.5Water management and institutional changeWater and livelihood securityRisk assessment with regard to the occurrence of malaria and meningitis diseases under theinfluence of the present and a modified future climateMicrobiological and virological contamination of drinking water sources in the HVO
46IMPETUS Problem clustersFood security• The research objective of the problem cluster (PK Be-E.1) is the development of scenarioson agricultural land use, water requirements, and food supply for Benin's regions until 2025.In particular, the problem cluster will deliver answers to the question which land use patternsand water requirements will result from a continuation of current climatic and demographictrends. To achieve this goal, an economic analysis and simulation of subsistence agricultureunder tropical conditions is carried out. Moreover, the productivity potentials and reserves ofagriculture are investigated, and the question how technical progress can contribute to alleviatefuture food gaps.• In the framework of the problem cluster “Effects of land use change, climate change andplant management on soil degradation and crop yield in the Upper Ouémé Catchment”(PK Be-E.2) soil erosion rates and crop yields will be calculated for climate and land usescenarios delivered by other IMPETUS members. Regions with a high risk of soil degradationshall be identified. Furthermore the effects of agrarian management strategies (particularlyfertilizer) on the yield of the main crops are quantified. Recommendations for soil conservationand agrarian management will be derived from modelling results and field studies.• Integrated in the subject area “Food security in Benin” this problem cluster (PK Be-E.3)deals with seasonal and long term precipitation outlooks and their possible application in agriculture.It is planned to implement an operational forecast system using model output statistics(MOS) and communicate the results to local decision makers. Therefore an extensive capacitybuilding is necessary. The second aim is to compose a detailed report dealing with theresults of the REMO climate scenario runs and the plant-growth models EPIC and YES. Itshould help to develop appropriate strategies for adaptation to debasing limiting factors.• The food security in West Africa is on risk due to climate changes and the populationgrowth. With proper managed small scale barrages the agricultural production can be increased.It is the aim of PK Be-E.4 to find suitable locations for the small dams. There areseveral fields which must be taken into account. On the one hand the ecological situation (topography,soil, vegetation, hydrology and other) had to be taken into account; on the otherside the socio-economic conditions (land rights, land conflicts, agricultural manure techniques,access to markets et al.) must be considered very carefully. Otherwise the sustainableuse is not guaranteed. So the decision support systems of this PK consist of different modulesto meet the manifold demands.• The problem cluster “Land and water requirements of livestock husbandry in Benin” (PKBe-E.5) concentrates on the use of natural resources in the domain of livestock husbandrywith its manifold interactions with cropping. Particularly in the area of land use and water,cropping and livestock management are progressively more competing for scarce land andwater sources. The scenarios show the impact of changes in climate and land use on the livestocksector.• In order to maintain food security and to conserve natural resources for the agricultural production,the identification of vulnerable sites is necessary. These sites are called “marginalareas” and are characterised by high natural constraints and therefore by high risk of landdegradation caused by agricultural overuse. Within the problem cluster PK Be-E.6 such
Problem clusters IMPETUS 47naturally based marginal agricultural production areas are located and its main constraintsdetermined. Furthermore, socio-economic parameters are implemented to estimate recentpressure on land. In a further step scenarios are calculated to identify sites at risk until 2025under global change.• The problem cluster PK Be-E.7 assesses the agro-potential of the inland-valley in the UpperOuémé catchment. As no sufficient inland-valley data are available for Benin a databaseconcerning the physical properties of the inland valley and their actual use is build up. Forthe simulation of the water availability within the inland valleys the hydrological modelUHP-HRU-N is used. The potential yields are modelled with EPIC and ORYZA. The resultsof this problem cluster are provided for Cellule bas-fond, which is the governmental structureof inland valley management in Benin.Hydrology• The problem cluster PK Be-H.1 analyse the water availability and water consumption in theUpper Ouémé catchment for different future scenarios. For the assessment of the water surfaceand groundwater resource the hydrologic model UHP-HRU and the groundwater modelFEFLOW are applied. The results from the climate scenarios and the LUCC modelling areused as input for the hydrological model. The water consumption is calculated using demographicdata from the demographic projections in combination with results from the waterconsumption studies of the IMPEUTS-project.• Based on the problem cluster (PK Be-H.2) concerning water demand of different sectors(household, industry and agricultural level), primary and secondary data was collected andintegrated into a national expert sector model (NES) that considers laws, institutionalchanges and general conditions. The aim of the last project period was to survey missing waterdemand variables which are needed to calculate scenarios relevant for the development ofa decision support system. This system will be the foundation for capacity building in Beninduring the next project period.• The Monitoring Tool “Satellite based rainfall monitoring” (PK Be-H.3) provides real timerainfall estimates based on satellite data, as well as high resolution (5 km, 30 minute) rainfallestimates for climatological applications. The tool made available these data for the rainyseasons 2002 to 2005 for project partners, and currently updates the estimates in a nearoperationalway as soon as the data is available. The Monitoring system will be tested in afully automatic way in the Meteorological Institute of the University of Bonn, and then transferredto the Benin weather service (DMN/ASECNA) onto the MSG receiver at the airport inthe third phase of IMPETUS.Land use• The main focus of this problem cluster (PK Be-L.1) is the creation of decision support systemsfor a sustainable land use planning. The assessment of the land use and land coverchanges is performed with remote sensing. Analysis of the actors and driving forces is performedby statistical analysis integrating socio-economic data and other information sources.Based on that so gained process understanding LUCC models are set up to compute future
48IMPETUS Problem clustersstates of LUCC according different scenarios defining the boundary conditions. The decisionsupport systems based on that models should assist stakeholders to perform a sustainableland use and land cover planning. For instance the influence new roads and other infrastructureson land use and land cover can be evaluated in advance.• Forests play an important role within the hydrological / climatological cycle and they are aswell important sources of income for the population. But in the catchment of the Ouémé theforests are on risk in Benin due to illegal logging and not appropriate forest management.Within this problem cluster (PK Be-L.2) the interactions between forest and hydrological /climatological cycle is investigated. As well an evaluation of different forest managementsystems on sustainable wood production has taken place. So the economic revenue and theecological stability of the forests according to different management schemes can be estimated.Important for the income of cattle farmers in this context is as well the biomass productionof the forest herbal layer, which is a function of structure parameters of the forest.This problem cluster aims to create a DSS which supports the foresters to find appropriateand sustainable forest management techniques.• In the framework of the problem cluster “Influence of land use change on future rainfall variabilityin the regions of interest” (PK Be-L.3) high resolution (3km) climatologies ofevapotranspiration and precipitation will be calculated for the Ouémé catchment by means ofa statistical-dynamical downscaling approach. The given <strong>Impetus</strong> scenario analysis serves asa platform to predict future precipitation and evapotranspiration scenarios. Furthermore,variations of precipitation due to reduced eco-volume are implemented into the downscalingapproach. On this basis an information system is generated, which shall give support to localstakeholders for the decision process.• This problem cluster (PK Be-L.4) draws heavily on newly developed concepts of ecovolumeand agro-climax, and accordingly, focuses on modelling of dynamic interplay betweenfarming system, vegetation cover, micro-climate and population development in thewhole Ouémé basin. Careful attention will be paid to validate as much as possible the ecovolumemodel under construction. Consequently, the agro-ecological constraints in the wholeOuémé basin will be further investigated, allowing agro-ecological evolution to be predictedon a regional scale, which, in turn and combined with the results of the other subprojects,would enable a realistic “Farming Decision Support System”.• In West Africa uncontrolled bush fires have many unwanted effects. Late fires can lead to aloss of nutrients, not proper fire management can be a threat for crops. As well the problemof smoke and CO2 emission must be taken into account. There are several laws and regulationsconcerning proper bush fire management in Benin. In PK Be-L.5 a processing chain todetect the spatial temporal distribution of the bush fire from satellite images in a high temporalresolution is set up. Therewith it is possible to evaluate if the laws and regulations concerningbush fire are kept. As well the burned biomass and loss of nutrients are estimated. Byimplementing additional information like vegetation maps, topography, soil data and meteorologicaldata a decision support system for a sustainable use of bush fire is set up.
Problem clusters IMPETUS 49Society and health• In the framework of the problem cluster ”Demographic projections for the Ouémé Catchment(PK Be-G.1)” the population increase and dispersal over diverse spatial and temporal levelsof scale will be calculated based on different pre-conditions of the IMPETUS scenario analysis.The focus of the continuation of the projections will be henceforth the modified frameworkconditions of the intervention scenarios. Further possible projections will be orientatedtowards the needs of the Beninese stakeholders.• The problem cluster “Water management and institutional change” (PK Be-G.2) focuses oninstitutional change in water management since decentralisation. The focus of the analysis isthe generation of policy scenarios and data on water infrastructure and utilisation for the integrationin the ISDSS. Furthermore, the training of municipal representatives for databankmanagement will be carried out in cooperation with PK Be-G.3 on the basis of the regionalsurvey on livelihood security in the Upper Ouémé Catchment.• The problem cluster “Water and livelihood security (PK Be-G.3)“ has, besides these measuresof capacity building, as its aim the quantitative operationalisation from previously neglectedfactors of livelihood security such as reciprocity and exchange of gifts, the accumulationof capital and consumption or gender differences with regard to access to and the managementof the resource water. The central components are the data from the regional surveyon livelihood security as well as miscellaneous data sets from the workpackages “Therapeuticpathways: availability, quality and management of medical care” and “Influences of genderand hierarchy on the vulnerability of individuals and households”.• The risk assessment with regard to the occurrence of malaria and the meningococcal meningitisdiseases in West Africa under the influence of the present and a modified future climateis the aim of the problem cluster PK Be-G.4. The simulation of malaria cases by the LiverpoolMalaria Model (LMM) enables the analysis of the disease distribution. In addition thechange of the distribution is investigated in different climate scenarios of the Regional Model(REMO). In the case of the meningococcal meningitis the effect of special weather conditionswith regard to the disease will be determined. By the means of the detected connectionsthe development of a statistical model will be allowed.• Within the scope of the problem cluster “Bacteriologic and viral contamination of drinkingwater sources in the Upper Ouémé Catchment (PK Be-G.5)” the influence of several factorson microbial water quality, as there are the kind of drinking water source, hygienic behaviourof water consumers, animal husbandry near the water source, geology of the site, climateconditions, and sanitary or reconstruction measures and water disinfections, is investigated.The findings will help to estimate hazardous constellations susceptible for drinking watercontamination and may support local decision-makers to improve sanitary measures and safedrinking water supply in rural areas of Benin.
50IMPETUS Problem clustersTab. III.2.2: Overview of problem clusters in MoroccoSecurity of livelihoodPK Ma-E.1 Economic aspects of water management in the Drâa regionPK Ma-E.2PK Ma-E.3HydrologyPK Ma-H.1PK Ma-H.2PK Ma-H.3PK Ma-H.4PK Ma-H.5Land usePK Ma-L.1PK Ma-L.2PK Ma-L.3SocietyPK Ma-G.1PK Ma-G.2Agronomic strategies in periods of water scarcity in the Drâa-oasisTourism: Integration of a new economic sector against the background of scare resources inthe main tourist areas: Ouarzazate, Dades valley and Zagora-M’HamidNatural and anthropogenic influences regarding dynamics of water resources in DrâacatchmentInteractions between water use strategies and groundwater resources and soil conditions inthe middle Drâa valleySeasonal discharge forecastsInterannual precipitation variability and water managementPossible developments of rainfall and evapotranspiration in the middle Drâa catchmentStrategies of land use and limited water resources in the central high atlas mountainsImpacts of land use change and climate change on resilience and capability of regeneration ofvegetation in southern MoroccoAssessment of risks and danger imposed by extreme rainfall: flood events and soil erosion inthe Drâa catchmentPopulation dynamics in the Drâa-ValleyPolitics of water and grassland use between traditional systems and state institutionsSecurity of livelihood• For the problem cluster (PK Ma-E.1) the integrated model adapted for the Drâa ValleyMIVAD (“Modèle intégré dans la vallée du Drâa”) is constructed as a hydrologic-economicoptimization model. With the integration of different hydrological and hydro- geologicalmodules and the adaptation on the specific nature of the oases belt, the results give a betterpicture on the effect of water management policies on the utilisation and degradation of theresource. Hence, scenario simulations that will be implemented and discussed with Moroccanstakeholders include different economic instruments for an integrated water management.• The main issue of our problem cluster (PK Ma-E.2) is to handle water scarcity via the analysisof past and present agricultural strategies facing drought seasons. We use therefore amodel family of hydrological, hydro geological, and anthropogenical models to create fromthis bases future scenarios of appropriate strategies under common circumstances. These re-
Problem clusters IMPETUS 51sults will be combined with GIS for visualisation and adaption purposes of agriculture surfacesand irrigation schemes in a Case Information System (CIS).• Tourism is an expanding industry in southern Morocco as shown in the problem clusterTourism as an economic area affected by scarce resources and economic potentials. The regionsof Ouarzazate, Dades Basin and Zagora-M’Hamid” (PK Ma-E.3). Nevertheless, infrastructuralfactors determine the potential for tourist businesses. Although, water consumptionof the tourism sector can be estimated being fewer than 5 % of the total water use, big luxurioushotels recently constructed in the south, can increase the ecological constrains.Hydrology• In the framework of the problem cluster “Natural and anthropogenic impacts on freshwaterresources in the Drâa catchment” (PK Ma-H.1) the model SWAT is used to analyse hydrologicprocesses in the Drâa catchment. SWAT will be integrated in the DSS “AGIFA” whichenables Moroccan stakeholders to calculate the effects of global change and managementpractices on water availability. The scenario development will be carried out in close cooperationwith the Moroccan stakeholders.• In the problem cluster “Interaction of water use strategies, groundwater resources and soilconditions in the Middle Drâa valley (PK Ma-H.2)” the complex relationship between theexploitation and the hydro geological and pedological setting is investigated. Focussing onthe domestic and agricultural use of groundwater and the groundwater availability concerningthe risk of soil salinisation the probable trends will be simulated based on the IMPETUSscenarios.Consequently intervention scenarios will be assessed. The results will be implementedin an information system. In collaboration with the IMPETUS-sub project C2 a DSSfor the evaluation of the impact of water exploitation on groundwater and soil (IWEGS) willbe developed. Further in collaboration with the Moroccan partners an integrated monitoringnetwork will be installed.• In the framework of the problem cluster “Seasonal forecast of snowmelt runoff for the irrigationmanagement (PK Ma-H.3)” the runoff volume and timing originating from the seasonalsnow storage and climate conditions in the Central High Atlas Mountains will be calculatedfor real time and statistical meteorological data as well as for the IMPETUS climate scenarios.Forecast of the reservoir filling is intended to assist in the irrigation planning of Moroccanadministrations for the middle Drâa valley.• Water management at the reservoir El Mansour Edabbhi has to ensure the availability of watereven throughout the dry season (PK Ma-H.4). Therefore, seasonal predictions of runoffestimated from actual snow cover maps and expected rainfall would be of a large value. Theuncertainty of such predictions, which is very large, has to be estimated in order to evaluatethe quality of runoff predictions. The statistical characteristics of past rainfall and runoff dataas well as teleconnections with lag-correlated circulation parameters give at least an idea ofuncertainty and predictability of rainfall. Snow cover data are gained from the MODIS satelliteobservations and are used in hydrological modelling. Together with the actual fill state ofthe reservoir it can be estimated at an arbitrary level of certainty, how much water may be releasedin “Lâchers” without emptying the reservoir in the summer months.
52IMPETUS Problem clusters• In the framework of the problem cluster “Effects of climate change and change in utilisationof water resources upon precipitation and evapotranspiration (PK Ma-H.5)” high resolution(3km) climatologies of evapotranspiration and precipitation will be calculated for the Draavalley south of the reservoir and for the area of the high Atlas. With the help of a statisticaldynamical downscaling approach <strong>Impetus</strong> scenario analysis will be considered to predict futureprecipitation and evapotranspiration scenarios. This will result in a database which maygive local stakeholders the opportunity to answer relevant questions and interpret consequencesof their own decisions.Land use• The problem cluster “Strategies of land-use under limited water resources in the Central HighAtlas Mountains” (PK Ma-L.1) analyses the dependency of agricultural systems on localwater availability. We consider water availability as being not only natural, but also sociallyand politically determinated. The inter- and intra annual variability of precipitation, the strainon land and pasture due to the ecological conditions, the climatic changes, and the steadypopulation growth are the principle parameters which limit the options for action of thepopulation.• The problem cluster “Changes in land use and climate and their significance for vegetationresilience in Southern Morocco (PK Ma-L.2)” focuses on vegetation dynamics in Morocco'srangelands. As it is very difficult to separate the influence of rainfall and of human land useon vegetation, a monitoring project has been initiated within the framework of IMPETUS. Tointerpret the adaption of management strategies to the high spatial and temporal variability ofnatural resources (in particular palatable biomass), the indicative value of vegetation structureand composition will be evaluated. A functional pasture classification will be incorporatedinto a rule-based model of ecological and economic buffer mechanisms in the pastoralnomadicland management.• The problem cluster PK Ma-L.3 addresses impacts of severe rainfall events. On a larger timescale, rainfall and wind lead to considerable soil erosion and, subsequently, to transport ofsediments into the reservoir El Mansour Edabbhi. On a smaller time scale, large runoff ratescause damages as well in infrastructure (roads and bridges, irrigation channels) as in agriculture(floods). The impact of future development of extreme rainfall, assessed from climatemodel scenarios, and adaptation strategies by reforestation as well as the construction of additionalreservoirs on soil erosion and on statistical characteristics of runoff amounts, depictedby means of extreme value analysis, allows for the formulation of a decision supportsystem.Society• The problem cluster “Population Dynamics in the Catchment Area of the Drâa” (PK Ma-G.1) deals with the population dynamics on various spatial and temporal scales in order togenerate different projections of the population development and structure according to theIMPETUS scenario analysis and the intervention settings. Concerning the complexity of
Problem clusters IMPETUS 53demographic processes, quantitative-statistical data and qualitative social-scientific data areraised and evaluated in different models.• Water, fields and rangelands are the basic resources of agricultural activities in the rural areasof southern Morocco. In the problem cluster, “Water and the use of pasture in relation to traditionaldecision making and state institutions” (PK Ma-G.2) we are using an institutionanalyses to look at the systems and actors which control the access to land and water. Thestill existing plurality of decision making institutions (state versus local) is giving way for anenhanced insecurity of the users and a potential for conflicts between different players in thelocal arena.
Capacity Building IMPETUS 55IVCapacity Building in BeninIn contrast to the first phase (2000 - 2003) of the IMPETUS project, where few activities hadbeen carried out, the capacity building was already intensified during the second phase (2003 –2006). A total number of 285 cadres coming from different Beninese services and institutionswere trained in GIS, SPSS, remote sensing and databanks. During this second phase, academicbuildings, training courses, conferences, demonstrations, database supply and other activitieswere carried out.Fig. IV.1: SPSS training for the communal cadres in Parakou 2005IV.1Realised activitiesTraining coursesTraining courses were the principal way to reach a great number of Beninese cadres and to transfervarious products of the IMPETUS project. The target groups were singularly scientific institutionssuch as universities, research centres etc. A total number of 14 training courses (around 2days for each training) were carried out mainly in Cotonou. The participants were interested inlearning and using the techniques brought by the IMPETUS project. Although the participantsdid not have any basic knowledge and had no material, they accustomed quickly to the contentsof the courses and assimilated perfectly (Tab. IV.1.1).
56IMPETUS Capacity BuildingTab. IV.1.1: SPSS training courses for the communes cadres in Parakou 2005Subproject Topic/Targets Target group Participants Duration PlaceA1 Modeling of climate andDGH, Direction of25 Cotonouappliquability of the results for theseasonal and climatic forecastmeteorologyA2IMPETUS conferenceIntroduction in GIS ArcView18 0,5 d CotonouparticipantsDGH 18 1 d CotonouApplication of GIS in hydrologyFSA 18 1 d CotonouChange detection with satellite forland resource management and CENATEL 13 2 d Cotonouintegration of GPS and GIS DataProcessing of space referred data Uni (Prof. Sinsin) 8 2 d CalaviIntroduction to remote sensing for UAC students andresources managementemployees60 2 d CalaviIntegration of satellite data in GISA3 for resource managementPGTRN employees 3 2 d CotonouRemote Sensing for natural resourcePostgraduatemanagement18 3 d CotonouDerivative of digital land modelssatellite datafrom remote sensing dataIMPETUS conferenceIntroduction to the work with participants10 0,5 d CotonouRemote Sensing and GIS Intitut of geography 9 2 d CotonouA4A5Presentation and discussions of thepreliminary servey results onLivestockIntroduction in statical analysis withSPSSTransfer of socio-economic databankand introduction to SPSSAgro sector experts(livestock specialised)Ministries, developmentcooperation, research, ...7 communes & 2Departements23 3,5 h Cotonou45 1 d Cotonou17 2 d ParakouAcademic buildingAcademic building of the Beninese is divided in three principal categories: PhD theses, Mastersand the DESS (diploma of specialized higher studies). The PhD theses were financed in collaborationwith the DAAD (German academic exchange service) and were carried out alternatively inGermany and Benin under the joint supervision of German universities and the University ofAbomey Calavi in Benin. The Master and DESS programs were conducted in Benin but underthe joint supervision of the University of Abomey Calavi and the researchers of the projectIMPETUS. The recipients of academic building constitute the principal partners of theIMPETUS project for its capacity building program. Mr. Gustave Dabnenonbakin, who obtainedhis PhD in agronomic sciences at the University of Bonn, works currently in CENAP, which isone of the INRAB centres and collaborates narrowly with the IMPETUS project. Mr. Luc Sintodjiobtained his PhD at the institute of geography of the University of Bonn and directly reintegratedin the faculty of Agronomy of the University of Abomey Calavi, which is also one ofthe principal IMPETUS partners.
Capacity Building IMPETUS 57Tab. IV.1.2:IMPETUS SubprojectAcademic building of BenineseInstitutions partners Building NamesA2 UAC PhD L. SintondjiA2/A3 UAC DESS C.KanninkpoUAC PhD V. OrekanA3UAC DESS J. WotoUAC PhD I. TokoA4 INRAB PhD G. DagbenonbakinUAC Master A. Benon MoraA5UAC Master S. Bio YerimaUAC DESS F. MazouPractical courses and demonstrationsThe activities of capacity building were also related to the practical courses and training of technicians.The practical courses were conducted in the laboratories of the IMPETUS project inParakou. The participants were students of the faculty of sciences and technology at the Universityof Abomey Calavi. During the second phase, the researchers of the IMPETUS projecttrained technicians in data collection. About two technicians per researcher acquired not only thetechniques, but also the aptitude to observe and analyze the consequences of the unsustainableuse of natural resources.ConferencesThe IMPETUS project organized a conference in Cotonou from 4 th to 6 th October 2004 which 89participants from scientific institutions, ministries, non governmental organizations and developmentprojects attended. This conference was once more a way to inform the public about theresults of IMPETUS project. It was also an opportunity to demonstrate to the participants someessential tools (GIS, ...) in research on natural resources. In cooperation with SNV,IMPETUS organised in Parakou a conference on the results of the 2004 socio-economic survey.Data supplyOn the contrary to the first phase, the second phase has been also marked by a transfer of directlyusable databank. For example, due to the results of microbiologic analysis of water samplestaken in several modern wells in the Upper Ouémé Valley (HVO), the organisations like Helvetas,Caritas and DED decided to re-examine their systems of constructing wells in order to avoidrisks of water contamination. In December 2005, a socio-economic databank was transferred tothe seven communes of the HVO providing essential information for the planning of developmentprograms and projects.
58IMPETUS Capacity BuildingOther activitiesOther activities were carried out with the aim to inform the Beninese community and to reinforceits capacity. A Benin Atlas realised by IMPETUS project which compiles diverse informationwas distributed to different partners in Benin; a broadcast interview and an article in a localnewspaper were also used. The Benin Atlas, which already exists in the form of a compendiumand on a CD, is a great success in Benin so that the IMPETUS project wants to update it duringits third phase.Fig. IV.1-1: The cadres of HVO communes analysing the Benin AtlasIV.2Pilot communesMeaning and identification of pilot communesSince the decentralization in 2002, the municipalities in Benin are administratively autonomous.Although they became thereby nominally the most important participants of the regional development,they still don’t have appropriate data whereas their planning needs adequate expertise insustainable use of natural resources. Since the wish of the IMPETUS project is the sustainableimplementation of scientific results, the municipalities represent one of the most important partnersin the transfer and adoption of IMPETUS data and recommendations. As cooperation betweenIMPETUS and the municipalities still has no structure of knowledge transfer, first capacitybuilding activities are accomplished in three pilot municipalities (Bassila, Copargo and
Capacity Building IMPETUS 59Tchaourou). The upper Ouémé catchment area as the original zone of IMPETUS activities coversseven communes: Tchaourou, Bassila, Djougou, Ouakè, Copargo, N'Dali, Parakou (Fig.IV.2-1). The land degradation is further advanced in the northwest (Ouakè, Copargo) than in thesouthern communes (Bassila, Tchaourou) of the upper Ouémé catchment area. In order to adaptthe knowledge of the IMPETUS project to these different basic conditions, Bassila, Tchaourouand Copargo were selected as pilot communes. The following criteria’s have been used to selectthe pilot communes:• the communes should be already able to feature a close co-operation with IMPETUS(Bassila, Tchaourou) during the first phase• the communes should represent a high surface and population portion of the upperOuémé catchment (Tchaourou, Bassila).• different stages and processes of land degradation should be reflected in the communes(high in Copargo; low in Tchaourou and Bassila)• at least, one commune should be characterized by the quasi-absence of sustainable landmanagement in the past despite high degradation of the natural resources (Copargo).Cooperation between the pilot communes and IMPETUS will be intensified during the first yearand expand on the entire Ouémé catchment from the second year of the third phase.Fig. IV.2-1: Designated pilot communes in the Upper Ouémé Catchment
60IMPETUS Capacity BuildingForum of communesFollowing the discussions with the mayors of the pilot communes (Bassila, Copargo andTchaourou) in December 2005, a communes’ forum was proposed to guarantee the success ofcapacity building on the communal level. The communes’ forum consists of an informal discussionstructure, in which the communes and their respective development partners define the waysand means to adopt the recommendations of the IMPETUS project. The forum will cover thecommunes Bassila, Copargo, Djougou, Dali, Ouakè, Tchaourou and Parkou as well as the “departments”Donga and Borgou. This forum will be initiated by the IMPETUS project, which willhowever be structured and coordinated by the communes themselves. The IMPETUS projectexpects from this forum:• precise formulation of expectations of communes and development projects• effective participation in the capacity building process and commitment to the acceptanceof the transferred knowledge• feedback, in order to adapt the knowledge and transfer methods• introduction of an effective and continuous co-operation between research institutions,communes and other development partners• establishment of the IMPETUS knowledge• commitment of each forum member to the protection and durable use of the natural resources.Identification of intervention topicsConcerning the transfer of knowledge, the mayors of the pilot communes have identified thefollowing principal fields of intervention. The close cooperation between development projectsand the IMPETUS project will give the possibility to satisfy these wishes:• regeneration of the soil fertility• development of appropriate and sustainable farming systems• provide an extended socio-economic databank• cartography of appropriate sites for wells• causes of low school rate and reasons of high abandon ratio• digitization of the settlement management• cartography of appropriate locations for afforestation• identification of appropriate locations for rice and vegetable growing (inland valleys)• improving cashew nut production, processing and marketing• micro credits (measures for reaching the poor in rural areas)• strategies against deforestation• improvement and protection strategies of “Karité” and “Nér锕 animal husbandry (appropriate strategies, pasture management)• rain forecasts for farmers
Capacity Building IMPETUS 61• appropriate locations for small artificial lakes and their management• impact of cotton production on the pollution of groundwater• conflicts between herders and farmers (particularly in inland valleys during the dry season)• water management and erosion protection strategiesAbbreviationsCD Compact discCENA Centre National d’Agro-Pédologie (Benin)CENATEL Centre Nationale de Télédétection et de Surveillance du Couvert Forestier (Benin)DAAD Deutscher Akademischer AustauschdienstDED Deutscher EntwicklungsdienstDESS Diplôme d’Etudes Supérieures SpécialiséesDGH Direction Générale de l’Hydraulique (Benin)FSA Faculté des Sciences Agronomiques (UAC)GIS Geographical Information SystemHVO Haute Vallée de l’Ouémé (Benin)INRAB Institut National de Recherche Agricole du BéninPGTRN Projet de Gestion des Terroirs et des Ressources Naturelles (Benin)PK ProblemkomplexSNV Dutch development organizationSPSS Statical Package for the Social SciencesUAC Université d'Abomey-Calavi (Benin)
62IMPETUS PublicationsV. IMPETUS Publikationen / PublicationsVORLÄUFIGAdanguidi, J. und M’barek, R., 2003: Analyse des côuts de production agricole au Bénin (forthcoming)Bachner, S., 2002: Analysis of African Easterly Waves and associated convection using a non-hydrostatic limited-area model.Diploma thesis, Meteorologisches Institut der Universität Bonn, Bonn, Germany. 128 pp.Behle, C. und Schopp, M., 2002: Analysis of Water Demand and Water Availability in the Catchment of the “Haute Ouémé”,Benin / West-Africa. In: Universität Kassel-Witzenhausen (Hrsg.): Deutscher Tropentag 2002. Challenges to OrganicFarming and Sustainable Land Use in the Tropics and Subtopics. Kassel. S. 241f.Bormann, H. & B. Diekkrüger (2003): Possibilities and limitations of regional hydrological models applied within an environmentalchange study in Benin (West Africa), submitted to Physics and Chemistry of the Earth.Bormann, H. & B. Diekkrüger (2003): Analyse der Unsicherheiten bei der hydrologischen Modellierung im Benin (West-Afrika)im Rahmen des IMPETUS-Projekts, accepted contribution to the proceedings of the 6. Workshop on large scale hydrologicalmodelling, main focus set on catchment management, Magdeburg, 28./29.11.2002, in press.Bormann, H. & B. Diekkrüger (2003): Untersuchung der Auswirkungen von globalen Veränderungen (global change) auf denWasserhaushalt im Benin (GLOWA-IMPETUS-Projekt). In: Kleeberg, H.-B. (Hg.): „Klima - Wasser - Flussgebietsmanagement- im Lichte der Flut“ Beiträge <strong>zu</strong>m Tag der Hydrologie am 20./21. März 2003 in Freiburg i.Br.. Schriftenreiheder Fachgemeinschaft Hydrologische Wissenschaften, 4. In press.Bormann, H., Giertz, S. & B. Diekkrüger (2002): Multiskalige Analyse des Wassertransports im subhumiden Klima Benins(Westafrika). In: Stephan, K., Bormann. H. & Diekkrüger, B. (Hrsg.): 5. Workshop <strong>zu</strong>r Hydrologischen Modellierung.Möglichkeiten und Grenzen für den Einsatz hydrologische Modelle in Politik, Wirtschaft und Klimafolgeforschung. KasselUniversity Press, S. 100-111.Burkhardt, J.: (Evapo-)transpiration measurements of agricultural crops in the Ouémé Supérieur. Paper presented at the SymposiumEau comme resource rare au Benin, Cotonou, Benin, March 2003.Burkhardt, J., Dagbenonbakin, G., Goldbach, H.E., Schroth, G. (2001) Transpiration and water use efficiency of different tropicalcrop species. Proceedings, One World - Research for a better Quality of Life. Deutscher Tropentag 2001, Bonn, 115.Cappy S., Reichert B., Thein J., 2002: Hydrogeological framework of the northern Drâa-catchment: Results of local and regionalscale investigations. In: Afrikagruppe deutscher Geowissenschaftler, Jahrestreffen 2002 – Forschungs- und Entwicklungs<strong>zu</strong>sammenarbeitin Afrika. Proceedings, unpublished.Diekkrüger B., Bormann, H., Faß, T., Giertz, S., Junge, B., Reichert, B. & A. Skowronek (2002): Soil water dynamics, surfacerunoff, groundwater recharge and soil degradation on local to regional scale. In: GSF – Forschungszentrum für Umweltund Gesundheit GmbH, Projektträger des BMBF für Umwelt- und Klimaforschung (2002): GLOWA Statusreport 2002,72-75.Diekkrüger B., Cappy S., Chafik B., Gumpert M., Reichert B., Schulz O., Skowronek A., Thein J., Weber B., Winiger M., 2002:Water availability and soil degradation. In: GSF – Forschungszentrum für Umwelt und Gesundheit GmbH, Projektträgerdes BMBF für Umwelt- und Klimaforschung - GLOWA Statusreport 2002, 91-94.Doevenspeck, M., 2001: Population-environment dynamics in West Africa - Spontaneous Agricultural Colonization in CentralBenin. In: Universität Bonn (Hrsg.): Deutscher Tropentag 2001. One World, Research for a better quality of life. Bonn.S. 250.Fass, T. & B. Reichert, 2002: Methoden <strong>zu</strong>r Ermittlung der Grundwasserneubildung auf der lokalen Ebene in der FeuchtsavanneWestafrikas. In: Schafmeister, M.-T. und Meyer, T., (Hg.): Grundwasserressourcen im Spannungsfeld zwischen Erschließungund Naturschutz. Schriftenreihe der DGG, 19, 64.Fass, T. & B. Reichert, 2002: Methoden <strong>zu</strong>r Ermittlung der Grundwasserneubildung auf der lokalen Ebene in der FeuchtsavanneWestafrikas.- In: Afrikagruppe deutscher Geowissenschaftler, Jahrestreffen 2002 – Forschungs- und Entwicklungs<strong>zu</strong>sammenarbeitin Afrika. Proceedings, unpublished.Fass, T. & B. Reichert, 2003: Ein Beitrag <strong>zu</strong>r Entwicklung von Süßwasser-Management-Tools im GLOWA-IMPETUS Projekt –Hydrogeologische Input-Faktoren.- In: Kleeberg, H.-B. (Hg.): „Klima - Wasser - Flussgebietsmanagement - im Lichteder Flut“ Beiträge <strong>zu</strong>m Tag der Hydrologie am 20./21. März 2003 in Freiburg i.Br.. Schriftenreihe der FachgemeinschaftHydrologische Wissenschaften, 4. In press.Fass, T. & B. Reichert, 2003: Determining the groundwater recharge mode of a fractured migmatitic aquifer at local scale inBenin, West Africa. In: Proceedings of IAH international conference on groundwater in fractured rocks, Prague, 15.-19.Sept. 2003. Accepted.Finckh, M. & Staudinger, M. (2002): Macro- und microskalige Ansätze <strong>zu</strong> einer Vegetationsgliederung des Drâa-Ein<strong>zu</strong>gsgebiets(Südmarokko). Berichte der Reinhold-Tüxen-Gesellschaft 14, 81-92. Hannover.Finckh, M & Staudinger, M. (2003): Beitrag <strong>zu</strong>r Vegetationsdynamik der Igelpolsterheiden des Hohen Atlas, Marokko. Tagungsband16. Jahrestagung der Gesellschaft für Tropenökologie, Rostock.Fink, A. H. and A. Reiner, 2003: Spatio-temporal Variability of the Relation between African Easterly Waves and West AfricanSquall Lines in 1998 and 1999. J. of Geophys Res., 108(D11), ACL 5-1–5-17, 4332, doi:10.1029/2002JD002816.Fink, A.H., D. G. Vincent, P. Reiner, and P. Speth, 2004: Mean state and wave disturbances during phases I, II, and III of GATEbased on ERA-40. Accepted for publication in Mon. Wea. Rev. in September 2003.Fink, A. H., Knippertz, P., 2003: An extreme precipitation event in southern Morocco in spring 2002 and its hydrological implications.Weather, in press.Geißen, V., Junge, B. & A. Skowronek, 2001: Einfluss unterschiedlicher Nut<strong>zu</strong>ng auf boden-ökologische Kennwerte tropischerBöden der Feuchtsavanne Benins, Mitteilgn. Dtsch. Bodenkundl. Gesellsch., 96 (1). p. 329-330.
Publications IMPETUS 63Giertz, S. & B. Diekkrüger, 2003: Analyse der Abflussbildungsprozesse in einem kleinen Ein<strong>zu</strong>gsgebiet in Benin unter besondererBerücksichtigung der Landnut<strong>zu</strong>ngsänderung - In: Kleeberg, H.-B. (Hg.): „Klima - Wasser - Flussgebietsmanagement- im Lichte der Flut“ Beiträge <strong>zu</strong>m Tag der Hydrologie am 20./21. März 2003 in Freiburg i.Br.. Schriftenreihe der FachgemeinschaftHydrologische Wissenschaften, 4. In press.Giertz, S. & B. Diekkrüger, 2003: Analysis of the hydrological processes in a small headwater catchment in Benin (West Africa),submitted to Physics and Chemistry of the Earth.Goossens, R., Schmidt, M., Altmaier, A., Benoit, F., Menz, G. (2001): Extraction of Digital Elevation Models and ortho-imagesfrom CORONA KH4B data. Proceedings of ISPRS workshop: High resolution mapping from space 2001, Hannover,Germany.Goossens, R., Schmidt, M., Menz, G., 2002: Low cost DEM generation from TERRA-ASTER data - a case study of Morocco.In: Bénes, T. (eds.): Geoinformation for European wide integration, 19-25.Haase, G., 2002: A physical initialisation algorithm for non-hydrostatic weather prediction models using radar derived rain rates.Ph. D. Thesis, Meteorol. Inst. Univ. Bonn, Bonn. 104 pp.Haase, G. and S. Crewell, 2000: Simulation of radar reflectivities using a meso-scale weather forecast model. Water ResourcesResearch, 36, 2221-2230.Haase, G., Crewell, S., Simmer, C., and W. Wergen, 2000: Assimilation of radar date in meso-scale models: physical initialisationand latent heat nudging. Phys. Chem. Earth (B), 25, 1237-1242.Junge, B. & A. Skowronek (2001): Tropical soils in the savanna of Benin/West Afrika. - Deutscher Tropentag 2001, Abstracts, p.121.Junge, B., Skowronek A. & V. Geißen (2001): Tropische Böden der Feuchtsavanne Benins (Westafrika), Mitteilgn. Dtsch. Bodenkundl.Gesellsch., 96 (2), p. 511-512.Knippertz, P., Fink, A. H., Reiner, A., Speth, P., 2003 a: Three late summer/early autumn cases of tropical-extra-tropical interactionscausing precipitation in Northwest Africa. Mon. Wea. Rev., 131/1, 116-135.Knippertz, P., Christoph, M., Speth, P., 2003 b: Long-term precipitation variability in Morocco and the link to the large-scalecirculation in recent and future climates. Meteorol. Atmos. Phys., 83, 67-88.Knippertz, P., 2004: Tropical-extra-tropical interactions causing precipitation in northwest Africa: Statistical analysis and seasonalvariations. Mon. Wea. Rev (in press).Mbarek, R., Behle, C., Doevenspeck, M., Henrichsmeyer, W., Mulindabigwi, V., Schopp, M., Singer, U., Henrichsmeyer, W.,Janssens, M. und Schug, W., 2003: Socio-economic development with regard to the availability of resources in Benin,West Africa. In: European Geophysical Society. Geophysical Research Abstracts. EGS-AGU-EUG Joint Assembly.Nice, France. Volume 5 (CD-Rom).Menz, G., Schmidt, M., Finckh, M., Jürgens, N. (2001): Assessment of spatio-temporal vegetation dynamics in the Drâa catchmentusing a multisensor approach. Proceedings of the international symposium: Arid Regions Monitored by Satellites:from Observing to Modelling for Sustainable Management, Marrakesh, Morocco.Menz, G., Thamm, H.-P., Kissiyar, O., Mamma, V., Schöttker, B., M. Judex, 2002: Quantitative Assessment of forest stands inBenin (West Africa) an their fragmentation between 1986 and 2001, Annual Meeting of the AAG, 19-23 March 2002 inLos AngelesMulindabigwi, V. and Janssens, M.J.J., 2002: Influence of Land Use Systems on the Organic Matter Dynamics in the UpperOuémé Catchement in Benin. Tropentag, KasselMulindabigwi, V. and Janssens, M.J.J., 2003: Influence of farming systems and rain variability on carbon balance and food securityin the upper Ouémé catchement in Benin. Deutsche Gesellschaft für Tropenökologie (GTÖ). RostockMulindabigwi, V. and Janssens, M.J.J., 2003: Gestion des eaux de pluies: Priorité pour une sécurité alimentaire et une gestion duterroir durables (forthcoming)Oertel, D., Zhukov, B., Thamm , H.-P., Roehrig, J. & B. Orthmann, 2003: Space-borne High Resolution Fire Remote Sensing inBenin /West Africa. Int. Journal of Remote Seninsing (submitted).Orekan, V., Menz, G., H.-P. Thamm, 2002: Spatio-temporal Vegetation Dynamics Analysis in the Upper Ouémé CatchmentUsing Remote Sensing Data, Actes de la Ixéme Journée de l’Association Béninoise de Pastoralisme (A.Be.Pa), Cotonou,le 16 Novembre 2002.Orthmann, B. and S. Porembski, 2000: Analyse des structures, conditions et du potentiel de régénération de la végétation dans lebassin versant de l ’Aguima (Doguè). Actes de la VIIéme Journée de l’Association Béninoise de Pastoralisme (A.Be.Pa),Cotonou, November 2000.Orthmann, B. and S. Porembski, H-P. Thamm, G. Menz, B. Sinsin, 2001: Assessment and Modelling of Vegetation Dynamics inthe Upper-Ouémé Catchment (Benin, West-Africa) within the IMPETUS-project. Annual Meeting of the GTÖ, Bremen,February 2001.Orthmann, B. and S. Porembski, H-P. Thamm, G. Menz, B. Sinsin, 2001: Assessment and Modelling of Vegetation Dynamics inthe Upper-Ouémé Catchment (Benin, West-Africa). Annual Meeting of the IAVS, Weihenstefan, July 2001.Orthmann, B. and Wesuls, D., S. Porembski, 2001: Analyse de la dynamique actuelle de la végétation dans le bassin versant del ’Aguima (Doguè). Actes de la VIIIéme Journée de l’Association Béninoise de Pastoralisme (A.Be.Pa), Cotonou, November2001.Orthmann, B. and S. Porembski, 2002: Analyse de la végétation sur l’impact de coup des certains essences dans le bassin versantde l ’Aguima (Doguè, Benin). Meeting : Phytosociologie et dynamique des végétations de montagne, Peiresc, July 2002.Orthmann, B. and S. Porembski, 2003 : Impact of selective logging of tree species on natural tree regeneration in different woodlands(Benin, West Africa). Annual Meeting of the GTÖ, Rostock, February 2003.Paeth, H., Born, K., Jacob, D. and Pod<strong>zu</strong>n, R., 2003: Regional dynamic downscaling over West Africa: model validation andcase studies of wet and dry years. Meteorology and Atmospheric Physics, submitted.
64IMPETUS PublicationsPaeth, H. and Hense, A., 2003a: SST versus climate change signals in West African rainfall: 20 th century variations and futureprojections. Climatic Change, accepted.Paeth, H. and A. Hense, 2003b: Seasonal forecast of sub-Sahelian rainfall using cross validated model output statistics. MeteorologischeZeitschrift, 12 (3), 157-173.Paeth, H., K. Born, D. Jacob and R. Pod<strong>zu</strong>n,2003: Regional dynamic downscaling overc West Africa: model validation and casestudies of wet and dry years. Meteorology and Atmospheric Physics, submitted.Reiner, A., 2003: Synoptische Wellenstörungen und meso-skalige Konvektionsniederschläge in der westafrikanischen Sahel- undSudanzone - Analyse mittels satellitengestützter Mikrowellen-Niederschlagsschät<strong>zu</strong>ng. Mitteilungen aus dem Institut fürGeophysik und Meteorologie der Universität <strong>zu</strong> Köln (Hrsg. M. Kerschgens, F. M. Neubauer, M. Pätzold, P. Speth, B.Tezkan), 154, 167 S.Schmidt, M., Goldnick, K., Poete, P., Menz, G. (2002): Long term vegetation change detection and degradation monitoring in anarid environment on the basis of very high resolution satellite data. e-Proceedings 2.EARSeL Workshop: Remote sensingin developing countries. Bonn.Schmidt, M., Goossens, R., Lauber, C: (2002): CORONA - IKONOS, historical and recent high resolution satellite data inchange detection applications. In: Bénes, T. (eds.): Geoinformation for European wide integration, 127-132.Schmidt, M., Goossens, R., Menz, G.(2001): Processing techniques for CORONA satellite images in order to generate highresolutiondigital elevation models (DEM). Proceedings of the 21 EARSeL Symposium May 2001. Paris, France.Schmidt, M., Goossens, R., Menz, G., Altmaier, A., Devriendt, D. (2001): The use of CORONA satellite images for generating ahigh-resolution digital elevation model (DEM). Proceedings of the IGARSS 2001 Conference, July 2001. Sydney, Australia.Schmidt, M., Thamm, H.-P., Menz, G.(2002): Long term vegetation change detection application in an arid environment usingLANDSAT data. - in: Bénes, T. (eds.): Geoinformation for European wide integration, 145-154.Schöngart, J. and B. Orthmann, K. Hennenberg, S. Porembski, J. Sarzinsky, M. Worbes, 2003: Dendrochronological investigationson Tropical West African Tree Species and their potential for Climate reconstruction. Annual Meeting of the GTÖ,Rostock, February 2003.Schöttker, B., H.-P. Thamm, 2001: Wissensbasierte Landnut<strong>zu</strong>ngsklassifizierung in Benin (West Afrika) unter Verwendung desExpert Classifier von ERDAS IMAGINE. , In: Proceedings of the ERDAS User Group Meeting, 17.-19.10.2001, FürstenfeldbruckSchopp, M., 2001: Water supply in Benin/West Africa- Study of the demand page of water balance. In: Universität Bonn (Hrsg.):Deutscher Tropentag 2001. One World, Research for a better quality of life. Bonn. S. 164.Schug, W., Behle, C., Doevenspeck, M., Henrichsmeyer, W., Janssens, M., M’barek, R., Mulindabigwi, V., Schopp, M. undSinger, U., 2002: Socio-demographic development and migration against the background of resource scarcity. In: GSF –Forschungszentrum für Umwelt und Gesundheit GmbH (Hrsg.): Global Change in the Hydrological Cycle, Status Report2002. München. S. 80-83.Schulz, J. and P. Bauer, 2002: An improved estimation technique for rainfall over land surfaces using active and passive microwavesatellite data. Recent advances in quantitative remote sensing. Ed. Jose A. Sobrino, University of Valencia, ISBN84-370-5515-6, 751-760.Shao, Y., Sogalla, M., Kerschgens, M., Brücher, W, 2001: Effects of land surface heterogeneity upon surface fluxes and turbulentconditions. Meteorol. Atmos. Phys., 78, 157-181.Staudinger, M. & Finckh, M., 2003: Interpretation räumlicher Vegetationsmuster in ariden Gebieten – Versuch einer Klassifizierung<strong>zu</strong>grunde liegender Koexistenz- und Konkurrenzmechanismen. - in: Veste, M. & Akthar-Schuster, M. (eds.): UFZ-Bericht, Leipzig-Halle, Basic and Applied Dryland Research 1, 51-63. Proceedings Working Group Desert Ecology.Süßer, M., 2003: Die IMPETUS-Metadatenbank – Ein Baustein multidisziplinärer Forschung. Workshop 2003 des AK Umweltdatenbankender GI-Fachgruppe 4.6.1 Informatik im Umweltschutz der Gesellschaft für Informatik e.V.Thamm, H.-P., M. Braun, 2002: Evaluation of JERS GRFM imagery for small-scale land use / land cover classification in WestAfrica: A case study from Benin. In: Proceedings of the 2nd Workshop of the EARSeL Special Interest Group on RemoteSensing for Developing Countries, 18. - 20. September 2002, Bonn. In PressThamm, H.-P., Drey, T. & G. Menz, 2003: Evaluation of different change detection methods in the semi humid tropics, possibilitiesand limitations, 23rd EARSeL Annual Symposium 2003, 2-5 June 2003, Gent, Belgium (submitted).Thamm, H.-P., Kissiyar, O., G. Menz, 2001: Determination of the landuse/landcover change in the upper Ouémé Catchment,Benin (West-Africa), 21rd EARSeL Annual Symposium 2001, 2-5 June 2001, ParisThamm H.-P., Menz G., Goldbach H., Porembski S., Jürgens N., Burkhardt J., Finck M, Orthmann B., Staudinger M &F. Gresens, 2003: Funtional relationships between spatio-temporal vegetation dynamics and the water cycle. In: proceedingsof the EGS-AGU-EUG Joint Assembly Nice, France, 06 - 11 April 2003Thamm, H.-P., Menz, G., O. Kissiyar, 2001: Investigation of the Land Use / Land Cover Change in the Upper Ouémé Catchment,Benin (West-Africa) for the Set Up of a Coherent Development Plan. In: Proceedings IGARSS SymposiumAustralia, 9-13, 2001, Sydney.Thamm, H.P., Schmidt, M., 2001: Erhebung von Ground Truth mit dem GPS Link von ERDAS IMAGINE für eine Klassifizierungder Landnut<strong>zu</strong>ng in Benin und Marokko im Rahmen des IMPETUS Projekts. Proceedings of: Geosystems userGroup meeting 2001, Germering, Germany.Thamm, H.-P., Schmidt, M., Mévo Guézo, G., Menz, G., 2000: An integrative management project for efficient and sustainableuse of fresh water in western Africa (IMPETUS). Proceedings of the 1st EARSeL Workshop on Remote Sensing in DevelopingCountries, Gent, Belgium.Thamm, H.-P., B. Schoettker, 2002: Classification of heterogenious land use in the semi humid tropics (Ouémé Benin) with anknowledge-based approach. In: Proceedings IGARSS Symposium 24-28 June 2002, Toronto.
Publications IMPETUS 65Veste, M. & Staudinger, M., 2003: Räumliche Variabilität der pflanzlichen Wasserversorgung an Trockenstandorten in Südmarokko.- in: Veste, M. & Akthar-Schuster, M. (eds.): UFZ-Bericht, Leipzig-Halle, Basic and Applied Dryland Research 1,65-74, Proceedings Working Group Desert Ecology.
Part A IMPETUS 67VI.Darstellung der Teilprojekte / Presentation of the subprojectsProjektbereich ADer hydrologische Kreislauf des Ouémé-Ein<strong>zu</strong>gsgebietesund sozioökonomische ImplikationenPart AThe hydrological cycle of the Ouémé catchmentand socio-economic implications
Subproject AB1 IMPETUS 69Teilprojekt AB1Externe Klima-Antriebsszenarien auf der globalen und kontinentalen SkalaExternal climate forcing scenarios on the global to continental scaleAntragsteller / ParticipantsProf. Dr. P. Speth (Koordinator)Institut für Geophysik und Meteorologie,Universität <strong>zu</strong> KölnProf. Dr. A. HenseMeteorologisches Institut, Universität BonnDr. M. LatifMax-Planck-Institut für Meteorologie, HamburgProf. Dr. C. SimmerMeteorologisches Institut, Universität BonnFach / DisciplineMeteorologie:Klimamodellvalidierung und KlimadynamikMeteorology:climate modelling evaluation andclimate dynamicsMeteorologie:Großskalige Klimamodellierungund RegionalisierungMeteorology:large-scale climate modelling andregionalisationMeteorologie:Großskalige KlimamodellierungMeteorology:large-scale climate modellingMeteorologie:Mesoskalige Modellierung undFernerkundungMeteorology:meso-scale modelling and remotesensingZusammenfassungDas Teilprojekt AB1 umfasst Arbeiten im Bereich der Meteorologie, deren Ergebnisse übergreifendfür die Teilprojekte in Marokko und Benin relevant sind. Die Arbeitsbereiche unterteilensich in globale Klimamodellierung mit ECHAM (AB1-1), regionale (synoptisch-skalige, kontinentweite)Klimamodellierung mit REMO (AB1-2) und Niederschlagsmonitoring mit Hilfe dersatellitengestützten Fernerkundung (AB1-3). Die in IMPETUS verwirklichte Modellkette - startendauf der globalen Skala mit ECHAM bis hin <strong>zu</strong>r lokalen Skala (FOOT3DK) - hat den Vorteil,durch (statistisch) dynamisches „Downscaling“ alle relevanten Skalenwechselwirkungen <strong>zu</strong> erfassen.Da dem globalen Modell ECHAM als oberstes Glied der Kette eine entscheidende Rollefür den Antrieb von Klimaänderungen <strong>zu</strong>kommt, werden die relevanten Wechselwirkungen bereitshier möglichst exakt berücksichtigt: Zunächst wurde das verwendete globale Atmosphärenzirkulations-ModellECHAM in seiner neuesten Generation an ein optimiertes Vegetationsmodellgekoppelt. Weiterhin ist ein globaler Aerosol-Datensatz implementiert, der eine realistischeAerosolkonzentration für ein <strong>zu</strong>künftiges Klima berücksichtigt. Die Ergebnisse analysierter Klimaläufe,die mit beobachteten Meeresoberflächen-Temperaturen und See-Eis Konzentration
70IMPETUS Subproject AB1angetrieben wurden, zeigen trotz einer <strong>zu</strong>r Originalversion reduzierten horizontalen Auflösung(T63 -> T42) eine deutliche Verbesserung in der Wiedergabe beobachteter Niederschlagsmuster.Bekannte Korrelationen zwischen gefallenem Niederschlag und beobachteter Meerestemperaturwerden ebenso wiedergegeben, wie auch die räumliche Niederschlagsvariabilität. Die globalenKlimasimulationen mit ECHAM wurden in einem Ensemble-Modus durchgeführt. In der regionalenKlimamodellierung mit REMO ist es gelungen, Eigenschaften der Monsunzirkulation detailgetreuerund realistischer ab<strong>zu</strong>bilden, als es in den bisherigen Regionalklimamodellierungenmöglich war. Insbesondere konnten die in der Zukunft erwarteten anthropogenen Änderungender Landoberfläche berücksichtigt werden. Auch die transienten regionalen Klimamodellierungenwurden im Ensemble-Modus für den Zeitraum 1960-2000 und für die IPCC SRES-SzenarienA1B und B1 des Zeitraumes 2000-2050 gerechnet. Mit Hilfe dieser Klimaprognosen ist eine Abschät<strong>zu</strong>ngder modellinternen Variabilität (die <strong>zu</strong>mindest mit der natürlichen Klimavariabilitätverknüpft ist) und der Unsicherheit durch den Antrieb auf regionaler Skala möglich. Mit Hilfeder Fernerkundung von Satelliten konnten in den Tropen Westafrikas raum-zeitlich hochauflösendeNiederschlagsklimatologien für die Jahre 2002-2005 erstellt werden. Die Methodik wurdefür den Einsatz im laufenden Niederschlagsmonitoring entwickelt, das die Grundlage für einNiederschlags-Informationssystem in der dritten Phase von IMPETUS bildet. Ein äußerst wertvollesNebenprodukt der Validierungsarbeiten für diese Daten war die Erstellung von Niederschlagsklimatologienfür den Zeitraum 1921-2004, welche durch eine einmalige Zusammenarbeitzwischen EUMETSAT, dem AMMA-Projekt, dem beninischen Wetterdienst DMN undIMPETUS auf der Basis einer extrem umfangreichen Datenbasis möglich war. Die Niederschlagsklimatologiensind u. a. <strong>zu</strong>r Modellevaluierung von unschätzbarem Wert.SummarySubproject AB1 contains progress in atmospheric science which is relevant for both areas ofinvestigation: Benin and Morocco. The present study is divided in three parts: global climatemodelling using the ECHAM model (AB1-1), regional (synoptic-scale, continent-wide) climatemodelling using REMO, and rainfall monitoring using satellite based remote sensing. The modelhierarchy in IMPETUS – from the global scale (ECHAM) to the local scale (FOOT3DK) – hasthe advantage of capturing scale interactions by the application of dynamical-statistical downscalingtechniques. Since the global model ECHAM plays an outstanding role in describing theforcing of climatic change, relevant forcing and feedback mechanisms are realized in thatmodel: First, the global circulation model ECHAM has been coupled to an improved vegetationmodel. Secondly, a global aerosol emission data set has been implemented in order to representaerosol concentration also for future climates in a more realistic way. Control simulations of thepresent day climate driven by observed SST and sea-ice cover reveal an improvement of representingpatterns of rainfall variability in tropical Africa, although the grid resolution of ECHAMhas been reduced from T63 to T42. Observed teleconnection patterns between SST and rainfallin tropical Africa are represented sufficiently as well as spatial patterns of rainfall variability.Global climate simulations with ECHAM have been carried out in an ensemble mode. Concerningthe regional climate modelling with REMO, the Monsoonal circulation over West Africacould be simulated in a more realistic and more detailed way compared with former attempts ofregional climate modelling over West Africa. Particularly, anthropogenic land cover changes
Subproject AB1 IMPETUS 71could be included into future climate scenarios for Northern and Tropical Africa. Transient regionalclimate simulations have been undertaken in an ensemble mode with REMO for the period1960-2000 and for the IPCC SRES scenarios A1B and B1 for the period 2000-2050. Usingthese climate simulations, an analysis of model related variability (at least somewhat comparableto natural variability) and uncertainty imposed by the regional scale forcing of future climatescenarios is possible. The progress in the application of new techniques in satellite based remotesensing of rainfall in tropical West Africa allowed to compute very high resolution rainfall patternsin both space and time for the years 2002 to 2005. The rainfall detection techniques weredeveloped for the application in rainfall monitoring, which will be the basis of a rainfall informationsystem in the third phase of IMPETUS. A very valuable and helpful by-product of thevalidation is a new precipitation climatology for the period 1921-2004, which is based on anextensive data base made possible by a unique cooperation between EUMETSAT, the AMMAproject, the weather service of Benin (DMN) and IMPETUS. These rainfall climatologies are ofvery high value for the evaluation of atmospheric models.In the following, results of the IMPETUS research in AB1 for the three workpackages AB1-1,AB1-2 and AB1-3 are described.Workpackage AB1-1: Evaluation of global climate scenarios with ECHAM and assessmentof the impact of external forcing on climate variability in Northwest- and West-Africa.ProblemPhysical processes of the climate system are interacting on different time- and spatial scales. Inparticular, the interactivity of the different scales in the lower latitudes is pronounced, becauselarge scale processes of the general circulation, the inner tropical convergence zone and globalteleconnections interact highly with local structures, like land use. A very impressive examplefor this is the annual to decadal scale of the precipitation variability over West Africa (Fig. AB1-1), which is forced primarily by the tropical sea surface temperature (SST) and, secondly, amplifiedby the interaction with vegetation cover and soil moisture. For the overall analysis physicalprocesses on timescales starting from some hours (thunderstorms, squall lines) up to some decades(e. g. the influence of an anthropogenic forcing) have to be taken into account.a)2.0b)Central Sahel West Sahel c)1.5Fig. AB1-1:1.00.50.0-0.5-1.0-1.51950196019701980Observed precipitation variability (b+c) calculated for different regions over West Africa (a) usingthe standardized precipitation index developed by Landsee (see text)To handle this difficult scale interactivity, a hierarchy of atmospheric models was developed tocatch all important key-factors on different time and spatial scales. The global circulation modelECHAM was used to describe the global scale forcing of the model chain on the top. To get a19902000195019601970Guinea Coast1980199020002.01.51.00.50.0-0.5-1.0-1.5
72IMPETUS Subproject AB1most reliable version of the ECHAM model, the fifth generation ECHAM5 (Roeckner et al.,2003) was used and extended by the simple vegetation model SVege. Using this combination ofthe two models the results can easily be compared to the integrations of ECHAM within theIPCC 4AR, because the differences of modelling the African Monsoon system are directly associatedwith the influence of the used vegetation module. Furthermore, the improvements fromversion 4 to 5 result from using a new long wave radiation scheme, a new cloud microphysicalscheme and a prognostic-statistical cloud cover parameterization. The number of spectral intervalsof the radiation parameterization is increased in both the long wave and the shortwave partof the spectrum. Also changes in the land surface representation have been made and a new datasetof land surface parameters has been compiled (Hagemann et al., 2002). Our model frame isalso coupled to a prescribing aerosol distribution to model possible future trends as realistic aspossible (Boucher et al, 2002).The work within the second phase of IMPETUSThe original version of the Simple Vegetation Model (SVege) has been introduced by Zeng et al.(1999) and was once implemented to the former version of the ECHAM model (Schnitzler et al.,2001). The idea of the vegetation scheme is to change the albedo with respect to the plant availablegroundwater and is restricted to the non boreal areas (40°N to 40°S). In the IMPETUS versionof ECAHM 5, the vegetation model is also restricted to areas with a vegetation cover lowerthan 10%. With this restriction it is possible to conserve the detailed albedo pattern within thenew land surface dataset (Fig. AB1-2).Fig. AB1-2:Annual mean of the planetary albedo for (a) the standard ECHAM5 version without vegetationmodel, (b) with implementation of the standard version of the SVege vegetation model and (c) as(b) but restricted to areas with more than 10% vegetation coverage.By using this vegetation model the annual cycle of the Albedo follows the rainy seasons and themagnitude of the annual cycle weakens from the wet coast to the drier northern regions (Fig.AB1-3). Because annual cycle and meridional gradient of the planetary albedo is well knownfrom observations, it can be assumed that the climate greenhouse gas integrations are more realisticwith respect to the area of interest and the water cycle.
Subproject AB1 IMPETUS 730.400.300.200.10West Sahel Central Sahel Guinea CoastJanFebMrzAprMaiJunJulAugSepOktNovDezFig. AB1-3:Annual cycle of the multiyear mean of the planetary albedofor different regions of the area of interest.While the climate integrations of the IPCC 4AR are calculated with a spatial resolution of T63and 31 vertical levels (T63L31), the horizontal resolution for the IMPETUS scenarios is reducedto T42 because sub continental effects shall be represented by the regional climate models withinthe Model hierarchy. As the area of investigation is dominated by the large scale pattern of theITCZ and the three dimensional structure of the African monsoon is the most important steeringmechanism for precipitation, it is expected that the chosen resolution is the best compromise tocover important physical mechanisms of the atmosphere (see also Roeckner et al., 2006) and tominimize the computational effort for the climate integrations. Different experiments (Tab.AB1.1) for simulating present and future climate have been carried out on different HPCs (SUNand NEC). In order to evaluate the new model version in representing actual climate and to obtainthe vegetation-albedo feedback, two 50 years (1950 to 1999) experiments driven by observedSST with and without the vegetation module have been carried out. For future climatechange studies, the moderate A1B and the B1 scenario member of the IPCC SRES family (SpecialReport on Emission Scenarios) have been selected to run the 240 years greenhouse gas experimentsstarting 1860 with pre-industrial GHG forcing up to the year 2100. Within these experimentsthe time slice from 1860 to 1999 has been produced once (same forcing within theA1B and B1 scenario) and is called 20C (climate for the 20 th century). Starting with year 2000the two different scenarios have been carried out. Instead an interactive coupled atmosphere –ocean model all experiments use a prescribed ocean dataset. All integrations are carried out withthree ensemble members for separating the climate variability from its internal one.Tab. AB1.1:InternalNameOverview of the different experiments with ECHAM 5 designed within the IMPETUS project(resolution: T42L31)External GHGForcingSST Start EndVegetationModuleHPC1 AMIPs No observed 1950 1999 Yes SUN 32 AMIP No observed 1950 1999 No NEC 33 20 C3 A1B A1B4 B1 B1(since 1990A1B)ECHAM5-OM-1 20CECHAM5-OM-1 A1BECHAM5-OM-1 B11860 1999 Yes SUN 32000 2099 Yes SUN 32000 2099 Yes NEC 3Number ofrealizations
74IMPETUS Subproject AB1For an evaluation of the actual model version and to acquire changes imposed by SVege, themost important key variable precipitation is analysed by generating a standardized mean area⎛⎞precipitation index developed by Landsea (1992) ⎜ ⎛⎞Index = ⎜⎟ ⎟⎜ ∑ RR i− CLIMJJASσJJAS. The⎟⎝ ⎝ JJAS⎠ ⎠base period for climatologically mean is 1950 to 1990. The focus is set to three different regionsand the main rainy period June to September (Fig. AB1-4). The benefit in analysing this precipitationindex is to identify dry and wet periods easily and to compare the results to observationaldata (e. g. CRU, VasClimO). Because the AMIP and AMIPs runs represent the actual climatestate driven by observed SST, a correlation analysis confirms the models ability to reproduce theformer dry and wet spells (Fig. AB1-4). It reveals that for all regions the positive correlationindex is higher using the model with the coupled vegetation module – even some correlationsbetween time series of the standard ECHAM5 model version and the observations point out anegative correlation index (not shown).standardisierte Abweichungen3210-1-21956Fig. AB1-4:West SahelCentral Sahel1961196619711976198119861991R=0.27R=0.3319963210-1-2standardisierte Abweichungen543210-1-21956Guinea Coast1961196619711976198119861991R=0.21Landsea’s precipitation index and its 11 years running mean for the West and Central Sahel (left)and the Guinea Coast (right). The filled boxes are the result of the climate model and the empty onesrepresent the result of the index for the observational data (CRU, New et al,). The correlation indexof the time series is given as well.1996543210-1-2The pattern of the spatial distribution of the JJAS (June to September) precipitation amount isclose to the observed climatologically mean. The most significant difference is a systematic underestimationof the precipitation of the coastal region with up to 200 mm (Fig. AB1-5).a) Observation (CRU) b) ECHAM5.3, AMIP+SVege c) (b) minus CRUFig. AB1-5:Observed (a) and modelled (b) spatial distribution of June to September (1961-1990) precipitationamount [mm] and the differences (ECHAM 5 coupled to the vegetation mode and using observedSST data.
Subproject AB1 IMPETUS 75250200150unimodal1005001 2 3 4 5 6 7 8 9 10 11 12250200250150ECHAM5.3+SVegeObservations (CRU)200150100501005001 2 3 4 5 6 7 8 9 10 11 12bimodalFig. AB1-6:01 2 3 4 5 6 7 8 9 10 11 12A comparison of the climatological mean annual cycle of the monthly precipitation amount [mm]between the observational and modelled data (1961-1990).The comparison of the mean annual cycle between the GCM results and the observations pointsout that the model is able to reproduce the strong gradient from the wet coast to the dry Sahelianregion by simulating the bimodal (south) and the unimodal (north) distribution for the differentregions (Fig. AB1-6). This analysis also demonstrates the deficiencies of capturing the maximumprecipitation amounts in the summer months, especially in July to September.An EOF analysis of the spatial variability of observed precipitation generates two dominant patterns(EOF 1 and EOF 2, Fig. AB1-7) describing together nearly 60% of the variability (Baderand Latif, 2003). The first EOF shows the north-south gradient with the wet coast and the drySahelian region, the second one points out an east-west gradient. Similar patterns with nearly thesame explained variance are retrieved by using the model data carried out by the AMIPs run.These patterns again show the ability of the coupled model in reproducing the spatial variabilityof precipitation.2NEOF 1: EOF 2:35% 31%10N18N18W 9W 0 9E 18W 9W 0 9EFig. AB1-7:Empirical orthogonal functions 1 (left) and 2 (right) for West Africa derived form the model studyECHAM5+SVege and prescribed SST data for the time period 1961 to 1990.
76IMPETUS Subproject AB1Fig. AB1-8:Correlation pattern of the modelled area mean monsoon precipitation amount (box) and the SSTfor the costal region (left) and the central Sahel (right) for the years 1961 to 1990.Sensitivity studies analysing teleconnection patterns between SST and precipitation of differentkey areas of west and central Africa expose a high correlation of precipitation amounts betweenthe rainfall on the coastal regions and the SST of the guinea coast (Bader and Latif, 2003). Theprecipitation amount of the central Sahel is mainly correlated to the Indian Ocean. These teleconnectionpatterns can also be reproduced by the analysis of the AMIPs data (Fig. AB1-8).The analysis of future climate scenarios A1B displays an increasing standard deviation of themonsoon precipitation sums (June to September, Fig. AB1-9). This means an increasing numberof extreme dry and wet years with a high year to year variability.43210-1-2-3-4a) b)West SahelCentral Sahel18551870188519001915193019451960197519902005202020352050206520802095210+ -1+ -26420-2-418551870Guinea Coast1885190019151930194519601975199020052020203520502065208020953210+ -1+ -2standard deviation (11yr)Fig. AB1-9:Landsee precipitation index (columns) for the key areas (Sahel (a) and Guinea Coast (b)) based onthe scenario A1B of the ECHAM5+SVege study. The lines represent the 11 year running mean,the shaded areas points out the standard deviation of the precipitation index based on 11 year periods.The evaluation of the key variable “precipitation” simulated by the global circulation modelECHAM 5 shows, that there are some deficiencies in representing observed precipitationamounts and simulating dry and wet seasons (not shown). The new model version of ECHAM 5developed within the IMPETUS project, which is coupled to a simple vegetation model, capturessufficiently the sequence of dry and wet periods. In comparison to observed precipitation – SSTcorrelation patterns there is also a realistic and satisfying reproduction of the actual climate.Therefore, the model combination ECHAM5 + SVege seems to be more realistic in modellingfuture climate trends.Even though there are improvements in simulating the African Monsoon system it is planned toadvance the model by an exchange of the Tanre aerosol climatology (Tanre et al, 1984) and toinclude an new aerosol climatology (Tegen et al., 1997) to get an improved reproduction of theAEJ (Tompkins et al., 2005) and to capture the physical mechanisms.
Subproject AB1 IMPETUS 77Workpackage AB1-2: Sensitivity of the northwest- and West African precipitation withrespect to changes in global radiation-budget and in continental land cover-characteristicsProblemThe availability of freshwater from precipitation is an essential factor in agricultural productionund food-security in Benin. As far as we know, there are barely any operational systems to predictthe amount of precipitation on seasonal timescale in tropical West Africa. Seasonal forecastsare a precondition for short-range-planning in agriculture. On the other hand, also long-term climaticchanges will have effects on the agrarian potential. So there have to be created quite realisticscenarios of climate-change in West Africa to develop middle- and long-term-strategies onregional scales for an adaptation of agricultural production to climatic boundary-conditions forthe next decades.AimsIn this workpackage, regional climate scenarios under changing greenhouse gas concentrationsand anthropogenic vegetation changes were conducted. Since early 2006, scenario-runs withREMO up to the year 2050 have been finished. The regional climate scenarios contain increasinggreenhouse-gas concentrations and land-use change in tropical Africa and describe a preferablyrealistic future scenario of African climate. Two scenarios, a strongly and a weakly disturbedone, were realized in transient model simulations in ensemble-mode in order to enable the estimationof natural climate variability – represented by model internal variability – and forcingrelated climate variability. The knowledge of the impact of land use changes allows us to showup the range of scope for political interaction.As a second goal, the regional climate model REMO, nested in global predictions of theECHAM model, was prepared to serve as a tool for seasonal precipitation forecast. In the thirdphase of IMPETUS, the implementation of the operational precipitation forecast for the upcomingrainy-season and the communication of the results to actors in agricultural production areplanned. The system developed in the second phase of IMPETUS is based upon global and regionalclimate-model simulations that were fitted to existing observational data of precipitationto improve the reliability of simulated data. In the near future, this system should be implementedtechnical-operational, e.g. at the Beninian weather service in Cotonou. In addition, theforecasted variables have to be customized to the requirements of agricultural actors, includingan appropriate communication system to reach local decision makers.Work in the second phaseIn the second phase of IMPETUS, different types of simulations were accomplished withREMO. First, a 25-years simulation of the present day climate in 1979-2003, embedded in ERAreanalyses and ECMWF analysis data was undertaken to evaluate the REMO climate predictions.After that, as a preliminary substitute for transient climate simulations, time slices of eachone year between 2000 and 2025 have been calculated for every five years (i.e. 2000, 2005,…2025).
78IMPETUS Subproject AB1In the 1979-2003 simulation, the model is proved as very reliable (Paeth et al. 2005a) and delivereda lot of input-parameters for following analyses with hydrological and agro economicalmodels. A weak point of REMO came out in a systematical underestimation of sub-sahelian precipitationamount. A lot of climate-models, even with high resolution, tend to underestimatedaily rainfall events, what leads to wrong results in hydrological modelling of runoff and erosionrates. Because of the central position of REMO in the forecast-approach for agriculture on seasonaland long-term timescales, these deficiencies had to be reworked. Different modifications ofmodel-parameters did not lead to satisfying results in precipitation data, because a grid-box asreference unit in models is not comparable to station-data. Hence, a statistical algorithm wasdeveloped to correct this bias (Paeth 2005b) fitting the model-output to observed characteristicsof daily and monthly precipitation sums. The daily variability of precipitation sums is conservedto keep the model-dynamics consistent. The resulting corrected year- and day sums of precipitationin West-Africa appear much more realistic than the original values from REMO (Fig. AB1-10).The preliminary scenario time slices were corrected similarly, assuming the amount for correctionto be constant in the near future. With these corrected data it was possible to run a model ofsoil erosion (SWAT) successfullyBeobachtungenREMO originalREMO korrigierttägl. NiederschlagJahresniederschlagM O S.Fig. AB1-10:Improving of REMO simulated precipitation using a calibration-algorithm (MOS) for monthlyand daily precipitation sums. Left panel: observational rainfall data. Middle panel: originalREMO predictions. Right panel: MOS-corrected REMO predictions. Upper panels show theannual precipitation sum, bottom panels the mean daily precipitation only in grid boxes containingobservational data.
Subproject AB1 IMPETUS 79At the beginning of the second project phase, several sensitivity-studies were set up with REMOto estimate the global and regional key-factors for climate-fluctuations and -changes in tropicaland northern Africa (Paeth, 2004). The prominent role of sea surface temperature, which is oftendetected by model-experiments (e.g. Bader and Latif, 2003; Giannini et al., 2003; Paeth andFriedrich, 2004), has been reproduced by REMO on a synoptical scale (Paeth and Hense, 2004).Additionally, greenhouse-gas concentrations play an important role generating a slight increasein summer-monsoon precipitation over tropical West-Africa along Guinean-coast and much drierconditions in Sahel and Congo-basin (Paeth and Stuck, 2004; Paeth and Hense, 2005b). On theother hand, a comparing model-study with different global climate-models, ensemble-runs andIPCC-emission scenarios indicated major differences between the single simulations (Paeth etal., 2005b), that could not be reproduced with REMO due to lack of computational resources.Another central influence is given with the manmade changes in land coverage (Paeth, 2005a).In addition to deforestation and agricultural capacitation in tropical Africa degradation has a majorrole, too (Osborne et al., 2004). Results from these sensitivity-studies were combined to acomplexe climate-change scenario with increasing greenhouse-gas, loss of vegetation and degradation.In 2005, analysed time slice-experiments with REMO between 2000 and 2025 confirm the instanceof counteractive measures (Paeth and Thamm, 2005): Simulated precipitation decreases inmost parts of sub-Saharan Africa several 100mm per year. At the same time reduced evaporationand an increasing sensible heat-flux leads to a near-surface heating of up to 5°C. Extreme valuesof temperature could increase even more and enforce the heat-stress dramatically. The spatialpattern of simulated climate-changes and the physical mechanisms of action suggest that degradationcould play a major role for the future climate until 2025 than increasing greenhouse-gasconcentrations. From these results, for states in tropical West-Africa there is a scope for climatepreventionreducing degradation and saving natural vegetation (Kueppers et al., 2004).As another interaction in tropical Africa aerosol-effects from burned bio-mass can be taken intoaccount. During the dry-season the worldwide maximum of aerosol emissions is recorded overthe subregions of the African continent (Feichter et al. 2004). A comparative study of global climate-modelscontaining an enhanced aerosol scheme examined the impact on the main characteristicsof African climate (Paeth and Feichter, 2005). On the one hand, enhanced aerosol emissionslead to decreased temperatures that counteract the greenhouse gas- and vegetation-inducedwarming. On the other side, the hydrological cycle experiences another weakening of about 100to 200mm in sub-sahelian Africa.These findings indicate that the implementation of these two components – aerosol scheme andinteractive land-coverage – into REMO might enhance the reliability of climate scenarios. Theimplementation is planned as secondary work during the third phase of IMPETUS.With respect to prediction on seasonal timescales some preliminary work has been undertaken.The statistical model (MOS) described in Paeth and Hense (2003) was expanded with threedimensionaldynamical predictors and several other regions in lower latitudes. Furthermore, atechnique to arrange predictors in groups in order to ensure the orthogonality of the predictedtime series and to enable a more robust estimation of predictability was developed (Paeth et al.,2005c). The explained variance of the stepwise multiple regression models is plotted in Fig.
80IMPETUS Subproject AB1AB1-11 for six subregions of Africa. Red points mark the optimal number of predictors estimatedfrom cross validation.Fig. AB1-11:Forecast-potential of seasonal precipitation during rainy season in chosen regions ofAfrica. The red point marks the optimal number of predictors resulting from stepwisemultiple regressions and cross validation.Using this combined statistic-dynamical approach, the predictability of interannual rainfallvariabilityin rainy seasons reaches between 26% (Southeast-Africa) and 60% (East-Africa).Compared to the classical approach of super ensemble-forecast (Krishnamurti et al., 1999, indicatedas FK in Tab. AB1.2), the applied MOS not only generates a much larger explained variance.Compared to a simple approach of using averages, it also improves the forecast precision,as the Brier skill score (von Storch and Zwiers, 1999) demonstrates (Tab. AB1-2).Tab. AB1.2:Improvement of forecast-potential using the described statistic-numerical approach compared toclassical super ensemble-forecast after Krishnamurti et al. (1999), calculated with the explainedvariance of the multiple regression-model and the Brier skill score (von Storch und Zwiers 1999)
Subproject AB1 IMPETUS 81In some regions, only the MOS-approach leads to a predictability of the following rainy season.That applies for the Sahel and Central-America, where the simulation of precipitation is deficientalthough dynamical variables are in phase with observed precipitation. Climate-model simulationsand extrapolation of sea-surface temperatures (Colman and Davey, 2003) needed for operationalforecast will be realized in the third phase of IMPETUS-project.As basis to estimate the long-term potentials and risks in agriculture, continuous climate modelsimulationswere calculated with REMO. They were set up referring to the sensitivity-studies runin 2004 and 2005, to the scenario-simulations including 1979-2003 and to the time-slices up to2025 on the supercomputer at the “Deutsches Klimarechenzentrum” (DKRZ) in Hamburg. Theruns were driven by ECHAM5/MPI-OM-data with a forcing of increasing greenhouse-gas concentrationand lead to a simulation of the typical changes in sea-surface temperature and globalcirculation for the REMO area. Carried out as an ensemble model study, these model simulationscomplete our future-scenario for the first half of the 21 st century.Each ensemble consists of 3 runs from 1960 to 2050 following the guidelines from IPCC-reportfor A1b- and B1-scenario. Furthermore, Dr. Kai Born (B1) performed high-resolution scenariosof land-use changes in Africa that base originally on the FAO-assessment. Prearrangement, implementationand automation of the long-term REMO-runs demanded a high expenditure of timeand resulted in a data production of about 380 Gigabyte per day.As preliminary results we found remarkable, statistically significant changes in most features ofthe near-surface climate, especially a prominent surface heating and a weakening of the hydrologicalcycle over most of tropical Africa, resulting in enhanced heat stress and extended dryspells.Fig. AB1-12:Ensemble-mean linear trends of annual near-surface temperature and precipitation over land forscenario A1B. Only grid boxes with a significance of more than 95% are coloured.Until 2050, in the A1b scenario some parts of tropical Africa may warm by more than 3°C,whereas the heating ranges between 1.5°C and 2.5°C over northern Africa and southern Europe
82IMPETUS Subproject AB1(Fig. AB1-12). Simultaneously, the annual rainfall sums decrease by ca. 100mm in the southernSahel zone and up to 500mm in the Congo Basin. The Mediterranean region is drying as well.Compared with the present day total amounts, this decrease is equivalent to 20-25% in most ofsub-Saharan Africa.During the seasonal cycle, the warming signal is mot pronounced during the dry season (Nov-Mar), while the strongest rainfall reduction is related to the rainy season. The B1 scenario leadsto slightly reduced trends, especially with respect to temperature.There is some indication that land use changes are primarily responsible for the simulated climateresponse, the exact proportion still has to be calculated. The climate changes mainly standout from internal variability, even at the scale of grid boxes. The results also suggest that there isa limited but existing scope of action at the level of national and regional policy.Workpackage AB 1-3: Satellite-based precipitation monitoringAimsThe main focus of workpackage AB 1-3 during the second phase of IMPETUS was to create aprecipitation monitoring method which provides timely high resolution full coverage rainfallestimates. This was achieved by temporally interpolating passive microwave (PMW) rain measurementsfrom a total of 8 low earth orbit satellites using geostationary infrared images. Thedata-merging method for the multi-sensor satellite product is based on 2 existing techniques(morphing and probability/histogram matching) which were unified in a new algorithm developedentirely by IMPETUS sub-project AB 1-3.Work in the second phaseEarly results showed that using only the probability matching data-merging method according toTurk et al (1999) in single rain episodes was ineffective with regard to the desired meaningfulvalidation of the satellite product, validation of models, and direct applications in climatology,agriculture and hydrology. On one hand the calibration of IR images with rain rates from passivemicrowave discards the structure of rain fields and adopts the structure of cloud tops, therebyalso discarding what was gained by the higher sensitivity of the IMPETUS PMW-algorithm.Therefore, a morphing routine was implemented (following Joyce et al., 2004) to conserve allinformation during PMW-platform overpasses, which also gave clear improvements in groundvalidation (Fig. AB1-13 and Tab. AB1.3). Furthermore, longer time series are necessary to assessthe performance of the satellite product because of the high variability of rainfall and thedependence of algorithm performance on the weather situation. Many of the ground measurementsused for validation had an unreliable timestamp (except CATCH and IMPETUS stations),and an aggregation of at least 5 days was necessary to compensate. Due to these constraints thetime coverage was expanded to continuous periods of 4 months (June to September) for the years2002 to 2005, which went far beyond the original work plan. The expansion to long time seriesbecame possible in 2005 because of improvements in the online archive systems of EUMET-SAT, NSIDC, NASA, and NOAA.
Subproject AB1 IMPETUS 83Fig. AB1-13:Correlation (right), and root mean square deviation (left) of 10-day accumulated ground measurementsand satellite products in the Sahel. Performance of the data-merging algorithm using bothmorphing and probability matching is shown in red to purple, the performance of only probabilitymatching in green, and the GPCP product in blue. Comparisons were made in different spatialresolutions: Point synop-measurements against the corresponding Meteosat-7 Pixel (=5x5 km²area), and a spatial aggregation in 0.5° and 1° resolution.Tab. AB1.3a:Comparison between monthly sums from satellite product and kriging-product in Benin (June-September 2002, 0.1° resolution)0.1° Benin correlation bias [mm] rmsd [mm]morphing+PM 0.62 9.21 61.31Probability matching 0.55 5.55 65.38MIRA 0.51 9.92 87.11Tab. AB1.3b:Comparison between monthly sums from satellite product and kriging-product in Benin, takingonly 50% of pixels with lowest kriging error into account.0.1° Beninlow kriging variancecorrelation bias [mm] rmsd [mm]morphing+PM 0.73 -8.78 54.78Histogram method 0.65 -10.44 61.88MIRA 0.54 0.15 87.82Tab. AB1.3c:Comparison between satellite products and GPCC in 1 ° resolution1° West Africa correlation bias [mm] rmsd [mm]morphing+PM 0.54 13.21 109.71Histogram method 0.53 10.13 109.64MIRA 0.52 16.92 122.43
84IMPETUS Subproject AB1In addition to the originally planned network of passive microwave sensors TMI, AMSR-E, and3 SSM/Is, the AMSU-B sensors aboard the NOAA 15, 16, and 17 platforms were also includedin a 2 year (2 times 4 months) test period, as they improve the temporal sampling of passivemicrowaverain-estimates considerably. The performance of the existing AMSU-B algorithms(Weng et al., 2003) over West Africa was disappointing as none were optimized for this region,and were thus replaced by a simple algorithm based on the 89 GHz brightness temperature depressioncalibrated by the other PMW rain estimates. The inclusion of these AMSU-B estimatesin the monitoring system improved “rmsd” and correlation of the monthly accumulationsslightly. Further tests will decide whether the AMSU-B sensor should be included operationally.In preparation for the future use of cloud parameters for better identification of raining clouds,the “Advective-Convective-Technique” (ACT) algorithm (Nauss et al., 2004; Reudenbach andBendix, 2005) was adapted by project partners (Boris Thies and Thomas Nauss of GLOWA Danube)for the West African region using radiosonde soundings provided by IMPETUS subprojectA1. A comparison of the IMPETUS PMW-algorithm and the ACT estimates with theTRMM precipitation radar showed a good performance of the ACT in Bias, and the expectedbetter general performance of the PMW estimates (Thies et al., 2005). However, the IMPETUSPMW algorithm developed in the first phase showed a regional systematic bias (depending onmoisture gradients from the west African coast to the Sahel), which is attributed to the enhancedevaporation of rain in dry air, as well as cloud microphysics and drop size distributions that varywith aerosol density. A similar bias has been found in the TRMM GPROF PMW precipitationalgorithm (Furuzawa and Nakamura, 2005), and the investigation of the relation to climatic factorsis planned together with project partners in the AMMA and IRD. At this stage single rainseasons have been calculated with several existing PMW algorithms (TMI, AMSR-E, SSM/I:IMPETUS PMW algorithm, GPROF/GSCAT, Ferraro Marx, AMSU-B: operationalNOAA/NESDIS, simplified IMPETUS algorithm optimized over West Africa). The extensiveperiod of 2002 to beginning 2006 has been calculated using TMI, AMSR-E, and SSM/I in a homogenousdataset consisting of operational PMW algorithms of NOAA/NESDIS (due to easieravailability).The resulting satellite-based precipitation products have been validated thoroughly using highresolution CATCH and IMPETUS ground measurements (30-minute to daily accumulations),and also 10-day to 4 months accumulations in Benin and West-Africa. In this task the cooperationwith EUMETSAT (AMPE project), DWD (GPCC project), AMMA (precip-AMMA groundvalidation using AGRHYMET products), the DMN and IMPETUS sub-project A1 (groundmeasurements in Benin) has led to a unique validation base regarding rain in West-Africa andparticularly Benin. The ground validation measurements consisted of:• the global raw daily input station measurements of 2004 used in the GPCC product (courtesyof Bruno Rudolf in cooperation with the AMPE project)• 80 filtered synop stations and a kriging-product including 800 ground measurements inthe Sahel (provided by Abdou Ali in cooperation with precip-AMMA)• About 130 daily and high resolution CATCH and IMPETUS measurements in Benin(provided by Andreas Fink, Volker Emert, and Susan Pohle in cooperation with the DMNand IRD)• A 0.1° resolution monthly precipitation climatology in Benin based on kriging of allground measurements (Fig. AB1-14)
Subproject AB1 IMPETUS 85Fig. AB1-14: Precipitation climatology for Benin based on a 0.1° resolution monthly kriging-product.The last product has been expanded for the years 1921 to 2004 and made available in theIMPETUS database. An extensive internet website representing this climatology has been madeaccessible in English, German, and French at the locations>http://www.impetus.uni-koeln.de/content/ab1/tp-ab1-3-stat_en.htmlhttp://www.impetus.uni-koeln.de/content/ab1/tp-ab1-3-stat.htmlhttp://www.impetus.uni-koeln.de/content/ab1/tp-ab1-3-stat_fr.htmlThe IPWG precipitation verification project (www.bom.gov.au/bmrc/SatRainVal/validationintercomparison.html)does not include Africa because of the difficult situation of referenceground measurements, and thus the performance of 2 other satellite products has been comparedto that of the IMPETUS multi-sensor satellite precipitation product.1. The first is the GPCP product (comparison depicted in Fig. AB1-13), which is produced operationallywith 1 degree spatial and 1 day spatial resolution. On the scale of 10 day accumulations,the GPCP slightly outperforms the IMPETUS product in terms of correlation andrmsd. However, it should be pointed out that the GPCP product also includes ground measurementsthrough the GPCC analysis (some of which are also in the ground validation dataset).In contrast to this the IMPETUS product has up to this point been totally independent ofany ground observation, and numerous parameters (such as weighting between morphing andhistogram matching, accumulation time and space for histograms) have till now only beenadjusted intuitively and can still be optimized after ground validation. Additionally the resolutionof approximately 5 km and 30 minutes of the IMPETUS product is suited for a greatervariety of applications than that of the GPCP product, which is of practically no use in hydrologyand agriculture in Benin due to its coarse resolution.
86IMPETUS Subproject AB12. The MIRA daily rainfall product (Kidd et al., 2003) for Africa has a resolution of 0.1°, butwas outperformed by the IMPETUS product in terms of correlation and rmsd (Tab. AB1.3ac).This is not surprising since it only includes SSM/I passive microwave sensors and 2-hourly infrared images merged with histogram matching, and has not been validated withground measurements previously. Furthermore the fact that agreement with the highresolutionkriging climatology is notably higher in regions with low estimated kriging-error(Tab. AB1.3a and 3b) gives good confidence in the IMPETUS satellite product over the regionallysparse and sometimes unreliable ground measurements.The probability density function of daily rain accumulations given by the satellite product showsexcellent agreement with ground observations, and also reflects the different climatic regimes inBenin, making it well suited for applications in agriculture (Fig. AB1-15). The high resolutionrain rates (calculated for 30 minute accumulations), which are desirable for applications in hydrology,showed good agreement below 35 mm/h, but showed too few rain rates above this valuebecause the blending of passive microwave sensors with lower resolutions than 5 km (productresolution) required the introduction of artificial thresholds in order to keep the probabilitymatching unaffected by under-sampling of high rain rates. This problem, along with the problemof different correlation lengths of rain fields and cloud top, will be addressed by introducing astatistical downscaling module, which will increase the variance of the lower-resolution sensorrain estimates as well as of the calibrated-cloud-top infrared images.Fig. AB1-15:Left: Probability density function (pdf) of daily rain accumulations in Benin. The bold lines showthe region north of 8.5° latitude, the dashed lines the region south of 8.5° latitude, which is subjectto increased advection of moisture through the ocean. Black lines represent daily ground measurements,the green line represents daily accumulations given by the high qualityCATCH/IMPETUS stations, and the red lines show the satellite estimate. The pdf of daily accumulationsis well reflected by the satellite in the two different climatic regimes. Note that 90% ofthe precipitation is contributed by daily accumulations lower than 65 mm.Right: Probability density function (pdf) of mean rain rates in 30-minute intervals in the HVO,given for CATCH/IMPETUS measurements aggregated to 5 km resolution (black), uncorrectedsatellite product (red), satellite product corrected for systematic errors (purple), and the mergedsatellite/gauge product (blue). The cut off values of the raw satellite product result from artificialthresholds at 35 and 50 mm/h introduced in the probability matching routines because of undersamplingof high values. Note that 90% of the precipitation is contributed by rain rates below 35mm/h in 30-minute accumulations according to ground measurements aggregated to 5 km resolution.The high resolution satellite rain estimates have been made available in the IMPETUS Databasefor the West African region for the months June to September for the years 2002 to 2005, and for
Subproject AB1 IMPETUS 87May 2006. The comparison in the years 2002 to 2004 with ground measurements showed a systematicbias in Benin from southern coast to the dry north probably caused by increased evaporationof rain in dry air. In order to guaranty the highest possible data quality and usability for projectpartners, two secondary products including only the Benin territory were generated usingboth satellite and ground measurements. The first is corrected for systematic bias and “pdf” usingprobability matching and can be generated within one week delay (time for all PWM measurementsto become available) without ground measurements (Fig. AB1-15).The second includes allground measurements blended with the satellite estimates for small scale adjustments. Thisproduct can only be produced once ground measurements have arrived, which has taken up to 1year in the past. After cross validation (estimates produced with one half of stations and validatedwith the other half), this product is only recommended over the previous in the HVO region,where the high quality gauge measurements are situated.The results achieved in creating a satellite-based rain monitoring system for West Africa and inparticular for Benin, as well as in gathering an extensive ground validation database for the region,have widely surpassed the planning at the beginning of the second phase of IMPETUS bothin sophistication of the algorithms and in the extent of temporal coverage. The algorithms cannow be optimized further by using the ground validation database, which should be exploited tofull extent in the third phase. The X-Band ground-based precipitation radar, the Micro-rain-radar,disdrometer, ceilometer, and ground based passive microwave measurements that started 2005and 2006 will also be an invaluable tool for rain and cloud classification, and cooperation hasalready been arranged with the involved institutes. Through the AMPE project, the algorithmdeveloped and validated by IMPETUS sub-project AB 1-3 will be expanded to the entire field ofview of the MSG satellite, and has a good chance of replacing the relatively simple and nonvalidatedcurrent EUMETSAT multi-sensor precipitation product (MPE). This would greatlyfacilitate the installation of the monitoring system in Benin, as the algorithm and needed datastreamscould be implemented directly at EUMETSAT. The product can then be received directlyvia the MSG-receiver, and the small-scale bias adjustments made locally in Benin. Thealgorithms have been adapted to use the improved time/space resolutions of the new MSG satellite.Modules making use of multiple SEVIRI channels to discriminate non-raining clouds andare currently being implemented and tested. In a visit to the DMN in January 2006 some technicalissues regarding the installation, distribution and archiving of the data arriving through theMSG receiver have been discussed. The installation of a standard PC with DVD-writer which isconnected via local area network with the MSG-system at the airport of Cotonou is feasible andwill be supported and controlled independently by the DMN.
88IMPETUS Subproject AB1Literature:Bader, J. and M. Latif, 2003: The impact of decadal-scale Indian Ocean sea surface temperature anomalies on Sahelian rainfalland the North Atlantic Oscillation. Geophys. Res. Let. 30, 10.1029/2003GL018426.Boucher O., M. Pham, and C. Venkataraman, 2002: Simulation of the atmospheric sulfur cycle in the Laboratoire de MétéorologieDynamique General Circulation Model. Model description, model evaluation, and global and European budgets. Notescientifique de l’IPSL,(http://www.ipsl.jussieu.fr/poles/Modelisation/NotesScience/note23.html).Colman, A.W. and M.K. Davey, 2003: Statistical prediction of global sea-surface temperature anomalies. Int. J. Climatol. 23,1677-1697.Feichter, J., E. Roeckner, U. Lohmann and B.G. Liepert, 2004: Nonlinear aspects of the climate response to greenhouse gas andaerosol forcing. J. Climate 17, 2384-2398.Furuzawa, F.A., K. Nakamura. 2005: Differences of Rainfall Estimates over Land by Tropical Rainfall Measuring Mission(TRMM) Precipitation Radar (PR) and TRMM Microwave Imager (TMI) Dependence on Storm Height. Journal of AppliedMeteorology: Vol. 44, No. 3, pp. 367-383Giannini, A., R. Saravanan and P. Chang, 2003: Oceanic forcing of Sahel rainfall on interannual to interdecadal time scales.Science 302, 1027-1030.Hagemann, S, 2002: An Improved Land Surface Parameter Dataset for Global and Regional Climate Modelsand Regional ClimateModels. MPI-Report No. 336Joyce, R.J., J.E. Janowiak, P.A. Arkin, and P. Xie, 2004: CMORPH: A Method that Produces Global Precipitation Estimatesfrom Microwave and Infrared Data at High Spatial and Temporal Resolution. Journal of Hydrometeorology Vol. 5, 487-503Kidd, C.K., M.C. Todd, D.R. Kniveton, T.J. Bellerby, 2003: Satellite Rainfall Estimation Using Combined Passive Microwaveand Infrared Algorithms, Journal of Hydrometeorology, Vol. 4, No. 6, pp. 1088-1104.Krishnamurti, T.N., C.M. Kishtawal, T.E. La Row, D.R. Bachiochi, Z. Zhang, C.E. Williford, S. Gadgil, and S. Surendan, 1999:Improved weather and seasonal climate forecast from multimodel superensemble. Science 285, 1548-1550.Kueppers, L.M., P. Baer, J. Harte, B. Haya, L.E. Koteen and M.E. Smith, 2004: A decision matrix approach to evaluating theimpacts of land-use activities undertaken to mitigate climate change. Climatic Change 63, 247-257.Landsea C. W., W. M. Gray (1992): The strong association between Western Sahel monsoon rainfall and intense Atlantic hurricanes,Journal of Climate, 5: 435-453.Nauss, T., C. Reudenbach, J. Bendix, 2004 : Operational rainfall retrieval based on cloud microphyiscal properties. Proceedingsof the 2nd International Precipitation Working GroupNew, M., M. Hulme, and P. D. Jones. 2000: Global Monthly Climatology for the Twentieth Century (New et al.). Data set.Available on-line [http://www.daac.ornl.gov] from Oak Ridge National Laboratory Distributed Active Archive Center,Oak Ridge, Tennessee, U.S.A.Paeth, H. and A. Hense, 2003: Seasonal forecast of sub-sahelian rainfall using cross validated model output statistics. MeteorologischeZeitschrift 12, 157-173.Paeth, H. and A. Hense, 2004: SST versus climate change signals in West African rainfall: 20th century variations and futureprojections. Climatic Change 65, 179-208.Paeth, H. and J. Stuck, 2004: The West African dipole in rainfall and its forcing mechanisms in global and regional climate models.Mausam 55, 561-582.Paeth, H. and P. Friederichs, 2004: Seasonality and time scales in the relationship between global SST and African rainfall. ClimateDynamics 23, 815-837.Paeth, H., 2004: Key factors in African climate change evaluated by a regional climate model. Erdkunde 58, 290-315.Paeth, H. and A. Hense, 2005a: Mean versus extreme climate in the Mediterranean region and its sensitivity to future globalwarming conditions. Meteorologische Zeitschrift 14, 329-347.Paeth, H., K. Born, K.; R. Pod<strong>zu</strong>n and D. Jacob, 2005a: Regional dynamical downscaling over West Africa: Model evaluationand comparison of wet and dry years. Meteorologische Zeitschrift 14, 349-367.Paeth, H. and A. Hense, 2005b: On the linear response of tropical African climate to SST changes deduced from regional climatemodel simulations. Theoretical and Applied Climatology, DOI 10.1007/s00704-005-0138-z.Paeth, H. and J. Feichter, 2005: Greenhouse-gas versus aerosol forcing and African climate response. Climate Dynamics, inpress.Paeth, H., R. Girmes, G. Menz and A. Hense, 2005c: Improving seasonal forecasting in the low latitudes. Monthly WeatherReview, accepted.Paeth, H., 2005a: Potential implications of land degradation for African climate as simulated by a regional climate model. InternationalJournal of Climatology, submitted.Paeth, H. and H.-P. Thamm, 2005: Regional modelling of future African climate including greenhouse warming and land degradation.Climatic Change, submitted.Paeth, H., 2005b: Statistical postprocessing of simulated precipitation data for hydrological and climatological analyses in WestAfrica. Quarterly Journal of the Royal Meteorological Society, submitted.Paeth, H., A. Scholten, P. Friederichs and A. Hense, 2005b: Uncertainties in climate change prediction: El Niño-Southern Oscillationand monsoons. Journal of the Meteorological Society of Japan, submitted.Reudenbach, C., J. Bendix, 2005: Satellite Based Rainfall Retrieval with Meteosat, GOES, and MSG in the Mid-Latitudes andthe tropics. Proceedings of the 1st Workshop of the International Precipitation Working Group (IPWG), Madrid, Spain,available online at http://www.isac.cnr.it/~ipwg/meetings/madrid/madrid2002.html
Subproject AB1 IMPETUS 89Roeckner, E., G. Bäuml, L. Bonaventura, R. Brokopf, M. Esch, M. Giorgetta, S. Hagemann, I. Kirchner, L. Kornblueh, E.Manzini, A. Rhodin, U. Schlese, U. Schultzweida and A. Tompkins, 2003: The atmospheric general circulation modelECHAM5. Part I: Model description. Max-Planck-Inst. F. Meteor., Report No. 349. Hamburg.Roeckner, E., R. Brokopf, M. Esch, M. Giorgetta, S. Hagemann, L. Kornblueh, E. Manzini, U. Schlese, and U. Schulzweida,Sensitivity of simulated climate to horizontal and vertical resolution in the ECHAM5 atmosphere model, J. Climate, inpress, 2006.Schnitzler, K. G., W. Knorr, M. Latif, J. Bader, N. Zeng (2001): Vegetation Feedback on Sahelian Rainfall Variability in a CoupledClimate Land-Vegetation Model Max-Planck-Inst. F. Meteor., Report No. 329. Hamburg.Tanre, D., J.-F. Geleyn, and J. Slingo, 1984: First results of the introduction of an advanced aerosol-radiation interaction in theECMWF low resolution global model, in Aerosols and Their Climatic Effects, edited by H. Gerber and A. Deepak, pp.133-177, A. Deepak Publ. Hampton, Va.Tegen, I., P. Hoorigl, M. Chin, I. Fung, D. Jacob, and J. Penner, 1997: Contribution of different aerosol species to the globalaerosol extinction optical thickness: Estimates from model results, J. Geophys. Res., 102, 23,895-23,915.Thies, B., M. Diederich, C. Reudenbach, T. Naus, J. Bendix, J. Schulz, C. Simmer, 2005: Comparison of an optical and a microwaverainfall retrieval over North-Western Africa. Poster 2005 Eumetsat KonferenzTompkins, A.M., C. Cardinali, J.-J. Morcrette, M. Rodwell, 2005: Influence of aerosol climatology on forecasts of the AfricanEasterly Jet. ECMWF Technical Memorandum 455.Turk, F. J., G. D. Rohaly, J. Hawkins, E. A. Smith, F. S. Marzano, A. Mugnai, V. Levizzani, 1999: Meteorological applicationsof precipitation estimation from combined SSM/I, TRMM and infrared geostationary satellite data. In Microwave Radiometryand Remote Sensing of the Environment, ed. By P. Pamploni and S. Paloscia, VSP Int. Sci. Publ., 353-363.von Storch, H. and Zwiers, F.W., 1999: Statistical analysis in climate research. Cambridge.Wang, G., E.A.B. Eltahir, J.A. Foley, D. Follard und S. Levis, 2004: Decadal variability of rainfall in the Sahel: results from thecoupled GENESIS-IBIS atmosphere-biosphere model. Climate Dyn. 22, 625-637.Weng, F., L. Thao, R.R Ferraro, G. Poe, X. Li, and N.C. Grody, 2003: Advanced microwave sounding unit cloud and precipitationalgorithms, Radio Sci., 38(4) 8068, doi:10.1029/2002RS002679Zeng et al., 1999: Science, Vol 286, Issue 5444, 1537-1540.
Subproject A1 IMPETUS 91Teilprojekt A1Szenarien der raum-zeitlichen Variabilität von Niederschlag undVerdunstung auf der regionalen und lokalen SkalaScenarios of the spatio-temporal variability of precipitation andevaporation on the regional to local scaleAntragsteller / ParticipantsProf. Dr. P. Speth (Koordinator)Institut für Geophysik und Meteorologie,Universität <strong>zu</strong> KölnProf. Dr. M. KerschgensInstitut für Geophysik und Meteorologie,Universität <strong>zu</strong> KölnProf. Dr. C. SimmerMeteorologisches Institut, Universität BonnFach / DisciplineMeteorologie:Klimamodellvalidierung und KlimadynamikMeteorology:climate modelling evaluation andclimate dynamicsMeteorologie:Kleinskalige ModellierungMeteorology:small-scale modellingMeteorologie:Mesoskalige Modellierung/ FernerkundungMeteorology:meso-scale modelling / remotesensingZusammenfassungIn den Forschungsarbeiten der letzten Jahre <strong>zu</strong>m Thema lokale und regionale Modellierung vondynamischen atmosphärischen Prozessen, sowie der Erfassung von saisonalen Klimawerten imBereich Westafrika rückten neben der seit längerem dokumentierten Rolle der Meeresoberflächentemperaturender Ozeane (Folland et al., 1986; Fontaine et al., 1998; Bader und Latif2003) die Wechselwirkung von Landoberfläche und Atmosphäre immer stärker ins Zentrum verschiedenerBetrachtungen (Zhao and Pitman 2002, Koster et al., 2004, Osborne et al., 2004,Taylor et al. 2005). Zusammenfassend lassen sich die Aussagen der verantwortlichen Mechanismenwie folgt beschreiben: Die Variabilität der Schwankungen des akkumulierten Niederschlagsin Westafrika wird im wesentlichen durch die Anomalien der Meeresoberflächentemperaturder globalen tropischen und – etwas weniger bedeutsam – der extratropischen Ozeanebeeinflusst (Giannini et al., 2003). Diese Kopplung wird sekundär durch den Einfluss der lokalenund regionalen Vegetation moduliert (Wang et al., 2004; Sogalla et al., 2005). Das bedeutet,dass die Rückkopplung der jeweiligen Landnut<strong>zu</strong>ng auf den Niederschlag <strong>zu</strong> jeder Zeit die lokaleNiederschlagsbilanz ebenfalls beeinflusst. Dem<strong>zu</strong>folge wird der letztgenannte Effekt in den Regenzeitender Jahre, in denen der Einfluss der SST geringer ist, <strong>zu</strong>m maßgeblichen Faktor. DieRolle von Landnut<strong>zu</strong>ngsänderung, stellen insbesondere für dieses Teilprojekt im Rahmen derSzenarienberechnung in IMPETUS einen Forschungsschwerpunkt dar (Sogalla et al., 2005).
92IMPETUS Subproject A1Dabei sind die Einflüsse einzelner Bodengrößen je nach Modell und Skala unterschiedlich starkausgeprägt. In der letztgenannten Studie wird mit dem nicht hydrostatischen mesoskaligen ModellFOOT3DK festgestellt, dass der Anfangsbodenfeuchte beim Rückkopplungseffekt auf denNiederschlag die wichtigste Bedeutung <strong>zu</strong>fällt. Weniger bedeutsam – aber nicht vernachlässigbar- sind die Vegetationsbedeckung und die Albedo. Auf der lokalen Skala spielt die Rauhigkeitslängeeine eher untergeordnete Rolle. Der Blattflächenindex (LAI – „Leaf Area Index“)sowie der Sättigungsbodenwassergehalt zeigen keine nennenswerte Auswirkung auf den Niederschlag.Das Ergebnis von vielen Sensitivitätsstudien, in denen mit FOOT3DK dreidimensionalmodelliert wurde, lässt den Schluss <strong>zu</strong>, dass bei einer Reduktion von Bodenfeuchte und Vegetationsbedeckungder künftige Niederschlag einer vergleichbaren Episode in vielen Bereichen desModellgebietes rückläufig sein wird. Dies steht im Einklang mit ähnlichen Untersuchungen aufder kontinentalen Skala mit dem Regionalmodell REMO im Teilprojekt AB1 (z.B. Paeth, 2005a).Mit dem Lokalmodell des DWD (Deutscher Wetterdienst) wurden im Bereich Nordwest-Afrikasmehrere Experimente jeweils für die Jahre 2002 (0.25°-Gitter), 2000 und 2025 (0.1°-Gitter) gerechnet:Das Experiment, das auf einem 0.25°-Gitter für ganz Nordwest-Afrika durchgeführtwurde, dient im Bereich Benin als Antrieb für FOOT3DK. Es hat sich herausgestellt, dass dieSimulationen für ein Modelljahr nicht ausreichen, um eine allgemeingültige Klimatologie, dienicht von Einzelereignissen dominiert wird, <strong>zu</strong> erstellen. Daher muss, so wie für FOOT3DK bereitsdurchgeführt, auch für das LM ein klassenbasiertes, statistisch-dynamisches Downscalingvorgenommen werden. Anders als es <strong>zu</strong>m Beispiel für Marokko möglich war (Hübener et al.,2005a, 2005b), kann hierfür kein Wetterlagenklassifikationsschema verwendet werden. In diesemFall wird eine automatisierte Niederschlagstypenidentifikation auf Grundlage von E-CHAM/REMO-Output durchgeführt werden. In einer Kombination mit einer Clusteranalysewerden die <strong>zu</strong> simulierenden Einzelepisoden bestimmt.Für die Entwicklung der benötigten Modellkataster wurden von Teilprojekt A3 die notwendigenRohdaten geliefert, aufbereitet und umgesetzt, um die Simulationen für die Regenzeiten der Jahre2002 und 2025 <strong>zu</strong> ermöglichen. Darüber hinaus sind weitere Episodensimulationen mit dergesamten Modellkette erforderlich, um eine geeignete Datenbasis für das Teilprojekt A2 <strong>zu</strong>schaffen.SummaryIn recent years, research work on local and regional modelling of atmospheric processes and thecollection of seasonal climate data for West Africa has concentrated on two key topics. On theone hand, the well documented role of global sea surface temperature (SST) patterns and theirinfluence on the tropical monsoon system (Folland et al. 1986; Fontain et al. 1998, Bader andLatif 2003) has been identified to play the dominant role concerning the West African precipitationsupply in most years throughout the last decades. On the other hand land use change effectsand the influence of land-surface atmosphere interaction on precipitation systems is a majortopic of several recently published research papers (e.g. Zhao and Pitman, 2002; Koster et al.,2004; Osborne et al., 2004; Taylor et al., 2005). The latter process is dominant in years withweak global SST differences. Thus, the variability of fluctuations of accumulated precipitation inWest Africa is to a large extent influenced by SST anomalies of the global tropical ocean and to
Subproject A1 IMPETUS 93a minor degree by the SST anomalies of the extratropical oceans (Giannini et al., 2003). Thismechanism is modulated secondarily by the influence of the regional and local vegetation (Wanget al., 2004, Sogalla et al., 2005). This means that the local precipitation balance is influencedby the feedback of the prevalent land use at any time. As a significant consequence the feedbackeffect of land use is dominant for the rainy season of years with weak SST influence. The role ofland use change is particularly stressed by the IMPETUS project (Sogalla et al., 2005). It shouldbe noted that the magnitude of influence of single soil parameters depends on the regardedmodel and scale, respectively. The last mentioned study reveals that initial soil moisture is themost prominent parameter for the feedback on the precipitation balance. Less important - butnot negligible – is the role of vegetation cover and albedo. On the local scale roughness length isless important. Variations of leaf area index and saturation soil water content do not show noteworthyeffects on precipitation rates. Several sensitivity studies for time episodes of 54 hoursconducted with the 3-D Version of FOOT3DK reveal a tendency toward a decrease of futureprecipitation for several areas of the simulation domain in case of a reduction of soil moistureand vegetation cover. This is consistent with the results of similar considerations derived fromexperiments with REMO on the continental scale (Paeth, 2005a).In this context, considerations in this part of the IMPETUS project are linked with the questionof climate and environmental changes on the regional to local scale. Within the framework ofseveral IMPETUS working groups an explicit influence of land use change on local rainfall patternsis simulated by means of the local model on a rather regional scale and FOOT3DK on thelocal scale. Several simulations with the local model for the years 2002 (0.25° grid), 2000 and2025 (0.1° Grid) for the entire Northwest African continent reveal, that simulations for onemodel year are not sufficient to draw general conclusions. Thus it is necessary to implement astatistico-dynamical approach, in analogy to calculations with FOOT3DK in subproject B1. Incontrast to B1 (cf. Hübener et al., 2005a, 2005b) a classification on the basis of precipitationepisodes has to be executed via ECHAM/REMO model output. On the basis of a cluster analysissuitable episodes shall be evaluated and simulated by means of the lower branch of the modelchain. For the development of the land use registers for both regarded scales input data is providedby subproject A3. The raw data is processed for the special concerns of each model andforms the basis for the simulation of the rainy season 2002 by means of the local model andFOOT3DK. Furthermore, scenario runs for the year 2025 are conducted by using the entire IM-PETUS model chain.
94IMPETUS Subproject A1Workpackage A1-1: Simulation of future interannual to intraseasonal rainfall variabilityin Benin with time-slice experiments using the “Lokal-Modell”ProblemFor the assessment of future water availability, spatial high resolution rainfall sums and knowledgeof the temporal evolution of precipitation within the rainy season are very important. The“Lokal-Modell” (LM) of the German Weather Service (DWD) served as the connecting link betweentransient synoptic scale simulations (REMO, WP AB1-2) and the meso-γ-scale(FOOT3DK, WP A1-2). In WPA1-2, high resolution rainfall patterns were estimated by applicationof the recombination technique based on classified episodes.Work in the second phaseIn order to deliver LM output data in an early stage of the second phase of IMPETUS, the year2002 was simulated with the LM on a 0.25°-grid, covering approximately West-Africa between20° W and 20° E. These simulations served as a database of episodes for the nesting ofFOOT3D. The advantage of this model run on a relatively large grid was the applicability in Moroccoas well as in Benin.Later on, the model studies have been extended by yearly simulations for 2000 and 2025 formodel regions covering parts of the Guinea coast. The arrangement of the simulations had to bechanged compared with the original plans due to the findings in AB1.Simulations in AB1 – as well global climate simulations with ECHAM5 as regional climate scenarioswith REMO – have hinted to the important role of the vegetation canopy in Africa forfuture climate changes. Strongly affected regions are placed in Central Africa, but to a lesserextent – via moisture transports into the western part of Africa – one can see the influence ofvegetation changes also in tropical West-Africa (Paeth et al., 2005). For REMO and the LM,anthropogenic land-use changes based on FAO assessments of deforestation and degradationhave been implemented for the scenarios A1B and B1. With these changes, preliminary timesliceexperiments for 2000 and 2025 have been carried out with the LM. The atmospheric forcingof the LM was taken from the REMO climatology 1979-2003 and the preliminary scenariotime-slices for 2000-2025.Recently, the REMO climate simulations in AB1-2 could be expanded to three 3-member ensemblesfor an idealized present-day climate (1960-2000) and two IPCC SRES-scenarios (A1band B1). Ensembles of modelled scenarios allow for a distinction between model/system internalvariability and a forcing signal. Assuming that episodes in the LM embedded in the newerREMO simulations behave similar to the 1979-2003 climatology, only frequency distributions ofcirculation weather types could be calculated from the ensemble runs. Alternatively, LM simulationswith the forcing taken from the newest REMO simulations will be carried out in order torefer to the most actual version of physical parameterizations in REMO. In any case, it is possibleto estimate the uncertainty of predicted climate changes. In the following, results of LMsimulations in “climate mode”, that means as continuing 1-year simulation forced only by lateralboundary values, are described in some detail.
Subproject A1 IMPETUS 95Fig. A1-1:Meridional wind in the 700 hPa level from the LM simulation for 2002 in 10°N. Blue coloursdenote northerly, green and red southerly winds. The clear structure of the AEW betweenApril/May and October covers the period of the rainy season.The LM simulation on a 0.25° grid for the year 2002 revealed a good representation of the AEWstructures and a connection between wave structures and large convection events (Fig. A1-1).Nevertheless, problems were found in technical details in the soil-atmosphere interaction, whichlead to unstable simulations in some cases. These problems could be resolved. In addition, theSST obtained from GME analyses seemed to be slightly too high compared to the OISST fromNCEP, which lead to relatively large moisture fluxes over the tropical Atlantic and, subsequently,to enhanced rainfall in the coastal areas. This can be seen in the time-latitude diagram ofthe zonal mean rainfall between 10°W and 10°E (Fig. A1-2).Fig. A1-2:Propagation of the ITCZ. Left panel: Hovmöller-Diagramm of daily rainfall sums – averaged between10°W and 10°E and over a period of 10 days – for the LM simulation of 2002. The propagationof the ITCZ can be seen as well as a bimodal distribution between 7°N and 12°N, but an overestimationof offshore-rainfall seems to appear. Right panel: Same as left, but for the near-surfacewind direction (in degrees).The strong rainfall in the coastal areas could not be confirmed from remote-sensing and observationsfrom climate stations, mostly due to a lack of reliable observations. Also an overestimationof the spatial variability of the annual rainfall by the LM simulations could be stated; togetherwith in general higher rainfall sums than in observations. Additional simulations were conductedfor single months with different boundary and initial forcing data. Variations in soil initialisationsand vegetation parameters could not improve the results substantially.In order to refine the simulations and to make use of the originally planned model hierarchy,simulations on a 0.0625°-grid over Benin have been conducted with the LM, where the forcingdata was taken from REMO model results. In these LM regional climate simulations, expectedvegetation changes have been implemented. They were derived from FAO assessments of defor-
96IMPETUS Subproject A1estation and desertification and have been calculated with a stochastically disturbed multi-linearmodel (Paeth and Thamm, 2005; Paeth et al., 2005). The same model has been applied for theestimation of changes in land cover for the ensemble runs of REMO (cf. WP AB1-2). The expectedchange in land cover, which were taken to accompany the GHG changes in atmosphericforcing, are depicted in Fig. A1-3.Fig. A1-3:Assessment of land use changes in atmospheric modelling with REMO and the “Lokal-Modell”between 2000 (left panel) and 2025 (right panel). The land cover classification is based on the International-Geosphere-BiosphereProgramme 2 classification, but only characteristic (representative)values for vegetations types for e. g. Leaf Area Index, fractional plant cover, albedo a. o.were used in the regional climate models. It has to be pointed out, that this model of land coverchange does not contain information’s about roads.For the land cover change modelling, a population growth of 100% in 25 years and a deforestationrate of 30% have been assumed. Vegetation degradation was described by a mapping betweenclasses (e. g. rainforest-savannah-agriculture, grassland-desert). The stochastic part of themodel consists of normal distributed, partly distance-weighted random numbers.For the regional climate simulations with the LM nested in REMO model output, the first threerealizations on a 0.0625°-grid were conducted for the year 2000, the year 2025 and for a year2025 with atmospheric forcing from 2000 (land-cover change only). Although the comparisonbetween GME- and REMO forcing showed reliable results for single months, the continuoussimulation over one year revealed some deficiencies. A first glance on the HVO area showedthat the variability of the rainfall was so large, that local vegetation changes did not show significantinfluences on the annual rainfall (Fig. A1-4).The annual rainfall for this simulation was somewhat smaller than in the 2002 simulation, andfor the region of interest in quite good agreement for observations in the same period. The maindifference arose from the different forcing, since the 2025 forcing in REMO was influenced by acomplete forcing (GHG, SST and land-cover changes). On the other hand, both signals wereweak compared to internal variability.Looking at the whole model domain (Fig. A1-5), it was clear that the model bias in the coastalregion was not acceptable. The problem arose mainly because ocean-atmosphere latent heatfluxes were much too weak. Subsequently, the atmospheric moisture and instability was notstrong enough to produce sufficient monsoonal rainfall. Isolated convective events were representedsomewhat better, because their most active growth phase took place over land.
Subproject A1 IMPETUS 97Fig. A1-4: Comparison of annual rainfall for the HVO area simulated with the LM for 200, 2025and a land-cover change scenario (called “vegetation scenario”). Left pictures: 2000 vs.vegetation scenario, right pictures: 2000 vs. 2025. Station data are shown by colouredcircles.Fig. A1-5: Annual rainfall in the area around Benin, as simulated by the LM for 2000 and 2025.Observations for 2000 were plotted as coloured circles.
98IMPETUS Subproject A1Another problem became only visible in long-term runs: the influence of the nesting boundarylead to a dryer atmosphere in large parts of the model domain. Obviously, the rainfall eventsneeded some time travelling through the model domain to develop. In opposite to the stationdata, the seasonal cycle of rainfall showed a weak bimodal distribution (Fig. A1-6), but a tendencytowards higher, more variable rainfall rates in the 2025 scenario.Fig. A1-6:Time series of daily rainfall rates within the HVO. To point out differences in the temporalevolution, the bars show relative amounts of the annual rainfall sum in percent.The distribution of daily rainfall rates estimated from the LM matched quite well the rainfallrates from observations. For 2025, a higher frequency of higher rainfall rates is simulated (Fig.A1-7). Nevertheless, expected changes are smaller than the model deviation from observations.Fig. A1-7:Rainfall rate (mm/d)Rainfall rate (mm/d)Distributions of daily rainfall sums in the HVO area from the LM (lines) and observations (dots).Left panel: Relative frequencies for 2000 (red line), the vegetation scenario (blue line) and for2025 (green line) compared to station data (points). Right panel: Differences of the vegetation scenario(blue line), the 2025 scenario (red line) and station data (dots) from the 2000 run in absolutenumbers of occurrence.Conclusions drawn from these simulations were (a) the model domain is too small for long-termregional climate simulations and (b) the surface fluxes over tropical seas had to be corrected.Because latent heat fluxes in the Tropical Atlantic were only 20% of the values, which have beenestimated e. g. from COADS (Lindau, 2000) or NCEP reanalysis. A correction in the bulk formulafor surface moisture fluxes over water could improve the results clearly.
Subproject A1 IMPETUS 99Subsequently, a new regional climate simulation with the LM has been carried out for a largermodel region. The new area covered the complete Guinea coast with 0.1° resolution. The years2000 and 2025 have been simulated. The comparison of rainfall with CRU data showed betteragreement with respect to the spatial variability; the latent heat fluxes over the Tropical Atlanticcould be improved related to the simulation on the 0.0625°-grid. A MOS technique has not beenapplied, since the FOOT3DK simulation will be used in subsequent modelling and the smallerscale nested model has to be forced by physically consistent and, thus, uncorrected data.Concluding the application of the LM as regional climate model in West Africa, we have seenthat still a lot of technical and scientific work is necessary to produce stable and reliable resultswith the LM. Especially the treatment of the lateral boundaries within the nesting process needsmore attention when used for model studies on the climatic scale. Validation methods with observationaldata are restricted to relatively simple parameters due to sparse station density andconceptual differences between grid models and point data. In addition, decadal simulations needmore computational power than IMPETUS was able to use. Another inference is that when wehad to use LM data as input for non-meteorological models, statistical-dynamical downscalingcould provide reasonable results with less effort.Workpackage A1-2: Sensitivity studies on feedback mechanisms between precipitation systemsand land cover in a future climate using FOOT3DKOn basis of enhanced surface and upper-air observations from the field campaign of theIMPETUS project, a partition of rainfall-producing weather systems is provided by subprojectAB1 for the West African Soudanian zone during the rainfall season of the year 2002. The classificationis carried out by means of a detection scheme on basis of IR-satellite images, groundbased observations of precipitation, operational ECMWF pressure data and in-situ profiles oftemperature, humidity, pressure, and wind in a vertical grid resolution of 10m gathered from theIMPETUS radiosonde campaign at Parakou, located at the eastern margin of the HVO.A principal differentiation between three major types and associated subtypes (three at maximumfor each major type) of precipitation producing weather systems is made. Most of the rainfall –but not the complete sum – is connected with the following types:The first type of precipitation is generated by so called organised convective systems (OCS), andsubtype a (advective type) is associated with 50% of the yearly rainfall sums. The second majortype of precipitation systems is termed meso-scale convective systems (MCS) and contributes to26% of the annual rainfall sum. The third type is associated with an appearing vortex structure inthe north of the Upper Ouémé Valley (UVO) leading to westerly flow. This type is called vortextyperainfall and contributes to 9% of the annual rainfall totals in the regarded area (cf. Fink et al.2006). Subtype b is associated with locally-developing systems while subtype c is linked withinstability thunderstorms. On basis of the three major types and associated subtypes overall eightrainfall generating weather systems are employed for a statistic-dynamical downscaling approachin this subproject.Given this classification for the rainy season 2002, a number of 107 precipitation systems havebeen identified, which are linked to 95 so called major precipitation events. A major event canconsist of a single rainfall system or a combination of two precipitation generating systems. In
100IMPETUS Subproject A1particular an advective system is frequently followed by a local system (e.g. type 1a is followedby 2b). The resulting partition of precipitation generating cloud systems and their number for2002 (absolute and relative) is presented in Tab. A1-1.Tab. A1.1: Rainfall generating cloud systems during rainy season 2002Types 1a 1b 2a 2b 2c 3a 3b 3c Sum[#] 52 9 8 22 1 1 12 2 107% 48,6 8,4 7,4 20,6 1 1 11 2 100Due to a lack in core memory and the requirement of high computing time for each single episode,it is not possible to simulate complete years or even a whole rainy season for the regardedsimulation domain. Therefore, suitable episodes ranging from 54 to 72 hours are chosen andsimulated. In the selected time periods all of the eight rainfall-producing weather systems areincluded, where the relative frequency distribution of the given rainfall systems is kept (cf. Tab.A1.1).In order to provide a statistical sufficient number of episodes all in all, 31 simulations are conductedwith FOOT3DK on the 9km scale (9km grid mashes). The model is nested into the localmodel and simulation is undertaken with a Tiedke convection scheme. In a second step a smallerdomain with 3km mesh size is nested into the FOOT3DK 9km simulation, to achieve an areadistribution of rainfall, which is needed for hydrological efforts in subproject A3. Again theTiedke convection scheme is utilized. Within the regarded 31 episodes 43 precipitation generatingcloud systems occurred. The absolute and relative number of rainfall systems contributing tothe precipitation within the episodes is given in Tab. A1.2.Tab. A1.2:Observed precipitation system types during the 31 episodes.Types 1a 1b 2a 2b 2c 3a 3b 3c sumObs 18 2 3 9 1 1 7 2 43% 41,9 4,7 7,0 20,8 2,3 2,3 16,3 4,7 100Comparing the mean values of the four considered example simulations (3km runs on the leftpanel and 9km runs on the right panel of Fig. A1-8 – blue: averaged accumulated observed andred: averaged accumulated simulated rainfall) it becomes obvious that in most cases mesh precipitationon the 9km scale is underestimated by the FOOT3DK model. Possible reasons may liein the used convection scheme and the driving fields of the local model (LM). In contrast thesame convection scheme leads to an overestimation of mesh precipitation in most of the 3kmepisode simulations.The distribution of model precipitation shows the postulated diurnal cycle, but often precipitationpeaks show a time shift (e.g. Fig. A1-8(g): 3km simulation for 23.06.2002) in comparison to thereal precipitation events. Regarded episodes start at 26.07.2002 00UTC; 04.09.2002 00UTC;16.08.2002 00UTC; 23.06.2002 00UTC and comprise 54 hours. Therefore a subjective reclassificationof model precipitation events becomes necessary, following the precipitation characteristicsof the observed events.
Subproject A1 IMPETUS 101(a)(b)(c)(d)(e)(f)(g)(h)Fig. A1-8:Area average of hourly precipitation over all grid meshes for the FOOT3DK simulation domain(red line) and hourly average of observed precipitation at all stations in the considered area (blueline). Simulation for 3km (left panel) and 9km (right panel).
102IMPETUS Subproject A1The reclassification is carried out on basis of several decision criterions. These criterions areordered due to: Onset of a precipitation event, development of hourly sums of rainfall, and completeaveraged accumulated precipitation values. Assignment is done on basis of observed precipitationvalues at the measuring stations in the respective regarded simulation domain. For the3km simulations a station with a particular high, low and mean average precipitation is chosenfor the subjective reclassification. Furthermore, a comparison of averaged precipitation over thestations in the simulation domain and the averaged accumulated precipitation over the meshes ofthe simulation domain is done. The different observed sums result from the different number ofobservational stations. The reclassification, developed on basis of the 3km scale, is adopted forthe 9km scale without any changes.Reclassification is performed for all 31 episodes and the results are given in Tab. A1.3. In particularthere is a reduction of 1a events and an increase of 2b events in the simulated precipitationgenerating cloud systems.Tab. A1.3:Simulated precipitation system types during the 31 episodes.Types 1a 1b 2a 2b 2c 3a 3b 3c sumSim 19 6 2 17 2 2 7 1 56% 33,9 10,7 3,6 30,3 3,6 3,6 12,5 1,8 100To give an impression of a typical spatial rainfall distribution for the considered eight precipitationgenerating cloud systems in Fig. A1-9 (3km scale) and Fig. A1-10 (9km scale) the sums forthe selected examples are presented, which comprise in each case one specific type. The particularcomposition of the regarded episodes is given in Tab. A1.4.Tab. A1.4:Particular composition for the examples of typical episode precipitation.episode 1 (1a) 2 (1b) 3 (2a) 4 (2b) 5 (2c) 6 (3a) 7 (3b) 8 (3c)date 13.08.02 23.06.02 10.10.02 11.08.02 16.08.02 29.07.02 05.08.02 01.08.02types 1a, 2b 1b, 2b 2a, 1a 1a, 2b 1a, 2c 3b,2b,3a 1a, 3b 3c, 3bAs the over-estimation of rainfall rates at the margins of the simulation domain is a typical effect,which occurres during the nesting process, it is negligible. This is in particular true for the3x3km simulation. Nevertheless, these effects lead to an overestimation of averaged rainfall, asdepicted in Fig. A1-9, Fig. A1-10 and in the averaged episode precipitation shown in Tab. A1.5.Later this effect will produce an overestimation of the precipitation sums for the composition ofthe rainy season 2002 in the 3x3km simulation domain (Fig. A1-11a).Tab. A1.5: Averaged simulated precipitation for the selected episodes [l/m 2 ].episode 1 (1a) 2 (1b) 3 (2a) 4 (2b) 5 (2c) 6 (3a) 7 (3b) 8 (3c)3km 100.30 23.68 18.33 9.05 29.86 72.85 76.17 123.859km 19.35 3.19 7.45 1.56 6.19 15.94 23.06 22.87
Subproject A1 IMPETUS 103a) b)c) d) e)f) g) h)Fig. A1-9:Examples for accumulated episode precipitation [l/m 2 ] in the simulation domain of 3x3 km underattendance of one specific precipitation generating system type at a time:1a (a), 1b (b)2a (c), 2b (d), 2c (e)3a (f), 3b (g), 3c (h)
104IMPETUS Subproject A1a) b)c) d) e)f) g) h)Fig. A1-10:Examples for accumulated episode precipitation [l/m2] for the simulation domain of 9x9 km underattendance of one specific precipitation generating system type at a time:1a (a), 1b (b)2a (c), 2b (d), 2c (e)3a (f), 3b (g), 3c (h)
Subproject A1 IMPETUS 105As expected from the results of Fink et al. (2006), simulation for the subtype 1a should be associatedwith high precipitation sums. This is partly true for the 1a simulations of 3km and 9km(cf. Fig. A1-9a and A1-10a). In particular at the slopes of the Atakora-mountains and for themore flat regions in the central eastern part of the regarded domain the example simulations producerealistic rainfall amounts.As a whole the averaged rainfall totals for 2002 as simulated on the 9km and 3km scale byFOOT3DK reproduce the observed rainfall pattern, whereas the rainfall sums are overestimatedon the 3km and underestimated on the 9km scale. For a correction of the simulation results forthe regarded episodes a model output statistics (MOS) on basis of observed rainfall is required. Itis planned to implement a MOS at the beginning of the third phase of the IMPETUS project.a) b) c)Fig. A1-11:Accumulated precipitation for the rainy season 2002 on basis of a recombination of simulatedepisode rainfall for the 3km scale without threshold (a), 3km scale with 5mm threshold (b) and9km scale.As a first guess, the recombined episodes for the rainy season 2002 without any MOS-correctionare presented for the 9km- and 3km scale (Fig. A1-11). As expected there is a better agreementof the 9km distribution of precipitation totals (Fig. A1-11c) for the regarded time period in comparisonwith the observations delivered by subproject AB1 (cf. Fig. A1-12), although a generalunderestimation is identifiable. Even to abide is the overestimation of accumulated precipitationover the entire simulation domain for 2002 on the basis of the recombination of 3km scale episodesimulations (Fig. A1-11a). An attempt is made to reduce recombined episodes on the basisof threshold values for too small precipitation amounts (Fig. A1-11b). At the moment the successof this approach is limited. To sum up, it is inevitable to carry out a MOS-correction (cf. Paeth,2005b) for the episode simulation at the 3 km scale. This is planned in the first part of the thirdphase of the IMPETUS project. In addition a simulation of episodes for the year 2025 on basis ofLM input data is planned, where daily REMO precipitation totals serve as the decision basis forthe choice of adequate episodes for the FOOT3DK simulation. Again, calculation of 2025 localprecipitation will be done by means of MOS-correction. The land use for the FOOT3DK registerhas already been established on the 3km scale. In a final step calculations will be expanded to the
106IMPETUS Subproject A1Central and Lower Ouémé river regions. Among others, this will serve as an input for the problemcluster PK Be L3.Fig. A1-12:Total precipitation for the year 2002 over Benin.LiteratureBader, J. und M. Latif, 2003: The impact of decadal-scale Indian Ocean sea surface temperature anomalies on Sahelian rainfalland the North Atlantic Oscillation. Geophys. Res. Lett. 30, 10.1029/2003GL018426.Fink, A., H., D. G. Vincent and V. Ermert, 2006: Rainfall Types in the West African Soudanian Zone during the Summer Monsoon2002. Mon. wea. Rev., acceptetd for publicationFolland, C.K., T.N. Palmer und D.E. Parker, 1986: Sahel rainfall and worldwide sea temperature 1901-1985. Nature, 320, 602-607.Fontaine, B., S. Trzaska, and S. Janicot, 1998: Evolution of the relationship between near global and Atlantic SST modes and therainy season in West Africa: statistical analyses and sensitivity experiments. Clim. Dyn., 14, 353-368.Giannini, A., R. Saravanan und P. Chang, 2003: Oceanic forcing of Sahel rainfall on interannual to interdecadal time scales.Science 302, 1027-1030.Hübener, H. und M. Kerschgens, 2005a: Downscaling of current and future rainfall climatologies for southern Morocco.Part I: Downscaling method and current climatology. Submitted to Int. J. Climatol.Hübener, H. und M. Kerschgens, 2005b: Downscaling of current and future rainfall climatologies for southern Morocco. Part II:Climate change signals. Submitted to Int. J. Climatol.Koster RD, Dirmeyer PA, Guo ZC, Bonan G, Chan E, Cox P, Gordon CT, Kanae S, Kowalczyk E, Lawrence D, Liu P, Lu CH,Malyshev S, McAvaney B, Mitchell K, Mocko D, Oki T, Oleson K, Pitman A, Sud YC, Taylor CM, Verseghy D, VasicR, Xue YK und Yamada T: GLACE Team, 2004: Regions of strong coupling between soil moisture and precipitation.Science 305, 1138-1140.Lindau, R., 2000: Climate Atlas of the Atlantic Ocean derived from the Comprehensive Ocean Atmosphere Data Set (COADS),Springer Verlag, 514 pp.Osborne, T.M., D.M. Lawrence, J.M. Slingo, A.J. Challinor und T.R. Wheeler, 2004: Influence of vegetation on the local climateand hydrology in the tropics: sensitivity to soil parameters. Climate Dyn. 23, 45-61.Paeth, H., 2005a: Potential implications of land degradation for African climate as simulated by a regional climate model. InternationalJournal of Climatology, submitted.Paeth, H., 2005b: Statistical postprocessing of simulated precipitation data for hydrological and climatological analyses in WestAfrica. Quarterly Journal of the Royal Meteorological Society, submitted.Sogalla, M., A. Krüger und M. Kerschgens, 2005: Meso-scale modelling of interactions between rainfall and the land surface inWest Africa, Meteorol Atmos Phys., DOI 10.1007/s00703-005-0109-z, Published online: June 30, 2005Taylor, C. M., D. J. Parker, C. R. Lloyd und C. D. Thorncroft, 2005: Observations of synoptic scale land surface variability andits coupling with the atmosphere. Quart.J.Roy. Meteor. Soc., 131, 913-938.Wang, G., E.A.B. Eltahir, J.A. Foley, D. Follard und S. Levis, 2004: Decadal variability of rainfall in the Sahel: results from thecoupled GENESIS-IBIS atmosphere-biosphere model. Climate Dyn. 22, 625-637.Zhao, M. und A..J. Pitman, 2002: The impact of land cover change and increasing carbon dioxide on the extreme and frequencyof maximum temperature and convective precipitation, Geophys. Res. Lett., VOL. 29, NO. 6, 1078-1081
Subproject A2 IMPETUS 107Teilprojekt A2Bodenwasserdynamik, Oberflächenabfluss, Grundwasserneubildung undBodendegradation auf der lokalen und regionalen SkalaSoil water dynamics, surface runoff, groundwater rechargeand soil degradation on local to regional scaleAntragsteller / ParticipantsProf. Dr. B. Diekkrüger (Koordinator)Geographisches Institut, Universität BonnProf. Dr. B. Reichert,Geologisches Institut, Universität BonnFach / DisciplineHydrologie, BodenkundeHydrology, Soil scienceHydrogeologie, HydrogeochemieHydrogeology, HydrogeochemistryZusammenfassungZiel des Teilprojektes A2 in der zweiten Phase war die Analyse der Auswirkungen globaler Umweltveränderungenauf die hydrologischen Prozesse, Oberflächen- und Grundwasserressourcenund Bodenerosion im Ouémé Ein<strong>zu</strong>gsgebiet. Zur Berechnung von Szenarien der <strong>zu</strong>künftigenWasserverfügbarkeit und der Bodendegradation stehen hydrologische, hydrogeologische undErosionsmodelle <strong>zu</strong>r Verfügung. Verlässliche Eingangsdaten für die Szenarioanalyse werdenvon anderen Teilprojekten bereitgestellt.Die Oberflächenwasserressourcen auf der regionalen Skala werden mit dem konzeptionellenModell UHP-HRU ermittelt, welches die räumlich verteilte Version des Modells UHP darstellt.Das Modell wurde anhand von Abflussdaten verschiedener Teilein<strong>zu</strong>gsgebiete (580 – 10326km²) des Ouémés validiert. Es wurden gute Ergebnisse für Ein<strong>zu</strong>gsgebiete mit unterschiedlicherLandnut<strong>zu</strong>ng und trockenen und feuchten Perioden erzielt, was die Anwendbarkeit des Modellsfür Szenarien demonstriert. Auf lokaler Skala wird das Modell SIMULAT-H, welches bereits fürdas Aguima Ein<strong>zu</strong>gsgebiet in der ersten Phase von IMPETUS validiert wurde, für das Ara Ein<strong>zu</strong>gsgebiet(12 km²) getestet. Dieses Ein<strong>zu</strong>gsgebiet ist durch starke Degradierung der Vegetationund des Bodens charakterisiert. Im Ara-Ein<strong>zu</strong>gsgebiet wurden <strong>zu</strong>r Modellparametrisierung <strong>zu</strong>sätzlicheUntersuchungen bodenphysikalischer Eigenschaften degradierter Böden durchgeführt.Mit den beiden Modellen – dem physikalisch basierten Modell auf lokaler Skala und dem konzeptionellenModell auf regionaler Skala – stehen validierte Werkzeuge für die Szenarienmodellierung<strong>zu</strong>r Verfügung. Mit dem Modell UHP-HRU wurde das IMPETUS-Szenario B3 („businessas usual“) in Kombination mit dem IPCC Klimaszenario B2 berechnet. Als Input wurdenErgebnisse der Landnut<strong>zu</strong>ngsszenarien (Modell CLUE-S) und der Klimaszenarien (REMO, Zeitscheiben)verwendet.Zur Modellierung der Bodenerosion wird das Modell SWAT („Soil Water Assessement Tool“)angewendet. Das Modell wurde für mehrere Teilein<strong>zu</strong>gsgebiete des Oberen Ouémé validiert undzeigt gute Ergebnisse für die Abflusssimulationen. Die ersten Szenarienberechnungen wurden fürdas Térou-Ein<strong>zu</strong>gsgebiet durchgeführt. Um verlässliche Daten <strong>zu</strong>r Kalibrierung und Validierung
108IMPETUS Subproject A2des Sedimentaustrags <strong>zu</strong> erhalten, wurden Trübungssonden <strong>zu</strong>r Ermittlung der Schwebstofffrachtan drei Pegeln im oberen Ouémé Ein<strong>zu</strong>gsgebiet installiert. Zur Verbesserung der Bodendatenbasis,die von vielen Disziplinen benötigt wird, wurden Untersuchungen <strong>zu</strong> bodenphysikalischenund chemischen Eigenschaften im gesamten oberen Ouémé Ein<strong>zu</strong>gsgebiet durchgeführt.Zur Charakterisierung der verschiedenen Aquifere und des Grundwasserneubildungsprozessesim oberen Ouémé Ein<strong>zu</strong>gsgebiet wurden in saisonalen Abständen hydrochemische Analysendurchgeführt, sowie der Gehalt an Tritium und stabilen Isotopen an verschiedenen Wasserprobenbestimmt. Die Grundwasserdynamik wird durch ein Messnetz aus 12 Grundwasserstandsmessernbeobachtet. Die erfassten Daten und die Ergebnisse der ersten Phase dienen <strong>zu</strong>r Parametrisierungund Kalibrierung des Grundwasserströmungsmodells FEFLOW, das <strong>zu</strong>r Ermittlungder aktuellen und <strong>zu</strong>künftigen Grundwasserressourcen verwendet wird. Die mit UHP-HRUberechnete Grundwasserneubildung dient als Input für das Grundwassermodell. Die aktuelleModellierung stationärer Verhältnisse zeigt gute Ergebnisse für verschiedene Zeitschritte.Das Teilprojekt leitet drei Problemkomplexe. Im Problemkomplex PK Be-H.1 wird die Wasserverfügbarkeitund der Wasserverbrauch im Ouémé Ein<strong>zu</strong>gsgebiet analysiert. Die zentralen Modelledieses PKs sind das hydrologische UHP-HRU und das Grundwassermodell FEFLOW, diedurch die Grundwasserneubildung gekoppelt sind. Der Einfluss des Wasserverbrauchs auf die<strong>zu</strong>künftigen Wasserressourcen wird durch demographische Projektionen und Daten der Wasserverbrauchsanalyse(TP A4) ermittelt. Der Problemkomplex PK Be-E.2 ermittelt den Einfluss vonLandnut<strong>zu</strong>ngs- und Klimaänderung auf Bodenerosion und Ernteerträge im oberen Ouémé Ein<strong>zu</strong>gsgebiet.Hier wird das Erosionsmodell SWAT in Kombination mit dem PflanzenwachstumsmodellEPIC (TP A3) verwendet. Der dritte Problemkomplex (PK Be-E.7) beschäftigt sich mitder Ermittlung des Nut<strong>zu</strong>ngspotenzials der Inland-Valleys. In diesem Problemkomplex wird eineInland-Valley-Datenbank aufgebaut, die v.a. physische Charakteristika der Inland-Valleys undihre aktuelle Nut<strong>zu</strong>ng beinhaltet. Das hydrologische Modell UHP-HRU-N wird <strong>zu</strong>r Simulationder Wasserverfügbarkeit und des Stickstoffkreislaufs verwendet, während die Ernteerträge mitEPIC und ORYZA modelliert werden (TP A3). Des Weiteren ist das Teilprojekt A2 auch an denProblemkomplexen PK Be-E.6 (Erhaltung der natürlichen Produktionsgrundlagen) und PK Be-E.4 beteiligt, der die Nut<strong>zu</strong>ng von Kleinstauseen <strong>zu</strong>r Steigerung der Erträge im oberen OuéméEin<strong>zu</strong>gsgebiet analysiert.SummaryThe objective of subproject A2 in the second phase was to assess the influence of global changeon the hydrological processes, surface and groundwater water resources and soil erosion in theOuémé catchment. For the calculation of the future scenarios of water availability and soil degradationhydrological, hydro geological and erosion models are used. Reliable data for thescenario analyses are provided from different disciplines of the project.Surface water resources are assessed on the regional scale using the conceptual hydrologicalmodel UHP-HRU, which is a spatially-distributed version of the model UHP. The model hasbeen validated against discharge for several sub-catchments (580 - 10326 km²) of the OuéméRiver. Good results were obtained for sub-catchments with different land use and for dry andwet periods, which demonstrates the applicability of the model for scenario analysis. On the lo-
Subproject A2 IMPETUS 109cal scale the physical-based model SIMULAT-H, which was already validated in the Augimacatchment during the first phase of IMPETUS, is further tested in the Ara catchment (12 km²).This catchment is characterized by a severe degradation of soil and vegetation. Additional soilinvestigations were carried out in the Ara catchment to analyse the soil properties of degradedsoils. The results were used for the parameterisation of the model SIMULAT-H. With the twomodels – the physical-based model for the local scale and the conceptual model for the regionalscale - validated tools are available for scenario modelling. With the model UHP-HRU theIMPETUS scenario B3 (“business as usual”) combined with the IPCC climate scenario B2 wascalculated. As input the results of the land use scenarios (model CLUE-S) and the climate scenarios(REMO, time slices) were used for the hydrological model.To simulate the soil erosion the SWAT-model (Soil Water Assessment Tool) is applied. Themodel has been validated for several sub-catchments of the Upper Ouémé and shows good resultsfor the simulation of discharge. First scenarios were calculated for the Térou catchment.To obtain reliable continuous data to calibrate and validate the sediment yield turbidity probeswere installed measuring suspended sediment concentrations at three sites of the Upper Ouémécatchment. To improve the soil-related database required by many disciplines, field investigationsof soil physical and chemical properties were performed in the whole Upper Ouémécatchment.To characterise the different aquifers and the process of groundwater recharge in the UpperOuémé catchment hydro chemical analyses were carried out in seasonal intervals. Concentrationsof tritium and stable isotopes were determined for a variety of water samples. The dynamicof the groundwater table is observed with 12 automatic data loggers. These data and the investigationsof the first phase are the basis for the parameterisation and calibration of the numericalfinite element groundwater flow model FEFLOW, which is applied to assess recent and futuregroundwater resources. The simulated groundwater recharge of the hydrological model UHP-HRU is used as input for the groundwater model. Actually the model provides reasonable stationarysolutions.The subproject is responsible for three problem clusters. The problem cluster PK Be-H.1 is analysingthe water availability and water consumption in the Ouémé catchment. The central modelsin this problem cluster are the hydrologic model UHP and the groundwater model FEFLOW,which are coupled via groundwater recharge. The influence of water consumption on the futurewater resources are estimated based on demographic projections (subproject A5) and results ofthe water demand analysis (subproject A4). In the problem cluster PK Be-E.2 the influence ofland use and climate change on soil degradation and yield in the Upper Ouémé valley is assessed.Here the erosion model SWAT is combined with the plant growth model EPIC. The thirdproblem cluster (PK Be-E.7) is dealing with the agro-potential of inland-valleys of the UpperOuémé catchment. In this problem cluster a database concerning the physical properties of theinland valley and their actual use is built up. The hydrological model UHP-HRU-N is used forthe simulation of the water availability and the nitrogen cycle in the inland valley, while theyields are modelled with EPIC and ORYZA (subproject A3). In addition to these problem clustersthe subproject is participating in the problem cluster PK Be-E.6 (Conservation of naturalresources for agricultural production) and PK Be-E.4, which evaluates the use of small barragesfor the intensification of the agriculture in the Upper Ouémé catchment.
110IMPETUS Subproject A2Workpackage 2.1: Analysis of hydrological processes and hydrological modelling on thelocal scaleThe hydrological investigations performed during the first phase of IMPETUS revealed that theland cover has a strong influence on the hydrological processes in the region (Giertz, 2004;Giertz et al., 2005). The analysis of the land use (Judex, 2003) and soils in the Upper Ouémécatchment has shown that mainly t he north-west of the Upper Ouémé catchment is characterizedby a high ratio of agricultural land use and a high degree of soil degradation. As the investigationsof the first phases focuses on the southern part of the Upper Ouémé catchment, the hydrologicalprocesses of a strongly degraded catchment were not analyzed. Therefore the Ara catchment(12 km²) located at the north-western border of the Upper Ouémé catchment (Fig. A2-1)was selected to analyse and model the hydrological processes in a catchment with a high degreeof soil and vegetation degradation. For this catchment rainfall, discharge, groundwater level andsoil moisture data from measuring stations of the CATCH/AMMA project are available since2002.Fig. A2-1:Location and measuring sites of the Ara catchmentThe focus of the field investigations in the Ara catchment is on the examination of the soil physicalproperties (in-situ infiltration measurements, vertical and lateral saturated conductivity, texture).So the effect of a long-term agricultural land use on the soils and the hydrological processescan be assessed.The investigation of the infiltration measurements in the Ara catchment revealed that the infiltrationrate strongly depends on the actual land use type. As shown in Fig. A2- 2 the infiltration ratediffers significantly on the same soil type if the land use changes, although the measuring sitesare within a few meters. In addition to the in-situ measurements the saturated conductivity wasmeasured on soil cores for each horizon of the investigated soil profiles (Fig. A2-1). In order to
Subproject A2 IMPETUS 111compare the lateral and vertical permeability of the soils, soil cores were taken laterally and verticallyin the profile. The measurements revealed that there is no significant difference betweenvertical and lateral conductivity.160014001200Infiltrationrate [cm/d]10008006004002000TA02 fallowTA07 fallowTA18 fallowTB05 fallowTB06 fallowTB07 fallowTB08 fallowTC01 fallowTC06 fallowTC11 savanearbustiveTC13 savanearboréeTA05 yamTA11 yamsTA18 maniocTB08 yamTC01 sorghumTC03 sorghumTC06 cottonTA02 termitesTA07plinthiccrustTA19 withoutvegetationTB07 yammoundTC03 yammoundfallow/savannah field otherFig. A2-2:Infiltration measurements on different soil types and land cover types. Same colour = same soiltype with different land coverThe data obtained from the field investigations serve also to parameterize the physically-basedhydrological model SIMULAT-H, which is used for local hydrological modelling. The modelwas already successfully applied in the Aguima catchment (Giertz, 2004; Giertz et al., 2006).The spatial discretization for the Ara catchment was carried out with the TOPAZ-tool (Grabrecht& Martz, 1997) using the STRM DEM. Each sub-unit were parameterized concerning soil propertiesusing the data from the field investigations. For the determination of the land use/cover ofeach sub-unit the classification of Judex (2003) was used. The parameterization of the model isfinished. Actually simulations for the period 2002-2004 are carried out for the Ara catchment. Inthe beginning of the third phase scenarios of land cover change and climate change will be calculatedwith SIMULAT-H for the Ara and the Aguima catchment. These results can be used toverify the scenarios results of the conceptual regional model UHP-HRU.In addition to the investigations in the Ara catchment an inventory of the inland valleys in theUpper Ouémé catchment was launched, which is a necessary database for the determination ofthe agricultural potential of the inland valleys in the Upper Ouémé catchment (PK Be-E.7). Inthis inventory the surface properties as well as physical properties of the inland valleys and theiractual use were recorded using a GPS and a detailed questionnaire. Based on this inventory adatabank will be set up, which is the basis for the Decision Support System which will be developedfor this problem cluster.
112IMPETUS Subproject A2Workpackage 2.2: Hydrologic modelling on the regional scaleThe aim of the regional hydrological modelling is to assess the effects of global change on thefuture water resources in the Ouémé catchment. To attain this goal an interdisciplinary modellingapproach is applied, where the central model is the hydrological model UHP-HRU. For a betterrepresentation of the groundwater flow the FEFLOW-model (WASY, 2004) is used (see Workpackage2.4). In the scenario modelling process the time variant input parameters are calculatedby other models. The LUCC (Land use and cover change) modelling is performed with themodel CLUE-S (Verburg et al., 2002) by the subproject A3 (Thamm et al., 2006). The climatescenarios are calculated with the REMO model, which is nested in the General CirculationModel (GCM) ECHAM (subproject A1). This modelling approach is the main part of the problemcluster Be-H.1, which also takes into account the water consumption of population and livestock(subprojects A4 and A5) (Schopp, 2004).Model concept and parameterizationThe lumped model UHP (Bormann & Diekkrüger, 2004), which was successfully tested for severalsub-catchments of the Ouémé river, was modified to the spatial distributed model UHP-HRU. It is a conceptual model, which takes into account all relevant hydrological processes likeevapotranspiration, surface runoff, interflow, percolation, groundwater recharge. The spatial discretizationis carried out according to the hydrologic response units (HRUs) concept. To definethese HRUs the catchment is subdivided into small sub-catchments with ArcHydroTools using adigital elevation model (DEM). A further subdivision in HRUs is performed by a superpositionwith a soil and a land use map provided by Workpackage 2.3 and subproject A3. According tothis procedure the Upper Ouémé catchment was subdivided in 526 sub-catchments and 3517HRUs.Model validationThe model was tested in different sub-catchments of the Ouémé River for available dischargedata of the period 1993 – 2003. The lumped version of the UHP model was calibrated and validatedusing data from the Térou-Wanou catchment (3133 km²; Bormann and Diekkrüger, 2004).A further calibration of the distributed model was not required. As the model contains no routingroutine the model validation of the distributed model was carried out in a weekly time step. Asshown in Tab: A2-1 the model results are good for all sub-catchments.As the validation was performed in catchments with different land cover (Donga: high ratio ofagricultural area, Térou: mainly savannah and woodland), the application of the model for landuse change scenarios is feasible. Due to the high inter and intra-annual variability of the rainfallamount, the model has to deal with dry and wet conditions during the validation period. Thereforethe model is also applicable for changing climate condition (e.g. reduction of rainfall).
Subproject A2 IMPETUS 113Tab. A2.1: Quality measures of UHP-HRU application in the Upper Ouémé catchment(validation period). Discharge data used for model validation providedby the CATCH-project and “Direction Général de l’Hydraulique”.River, gaugeCatchmentsize [km²]SimulationperiodModelefficiencyTérou, Wanou 3060 1993-2000 0.79 0.80Térou, Saramanga 1360 1998-2001 0.81 0.77Térou, Igbomakoro2323 1998-2003 0.84 0.81Aguimo 396 1997-2003 0.70 0.69Donga, Pont 587 1998-2003 0.73 0.72Donga, Affon 1308 1998-2002 0.81 0.80Ouémé, Bétérou 10083 1997-2000 0.82 0.75r²First scenario resultsThe first scenario calculation was performed for the year 2025 for the business as usual scenario(B3, see section II.1.2.) combined with the IPCC climate scenario B2 calculated by REMO(IPCC, 2001).For the IMPETUS scenario B3 the LUCC modelling shows an increase of agricultural area and adecrease of dense and sparse savannah from 2000 to 2025 (see subproject A3). The spatial distributionreveals that the expansion of agricultural area occurs mainly along roads and tracks,where the accessibility is easy. Concerning the IPCC scenario B2 the REMO model shows anincrease of the temperature and a decrease of the rainfall for the region (see subproject A1).Compared with the mean precipitation from 1993 – 2003 the rainfall is 163 mm less in 2025(Tab. A2.2). Due to a high interannual variability rainfall amount of about 1000 mm occurredalso during the last decades (e.g. 2001). Regarding all time slices the REMO simulation shows atrend of reduced rainfall in the future although for single years an increase compared to the longtermmean has been computed.Tab. A2.2: Simulated water balance of the period 1993 – 2003 and the scenario B3 year 20251993-2003 2025Precipitation 1229 mm 1065 mmRenewable water resources(groundwater recharge + discharge) 265 mm 120 mmStorage in root zone, unsaturatedzone and saturated zone 83 mm 59 mmEvapotranspiration 881 mm 886 mmRenewable water resources(groundwater recharge + surfacewater) 3.8 km³ 1.7 km³Water consumptionin % of the water resources2.8 Mio m³0.07%6.6 Mio m³0.4 %
114IMPETUS Subproject A2Fig. A2-3 shows the comparison of the minimal, maximal and mean discharges at the Ouémé-Beterou gauge from 1993–2003, the measured discharge for the year 2000 and the dischargesimulated with UHP-HRU for the scenario 2025. Compared to the mean discharge from 1993-2003 and the discharge of the year 2000 the discharge period for 2025 is shorter. Striking is thereduction of discharge in the end of August, which does not occur in the period 1993-2003. Thisis caused by strong reduction of precipitation in this period as simulated by REMO for this scenario.The renewable water resources for the region are halved in 2025 compared to 1993-2003 (Tab.A2.2). The reduction mainly results from the climate scenario input. The spatial distribution ofthe renewable water resources in 2000 and 2025 is shown in Fig. A2- 4.As soon as the continuous data from the REMO simulation and other results of the LUCC modellingare available continuous scenarios for the period 2000-2025 and the IMPETUS scenariosB1 and B2 will be calculated.Actually the UHP-HRU model is parameterized for the whole Ouémé catchment. In the beginningof the third phase scenarios will be calculated for the whole Ouémé catchment in order toassess the impact of global change processes on the water availability of the total basin.precipitaton [mm]0100200300600discharge [m³/sec]500400300200max 1993 - 2003min 1993 - 2003mean 1993 - 2003year 2000scenario 20251000Fig. A2-3:1.11.21.31.41.51.61.71.8Minimal, maximal and mean discharges at the Ouémé-Beterou gauge and mean precipitation ofthe period 1993-2003 compared to discharge and precipitation of 2025 for scenario B3 combinedwith IPCC B2. Additionally the discharge of the year 2000 is displayed for a better comparabilityof the annual discharge dynamics.1.91.101.111.12
Subproject A2 IMPETUS 115Fig. A2-4:Renewable water resources in the Upper Ouémé catchment 2000 and scenario 2025 (IMEPTUSscenario B3 in combination with IPCC scenario B2)Implementation of the model UHP-HRU in other problem clustersThe model UHP-HRU is also used in the problem cluster Be-E.4 (Possibilities to increase theyield by creating small scale reservoirs within the Ouémé catchment) and Be-E.7 (Agro-potentialof inland valleys in the Upper Ouémé catchment). In the problem cluster Be-E.4 the model isapplied to estimate the water input in the barrage and to calculate the influence of the barrage onthe hydrograph. For the problem cluster Be-E.7 a module for the simulation of the nitrogen cycleis implemented in the model. This will serve to estimate the nitrogen entry from the catchmentinto the inland valley via surface runoff and interflow. The water availability in the inland valleyswill also be calculated with the model.Workpackage A2-3: Anthropogenic soil degradation due to water erosion in the upperOuémé valley/BeninObjectivesIn the first phase of the IMPETUS project soil distribution and soil erosion were intensivelystudied in the super test site (Aguima, 30 km 2 ). Actual soil loss depending on the land use andcropping system and detailed information about soil properties were obtained at the local scale.The main objective of the second phase was to extend the knowledge about soil erosion to largertemporal and spatial scales. This shift to the regional scale (Upper Ouémé catchment, about15.000km 2 ) and the need to formulate future scenarios considering land use and climate changenecessitated a methodical shift from field studies towards a modelling approach.
116IMPETUS Subproject A2MethodThe model system SWAT 2000 and the new version SWAT 2003 (Soil & Water AssessmentTool, http://www.brc.tamus.edu/swat) were first applied to the Terou sub-catchment (2323 km 2 ,Busche, 2005; Sintondji, 2005) and afterwards to the whole Upper Ouémé catchment to simulatehydrological and erosive processes. For model parameterization soil transects were investigatedduring the years 2002-2004. Physical and chemical soil properties for 40 representative profileswere determined. Parameter values for soil depth, soil texture, gravel content and pH-value wereobtained. Besides organic carbon, as an important model parameter, further chemical parameters(e.g. CECpot, base saturation, cations, and nitrogen) were determined to enable conclusionsabout the soil fertility and the classification according to the World Reference base (FAO-ISSS-ISRIC, 1998).Since spring 2004 measurements of suspended sediment concentration (SSC) were conducted ina 30 minutes interval with turbidity probes at three outlets (Donga Pont, Lower Aguima, Terou-Igbomakoro) in the catchment. For all three sites turbidity-SSC calibration curves were derivedby manual water sampling and gravimetric determination of sediment concentration. In addition,direct daily SSC measurements were performed at the Ouémé Beterou outlet (about 10000km 2 ).Subsequently to the hydrological calibration and validation of the SWAT for the Terou-Igbomakoro catchment the feasibility of the scenario analysis was tested with preliminary “businessas usual” scenarios delivered by the IMPETUS subprojects A1 and A3. At this time thetemporal and/or spatial resolution of the climate data (REMO 5year time slices based on IPCCB2) and the land use data (500m grid with dominant land use) was still limited. To diminishthese limitations the land use maps were disaggregated to a 50m resolution. Furthermore, theclimate scenario was restricted to precipitation while the daily precipitation values were derivedfrom monthly values of the climate model REMO using the weather generator LARS-WG. Dailyvalues from REMO could not be used directly because they didn’t reflect adequately rainfallintensities at the local scale as required for erosion modeling. Meanwhile the statistical correctionalgorithm for REMO developed by IMPETUS A1 has been improved and the 0.5° modeloutput grid was disaggregated to site-specific climate data. Currently time-continuous climatescenarios including all climate parameters (REMO ensemble runs based on IPCC A1 and B1) areapplied to the whole Upper Ouémé catchment for the time period 2000-2025.Main resultsa) Terou catchmentThe SWAT model was successfully parameterized and applied to the Terou catchment for thetime period 1998-2003. For the calibration and the validation period the agreement betweenmeasured and simulated discharge values was satisfactory (Fig. A2-5). However, the modeloverestimates the discharge, especially at the end of the rainy season (weekly model efficiency0.62) with a slight overestimation of total discharge values. Most important parameters for calibrationwere the SCS curve numbers and groundwater parameters. Calibration and validation ofthe sediment budget could not be performed because suspended sediment measurements werenot available till March 2004. Nevertheless, the simulated values of 0.01-17.6 tons soil loss perhectare depending on the land use type seemed reasonable. For the whole catchment an average
Subproject A2 IMPETUS 117annual soil loss of 4.3 t/ha was obtained. Furthermore, the uncertainty analysis conducted withthe methods PARASOL and SIMLAB revealed that the groundwater parameters alpha_bf (recessionconstant) and GWQmn (threshold for groundwater flow) were the most uncertain parameters.Before starting the scenario analysis for the years 2000-2025 the validity of the climate and landuse data delivered by IMPETUS subprojects A1 and A3 was checked for a time period for whichmeasurements are available. The comparison of simulated (REMO) and measured rainfall intensitydistributions at two weather stations (Djougou, Penessoulou) for the time period 1979-1997revealed that the simulated rainfall distribution was shifted to lower values because REMO deliveredarea and not-site specific precipitation. In order to avoid the effect of significantly lowererosion values, daily rainfall values were generated with the weather generator LARS-WG (Semenovet al. 1998) using monthly REMO values. A comparison of the disaggregated land usemap with the non-aggregated land use map derived by the CLUE-S model and the original landuse classification (Landsat TM) indicated a satisfactory representation for the year 2000. As aresult of the preliminary land use scenario “business as usual” it can be stated, that the expansionof agricultural areas lead to a significant reduction of surface runoff, while base flow decreasedstrongly and discharge variability increased. As a consequence, soil erosion increased considerably;especially for the years 2020 and 2025 (Fig. A2-6). The precipitation scenario lead only tochanges in total flow amounts. The ratios of the discharge components remained similar. Thereductions of total annual flow reached up to 50% for the years 2020 and 2025, which caused asignificant reduction of soil erosion rates. However, the restriction to five time slices doesn’tallow deriving a valid pattern. The combination of both scenarios showed minor effects on theerosion rate for the whole catchment, but the effects differed regionally.weekly discharge Terou-Igbomakoro catchment 1998-2003200weekly discharge (m 3 /s)15010050measuredsimulatedCalibrationValidation05.1.98 28.8.99 19.4.01 10.12.02Fig. A2-5.: Measured and simulated weekly total discharge in the Terou-Igbomakoro catchment (1998-2003)
118IMPETUS Subproject A220002025Erosion rate (tons/ha,yr)Fig. A2-6:Terou-Igbomakoro catchment - Land use scenario „Business as usual: soil erosionrate 2000 and 2025b) Upper Ouémé catchmentThe SWAT model was successfully extended to the whole Upper Ouémé catchment for the timeperiod 1998-2004. Therefore the soil data basis had to be completed by further 19 representativesoil profiles. The assessment of the soil fertility using the program FCC V.3/4 revealed the followinglimiting factors: low nutrient binding capacity, low potassium values, high gravel contentin the topsoil and temporary limited water availability. The classification of the profiles accordingto the world reference base (FAO-ISSS-ISRIC, 1998) confirmed the dominance of Acrisolsand Lixisols in the catchment.The determined turbidity-SSC calibration curves for the each of the three outlets were satisfactory(R 2 0.47-0.86). Considering this calibration curve discharge and SSC curves resulted in suspendedsediment loads of 0.12 up to >0.18 t/ha for the year 2004. The fact that these measuredvalues are obviously lower than the simulated values by Sintondji (2005) can be partly explainedby the pronounced dry conditions in the Terou and Donga catchment in 2004 with very fewheavy rainfalls and total discharge values half as the mean value for 1998-2004. For the OuéméBeterou outlet 0.05 tons suspended sediment per hectare were calculated for 2004. Highest sedimentlosses were obtained for the Donga catchment, which shows a higher portion of agriculturalland (32 %) compared to the Terou Igbomakoro (10%) and the Upper Ouémé catchment (14%).The model was successfully calibrated and validated at five outlets (Donga Pont, Terou-Igbomakoro, Terou Wanou, Ouémé Sani and Ouémé Beterou). The hydrological calibration forthe period 1998-2001 showed a good agreement between measured and simulated weekly dischargevalues (model efficiency 0.73-0.82 , R 2 0.75-0.90 ). The results for the hydrological validationperiod 2002-2004 were satisfactory (model efficiency 0.64-0.74, R 2 0.73-0.79). For sedimentcalibration SSC measurements at Terou-Igbomakoro outlet were compared to model results.Due to data losses in the first months of the rainy season 2004 Donga Pont measurementswere not used for sediment calibration. However, after adjustment of the USLE C-factor thesimulated sediment curves agreed satisfactorily with the simulated curves at both outlets (Fig.A2-7). SSC measurements for 2005 have been processed but could not yet be used for sediment
Subproject A2 IMPETUS 119validation because the discharge measurements from the French research project CATCH are notyet available.For a better characterization of the soil degradation phenomena in the whole Upper Ouémécatchment soil drillings were performed on about 20 degraded agricultural fields in addition tofarmer interviews about the land use history, management practices and recent problems withregard to rainfall, soil degradation and crop yield. In some cases reference sites were studied.Furthermore, 13 erosion forms (sheet erosion on fields, rill and gully erosion along roads andpaths) were exemplarily characterized in the most degraded regions of the catchment (communesDjougou, Copargo and Parakou). With regard to the third project phase soil conservation measuresalready implemented by development projects in Central Benin (communes Boukombé andOuaké) were visited and discussed with staff members. Possible actors for the implementation ofsoil conservation measures in the Upper Ouémé catchment were identified.In cooperation with the IMPETUS subproject A3 general soil quality classes have been derivedfrom the French soil map for the Upper Ouémé catchment (PK Be-E4) and the whole country(PK Be-E6) as input data for the land use model CLUE-S and for computing the marginalityindex.Sediment Yield 2004 - Terou Igbomakoro catchmentSediment Yield [t/ha,day]0.0100.0080.0060.0040.002SY_measuredSY_simulated0.00027.2 18.4 7.6 27.7 15.9 4.11 24.12DayFig. A2-7: Comparison of measured and simulated sediment yield for the year 2004.Workpackage A2-4: Regional hydrogeology and groundwater modelThe objective of the hydrogeology workgroup is the description of a regional hydro geologicalmodel and based on it the development of a numerical groundwater flow model to determinegroundwater resources for the Upper Ouémé (HVO) catchment.Local research results and data from a local sub-catchment taken during the 1st IMPETUS phase2001-2003 were taken into consideration and proved for a regional context. In consequence anextended water sampling and a groundwater table measuring campaign were realised to obtaininformation for the whole Upper Ouémé (HVO) catchment and adjacent areas. The hydro geologicalwork is concentrated on the fractured aquifer in the crystalline basement and the regolithaquifer (Taylor & Eggleton, 2001) which consists of weathered bedrock material. Sampling includeswater samples from different origin. Besides precipitation water, surface water from lakes
120IMPETUS Subproject A2and rivers, groundwater from the regolith aquifer, mainly taken from open dug wells andgroundwater from the fractured bedrock aquifer (pumps) has been collected. Samples were analysedfor the major anions, cations, a variety of heavy metals, and environmental isotopes.Of major concern for the groundwater quality are high quantities of nitrate. Their origin isclearly anthropogenic as most of the contaminated sites are open dug wells situated within settlements.In some cases fluorides appears in high concentrations around 1.5 mg/l, which equalsthe drinking water limit given by the WHO (2004). The solution of fluoride is clearly linked tothe solution from geological features such as apatite-rich bedrocks or dykes.Cluster analysis of the vast hydro chemical data base (Sarvan, 2004) show a vertical change ofhydro chemical facies in the aquifers. Groundwater at the top of the regolith aquifer has often alow ion charge and manifests in a kaolinite stability zone (Fig. A2-8). This zone is characterisedby direct recharge from precipitation and a relatively fast drainage. Deeper sections of the regolithaquifer exhibit a zone of stagnant water proved by water samples representative for thehighly charged montmorillonite stability zone. The appearance of montmorillonite points tolonger residence times and higher mineralised groundwater (Appelo & Postma, 1994). Hence,Bohnenkämper (2006) showed the variable thicknesses and characteristics of regolith layers atdifferent investigation sites in the HVO, the presence of montmorillonitic layers in the south ofthe HVO might be caused by a different intensity of weathering. The fracture system in the bedrockaquifer shows only little communication (Robain & Wubda, 2004). An exception is a tectonicallystressed zone which follows the striking of the Kandi fault (Fig. A2-9). The mineralizationof groundwater from fractures is low indicating that drainage from the above montmorillonitezone is small. In some cases the hydraulic environment of the bedrock aquifer was disturbedwhen groundwater from the montmorillonite zone percolated downward into the fresh rock dueto strong pumping. Tritium analyses manifest both the hydro chemical derived stratification by aclear age stratification of groundwater as well as the mixing of lower and higher groundwaterlayers due to pumping.Fig. A2-8:Placement of the 3 water types (Cluster 1 = shallow regolith water; Cluster 2 = bedrockwater; Cluster 3 = deep regolith water) in stability fields shows a clear differencebetween the regolith groundwater from different depths
Subproject A2 IMPETUS 121Proved by stable isotope concentrations (δ 2 H, δ 18 O) all groundwater types derive from a ratherfast infiltration of precipitation without traces of evaporation. Hence, the stable isotope signatureshows almost no change in both its regional extension and its vertical distribution, the aquifersappear to be a great mixing bowl for all infiltrating types of water. But, the question about theorigin of the precipitation recharging the groundwater is not completely answered. Therefore, aregional rain water sampling campaign has been started. The results from the isotope analysiswill be compared to meteorological models to characterise isotope patterns of rain falls of differentorigin in the study area.In order to observe the behaviour of the groundwater table 12 automatic data loggers were installedin Mai 2004. The data loggers were placed in observation boreholes and in boreholes offoot pumps distributed over the study area. So far, piezometric data is available for two completehydrological years in the HVO area. But, it is not significant for a complete time series analysisas no reliable trend can be interpreted at this point. In respect to the size and the geology of thestudy area it is as well not possible to interpolate the observed data to achieve realistic groundwatercontour lines. The distance between the data logger position makes it impossible to integratethe actual morphology in interpolation algorithms unless an extremely simplified terrainmodel is used. Nevertheless values for the depth of the groundwater table can be interpolated.The volume between the two surfaces was calculated and multiplied with a storage coefficient ofthe regolith aquifer in order to obtain the total groundwater recharge per year. By this procedurea recharge of 216.2 mm in the year 2004 was calculated for the HVO area. The general rechargebetween the dry season 2004 and the dry season 2005 was calculated as 84 mm. This means thatthe groundwater table rose in total. But it can be seen that at some data loggers an inverse developmentexists. An important data input for regionalisation of geological and hydro geologic featuresis the BDI (“Base des données integrées”), a data base provided by the DGH (“DirectionGénéral d’Hydraulique”). Its data was quality checked and used for interpolation methods. Thusit was possible to determine the eventual thickness of the regional aquifers as much as the generaldistribution of the hydraulic conductivity of the bedrock aquifer. The BDI was used to makea morphology related control of borehole depths and pumping test data. Therefore a digital elevationmodel (DEM) was derived from SRTM satellite pictures with a 90 m resolution. This controlshowed a certain relationship between the data and the morphological setting of a borehole.But, the general quality either of the BDI or of the DEM is too rough to include this informationinto a model framework.The numerical 3D model was realised using the software FEFLOW® (WASY, 2004) which isbased on the finite element method. It represents as much features of the regional hydro geologicalconceptual model as possible (Fig. A2-9).Geometrical data was used from the DEM. Hydraulic conductivities for the two aquifers aregiven by the interpolation of BDI data and by results of the investigations during the 1 stIMPETUS phase (Fass, 2004). Storage capacities of the aquifers are estimated in relation to formerstudies (e.g. Engalenc, 1985; Jacquin & Seygona, 2004; SOGREAH/SCET Tunisie, 1997).The groundwater model is integrated in the problem cluster Be-H.1. The simulated groundwaterrecharge of the hydrological model UHP-HRU is imported in the groundwater model. Groundwaterexploitation is integrated into the model based on the analysis of water consumption
122IMPETUS Subproject A2(Schopp 2004) in rural and urban areas. Peoples future water needs were extrapolated with regardto demographic models (Doevenspeck, 2004). Thus the climate scenarios as well as thesocio-economic scenarios of the IMPETUS working groups are respected and can be integratedinto the model after data processing. The numerical model computes on a daily time step basis.To accelerate modelling process the daily hydrological data are summarised to weekly values.The first modelling period concerns the time from 1993 to 2003 which is modelled in the UHP-HRU model. The model can be run until the year 2025.Actually the model provides reasonable stationary solutions. Below the seasonal fluctuatinggroundwater table the lower layers of the regolith and of the bedrock aquifer stay saturated. Theregional groundwater model describes therefore as major hydraulic process the movement of thegroundwater table in a regional context. Further work on the groundwater model will includespecial case scenarios like the installation of water consuming industries or wide-scale irrigationtechniques. Realistic interventions should be decided on the socio-economic scenarios developedby IMPETUS.However increasing exploitation of groundwater from the bedrock aquifer will lead to a degradationof water quality due to infiltration of water from the deeper regolith reservoir. Consequentlyhigher costs in hygiene and medical support can be foreseen. Irrigation would be as it leads tohigher mineralization. The hydraulic productivity of the aquifer is generally low (< 5 m/h) andtherefore special management strategies have to be adapted in order to cover future water demand.Fig. A2-9:Generalized colour map of the distance of the groundwater table to earth’s surface(orange – shallow to violet – deep). It is seen that along the main axis of the Kandifault groundwater is drained well and is found therefore in deeper levels.
Subproject A2 IMPETUS 123LiteratureAppelo, C. A. J. & Postma, D. (1994): Geochemistry, groundwater and pollution. A.A. Balkema Publishers, 536p. , Leiden, TheNetherlandsBohnenkämper, L. (2006): Regionale Charakterisierung des Saprolith im oberen Ouémé-Ein<strong>zu</strong>gsgebiet / Benin durch geoelektrischeSondierungen und Bohrlochansprachen. Diplomarbeit an der Universität <strong>zu</strong> Köln, 136 pp.Bormann, H.and Diekkrüger, B. (2004): A conceptual, regional hydrological model for Benin (West Africa): validation, uncertaintyanalysis and assessment of applicability for environmental change analyses. Physics and Chemistry of the Earth 29,759-786.Busche, H. (2005): Modellierung hydrologischer und erosiver Prozesse im Terou-Ein<strong>zu</strong>gsgebiet (Benin) unter der Annahme vonLandnut<strong>zu</strong>ngs- und Klimaänderung. Schriftliche Hausarbeit im Rahmen der Ersten Staatsprüfung für das Lehramt für dieSekundarstufe II. Institute of Geography at University of Bonn. Unpublished.Engalenc, M. (1985): Notice explicative de la carte hydrogéologique du Bénin 1/500.000ème. Géohydraulique, Alfort, France.FAO-ISSS-ISRIC (1998): World Reference Base for Soil Resources (ed. O. Spaargaren), 165 ppFass, T. (2004): Hydrogeologie im Aguima Ein<strong>zu</strong>gsgebiet in Benin/Westafrika. Elektronische Dissertation der Mathematisch-Naturwissenschaftlichen Fakultät der Universität Bonn.Giertz, S. (2004): Analyse der hydrologischen Prozesse in den sub-humiden Tropen Westafrikas unter besonderer Berücksichtigungder Landnut<strong>zu</strong>ng am Beispiel des Aguima-Ein<strong>zu</strong>gsgebietes in Benin. PhD-Thesis, University of Bonn.,http://hss.ulb.uni-bonn.de/diss_online/math_nat_fak/2004/ giertz_simone/index.htm.Giertz, S., Junge, B. & B. Diekkrüger (2005): Assessing the effects of land use change on soil physical properties and hydrologicalprocesses in the sub-humid tropical environment of West Africa. Physics and Chemistry of the Earth, Parts A/B/C,Volume 30, Issues 8-10, 2005, pp. 485-496.Giertz, S., Diekkrüger, B. & G. Steup (2006): Physically-based modelling of hydrological processes in a tropical headwatercatchment in Benin (West Africa) - process representation and multi-criteria validation. Hydrology and Earth SystemSciences (HESS), HESSD-2006-0020.Garbrecht, J. & L.W. Martz (1997): TOPAZ: An automated digital landscape analysis tool for topographic evaluation, drainageidentification, watershed segmentation and subcatchment parameterization. TOPAZ user manual. U.S. Department ofAgriculture, ARS Publication GRL 97 (4), El Reno, Oklahoma, 119 S.INSAE (2003): Troisiéme Recensement Général de la Population et de l’Habitat de Février 2002. La population des communesde Tchaourou, N’dali, Parakou, Bassila, Djougou,Cotonou. Institut National de la Statistique et de l’Analyse Economique,Cotonou, Bénin.IPCC (2001): Climate change 2001: The scientific basis. Contribution of the working group I to the third assessment report of theintergovernmental panel on climate change, Cambridge.ISSS Working Group RB: World Reference Base for Soil Resources: Atlas. Acco, Leuven, 1998.Jacquin, F. & Seygona, Z.Y. (2004): Contribution à l’étude du fonctionnement hydrodynamique des aquifères du bassin versantde la Donga. ORE AMMA/CATCH, IRD, Cotonou, Bénin.Judex, M (2003).: Analyse und Erklärung der Landbedeckungs- und Landnut<strong>zu</strong>ngsänderung im Upper Oueme Catchment (Benin,Westafrika) durch die Verknüpfung von LANDSAT-Daten mit sozioökonomischen Daten. Diploma Thesis, University ofBonn. http://www.rsrg.uni-bonn.de/RSRGwww/Deutsch/Diplomarbeiten/ Judex_Diplomarbeit_2003.pdf.Robain, H. & Wubda, M. (2004): Rapport de mission au Bénin du 12 octobre au 22 novembre 2004. Not published report, IRD,UR027 – GEOVAST, France.Sarvan, M. (2005): Characterisation of the groundwater in the Upper Ouémé catchment (Benin, West Africa) employing hydrochemicaland isotope data. Diplomarbeit an der Friedrich-Wilhelms-Universität Bonn, 93 pp.Schopp, M. (2004): Wasserversorgung in Benin unter Berücksichtigung sozioökonomischer und soziodemographischer Strukturen- Analyse der Wassernachfrage an ausgewählten Standortendes Haute Ouémé. Elektronische Dissertation der LandwirtschaftlichenFakultät der Universität Bonn.SCS (1972): Estimation of direct runoff from storm rainfall. National engineering handbook, section 4 – hydrology, USDA, 10.1– 10.24, 1972.Semenov MA, Brooks RJ, Barrow EM & Richardson CW (1998): Comparison of the WGEN and LARS-WG stochastic weathergenerators for diverse climates. Climate Research 10:95-107Sintondji, L.O.C (2005): Modelling the rainfall-runoff process in the Upper Quémé catchment area (Terou) in a context of climatechange: extrapolation from the local to the regional scale. PhD thesis, Math.-Nat. Faculty of the University of Bonn,Shaker, Aachen, 205pp.SOGREAH/SCET Tunisie (1997) : Etude de la stratégie nationale de gestion des ressources en eau du Bénin: assistance à ladéfinition de la stratégie nationale de gestion des ressources en eau du Bénin, Rapport R2 Potentialités des Aquifères discontinusdes formations du socle. 7 vol. DH. Cotonou, Bénin.Taylor, G. & Eggleton, R. A. (2001): Regolith Geology and Geomorphology. 384 p., John Wiley & Sons, LTD, Chichester,England.Thamm, H.-P., Judex, M. and Menz, G. (2005): Modelling of Land-Use and Land-Cover Change (LUCC) in Western Africausing Remote Sensing. In: Zeitschrift für Photogrammetrie und Fernerkundung 3/2005, 191-199.Verburg, P.H.; Voldkamp, W.S.A., Espaldon, R.L.V and Mastura, S.S.A. (2002): Modeling the Spatial Dynamics of RegionalLand Use: The CLUE-S Model. In: Environmental Management, Vo. 30, No. 3, 391 – 405.WASY (2004): FEFLOW 5.1, Finite Element Subsurface Flow and Transport Simulation System. Institute of Water ResourcesPlanning and System Research Ltd, Berlin, Germany.WHO (2004): Guidelines for drinking-water quality. Third edition, Volume 1: recommendations, Geneva, Switzerland.
Subproject A3 IMPETUS 125Teilprojekt A3Funktionale Beziehungen zwischen raumzeitlicher Vegetationsdynamik undWasserkreislaufFunctional relationships between spatio-temporal vegetation dynamicsand water cycleAntragsteller / ParticipantsProf. Dr. G. Menz (Koordinator)Geographisches Institut, Universität BonnProf. Dr. W. BarthlottBotanisches Institut und Botanischer Garten,Universität BonnProf. Dr. H. Goldbach / PD Dr. J. BurkhardtInstitut für Pflanzenernährung, Universität BonnProf. Dr. S. PorembskiBotanisches Institut und Botanischer Garten,Universität BonnGeographie:FernerkundungGeography:remote sensingFach / DisciplineBiologie:VegetationsökologieBiology:vegetation ecologyLandwirtschaft:Ökophysiologie und PflanzenernährungAgriculture:eco-physiology and plant nutritionBiologie:VegetationsökologieBiology:vegetation ecologyZusammenfassungLandnut<strong>zu</strong>ng und Landbedeckung sind Schlüsselparameter im hydrologischen Kreislauf undwichtige Steuergrößen für die sozio-ökonomischen Bedingungen der im Untersuchungsraumlebenden Menschen (z.B. in Hinblick auf Ernährungssicherung, Agrarkolonisation, Migrationu.a.). Im Untersuchungsgebiet sind in den letzten Jahren starke Veränderungen der Landnut<strong>zu</strong>ngund Landbedeckung <strong>zu</strong> verzeichnen. Deshalb sind Voraussagen <strong>zu</strong>künftiger Entwicklung derLandnut<strong>zu</strong>ng und Landbedeckung in Abhängigkeit von in Szenarien definierten Randbedingungenwichtige Entscheidungshilfen für Entscheidungsträger in Hinblick auf tragfähige Entwicklungund nachhaltiges Ressourcenmanagement. Hierfür wurden in der 2. IMPETUS Projektphaseim Teilprojekt A3 Modellierungsketten aufgebaut, mit denen <strong>zu</strong>künftige Ausprägungen derLandnut<strong>zu</strong>ng und Landbedeckung in unterschiedlichen räumlichen Skalen räumlich explizit berechnetwerden können. In einem interdisziplinären Ansatz wurden die vielfältigen Erkenntnisseüber das dem Landnut<strong>zu</strong>ngs-/Landbedeckungswandel <strong>zu</strong>grunde liegende Prozessgefüge in dieModellierung eingearbeitet. Neben Aussagen über <strong>zu</strong>künftige Ausprägung von Landnut<strong>zu</strong>ng undLandbedeckung dient die Modellkette auch <strong>zu</strong>r Erkennung von Zentren kritischer Entwicklung
126IMPETUS Subproject A3(„Hot Spots“), an denen es z.B. in Zukunft <strong>zu</strong> Konflikten aufgrund von Mangel an verfügbarenLand kommen kann. Es zeigte sich, dass bei einer weiterhin ungeplanten Agrarkolonisierung ineinigen Gebieten bis 2025 die letzten Wälder und Waldsavannen verschwunden sein werden. Aufder Grundlage dieser Ergebnisse können Entscheidungsträger entsprechende Interventionsmaßnahmenableiten.Die aus der Modellierungskette abgeleiten Raummuster der Landnut<strong>zu</strong>ng und Landbedeckungwerden auch als Input für Klima- und hydrologische Modelle herangezogen, wodurch genauereErgebnisse erzielt werden können.Um Entscheidungsträgern ein Werkzeug <strong>zu</strong>r Abschät<strong>zu</strong>ng der Auswirkungen geplanter Interventionsmaßnahmenauf die Landnut<strong>zu</strong>ng/Landbedeckung an die Hand <strong>zu</strong> geben, wurde begonnendie Modelle und Modellergebnisse in einfach <strong>zu</strong> bedienende Entscheidungsunterstüt<strong>zu</strong>ngssysteme(„Decision Support Systems“-DDS) <strong>zu</strong> integrieren. Hierbei stand <strong>zu</strong>nächst die Ermittlungdes Bedarfs, der technische Ausstattung und des Ausbildungsstands der entsprechenden Stellenin Benin im Mittelpunkt. In der dritten Projektphase werden die DSS fertig gestellt und in Benininstalliert. Auch für die Entwicklung von DSS der anderen Problemkomplexe (z.B. Feuer, Kleinstauseenusw.) wurden wichtige Vorarbeiten unternommen.Die im Rahmen von IMPETUS weiter entwickelte Drohne für die räumlich und zeitlich hochauflösende Fernerkundung wurde für Kalibrierung und Validierung von Modellergebnissen sowie<strong>zu</strong>r Untersuchung von Siedlungsdynamik und Vegetationsbestimmung sehr erfolgreich eingesetzt.Hierbei gibt es auch eine Zusammenarbeit mit der GTZ <strong>zu</strong>r Evaluierung von Maßnahmen<strong>zu</strong>r Landkonservation und <strong>zu</strong>m Erosionsschutz im Rahmen des Programms „Anpassung anden Klimawandel“.Auf einem nationalen Maßstab wurde eine für Stakeholder interessante Methode <strong>zu</strong>r Berechnungder agrarischen Marginalität weiterentwickelt und auf die Bedingungen in Benin angewandt. Siezeigt agrarisch marginale Flächen und ist für eine Agrarplanung von Bedeutung. Weiterhin lassensich auch die Auswirkungen von Veränderungen der klimatischen oder hygrischen Bedingungenauf die agrarische Marginalität simulieren. Die hohe Aussagekraft der Ergebnisse beigleichzeitiger vergleichsweise guter Verfügbarkeit der benötigten Inputdaten weist diese Methodeals sehr geeignet für den Einsatz in Benin aus. Die Ergebnisse der agrarischen Marginalitätdienen auch als Grundlage für die DSS anderer Problemkomplexe.Bei der Untersuchung der anthropogenen Nut<strong>zu</strong>ng der Waldressourcen und der Modellierungihrer Konsequenzen auf die ökosystemare Stabilität wurden interessante Ergebnisse erzielt, diefür eine nachhaltige Nut<strong>zu</strong>ng von Wäldern und Weiden unerlässlich sind. Aufbauend auf eineumfassende Datenbasis die durch intensive Feldarbeit und der engen Zusammenarbeit mit Institutionenin Benin gewonnen wurde, gelang es, die funktionalen Zusammenhänge zwischen unterschiedlichenHolzentnahmetechniken und ökosystemarer Stabilität für die auftretenden Vegetationsgesellschaften<strong>zu</strong> beschreiben. Dies mündete in der Schaffung eines Modells <strong>zu</strong>r Abschät<strong>zu</strong>ngvon Ertrag und ökosystemarer Stabilität von Waldtypen bei unterschiedlichem Forstmanagement.Hiermit können auch die Auswirkungen unterschiedlicher Klimaszenarien auf Ertrag undStabilität abgeschätzt werden. Dies ist auch in Hinblick auf Einkommenssicherung und Vulnerabilitätvon Bedeutung. Interessant sind in dem Zusammenhang sind auch die detaillierten Unter-
Subproject A3 IMPETUS 127suchungen <strong>zu</strong>r Veränderung der Vegetationsdynamik je nach Weidemanagement, die in Zusammenhangmit der Universität Abomey-Calavi durchgeführt werden.Vor dem Hintergrund der Ernährungssicherung einer stark steigenden Bevölkerung bei gleichzeitigauftretender Bodendegradation, verkürzten Brachezeiten und einer prognostizierten Niederschlagsrückgangsind die Untersuchungen <strong>zu</strong>r Ökophysiologie und Pflanzenernährung vonsteigender Bedeutung. Ein Schwerpunkt lag hierbei auf der Ermittlung des Wasserbedarfs vonNutzpflanzen in Abhängigkeit <strong>zu</strong>r Nährstoffversorgung. Da die Nährstoffversorgung durch unterschiedlicheAnbaumethoden gesteuert werden kann, sind die Ergebnisse für eine Ernährungssicherungvon großer Bedeutung, besonders bei einer erwarteten Ressourcenverknappung. Hierfürwurden umfangreiche Felduntersuchungen durchgeführt, da für diese Klimazone eine nurun<strong>zu</strong>reichende Datengrundlage vorhanden ist. Die Ergebnisse der Feldarbeiten wurden <strong>zu</strong>r Modellkalibration(EPIC) verwendet. Dies ermöglicht die Berechnung des Ertrags bei unterschiedlichenKlimaszenarien und prognostizierter Degradation des Bodens. Hiermit können auch dieDüngergaben optimiert werden. Die Kalibrierung des Modells an die Verhältnisse in Benin stellteinen wichtigen Fortschritt dar, da <strong>zu</strong>m ersten Mal die bedeutende Feldfrucht Yams in das Modelleingebaut werden konnte.Mit der Schaffung des IMPETUS Atlas, den es sowohl in einer Druckversion als auch ein einerkostengünstigen digitalen Version gibt, wurden neue Wege bei der Kommunikation von Forschungsergebnissenbeschritten. Hiermit ist es möglich noch während der Laufzeit des Projekteserhobene Daten und Forschungs(teil)ergebnisse den Stakeholdern und anderen InteressiertenPersonen oder Projekten als Diskussionsgrundlage <strong>zu</strong>kommen <strong>zu</strong> lassen. Das weitgehende Fehlenanderer Informationsquellen wie z.B. National Atlanten in Benin steigert die Bedeutung desIMPETUS Atlas.SummaryLand use and land cover are key parameters in the hydrological cycle and has importance forthe socio-economic conditions (e.g. food security, agricultural colonisation, migration). In thearea of investigation strong changes in land use and land cover have been observed within thelast years. Therefore sound projections about the state of future land use and land cover underspecified boundary conditions, as formulated in the IMPETUS scenarios, are important for decisionmakers. On that information basis sustainable development and lasting resource managementcan be put into action. To compute the future patterns of land use and land cover accordingthe scenarios, modelling chains had been set up in different spatial scale. In an interdisciplinaryapproach the manifold knowledge about the underlying processes triggering land use and landcover change (LUCC) had been investigated, parameterised and put into the model chains. Besidethe future pattern of land use and land cover, it is possible to detect so called “hot spots” ofcritical developments like shortage of arable land, which can lead to conflicts. The model resultsshow that with uncontrolled agricultural colonisation in some areas the forests and savannaswould have disappeared in the year 2025. On the base of this results decision makers can putappropriate intervention measures in action.The results of the LUCC modelling are used as well for other models (e.g. hydrologic or meteorologicalmodels) to improve the quality of their outputs.
128IMPETUS Subproject A3To supply decision makers with appropriate tools to estimate the impacts of planed interventionmeasures on the land use and land cover the integration of models and model results into decisionsupport systems was started. At the beginning a focus was set on the assessment of the demandas well as the evaluation of the technical equipment and skills of the counterparts in Benin.Within the third IMPETUS phase the DSS will be finished and established in Benin. For the implementationof the DSS of the other problem clusters (e.g. sustainable fire management, smallscale barrages and other) important work steps were performed as well.The drone, which was further developed within the IMPETUS framework, was used successfullyfor the calibration and validation of modelling results as well for the investigation of settlementdynamics and assessment of the vegetation dynamics. Hereby a successful collaboration with theGTZ to assess the success of land conservation and anti erosion measures in the framework ofthe program “Adaptation to Climate Change” has been established.For a small spatial scale, covering whole Benin, an interesting method to compute the marginalityof agricultural land use was applied and further developed. Agricultural marginal areas canbe assessed. This is important for a sustainable agricultural planning. With this method it is possibleto assess the impact of changing climate or hygric conditions on the agricultural marginality.The high significance of the results and the good availability of the required input data proofthe suitability of that method for the use in Benin. The computed marginality of agricultural areasserves as input for the DSS of problem clusters.Interesting results in regard of anthropogenic use of forest resources and modelling of their consequenceson the eco-systemic stability have been obtained. These results are important for asustainable use of forest and pasture. Based on a comprehensive database, gained by intensivefield work and close cooperation with institutions in Benin, it was possible to describe the functionalrelationships between the different forest management systems and the eco-systematicstability of different forest and savannah types. With this knowledge it was possible to set up amodel to estimate the revenue and the stability of forest and savannah types under different managementpractices. Therewith it is possible as well to estimate the impact of different climatescenarios on revenue and eco-systematic stability. This is relevant in regard of food security andvulnerability. Interesting in this context are the detailed investigations of changes of the vegetationdynamics in regard of different pasture management, which are conducted with the universityof Abomey-Calavi.In regard of food security for an increasing population by increasing soil degradation, shorterfallow periods and decreasing precipitation, the investigation of the eco-physiology and plantnutrition have an increasing relevance. The focus of this work was set on the investigation of thewater demand of crops in relation to the nutrition. With proper land manure practice the yieldcan be increased even by decreasing precipitation, this is important in regard of food security bylimited resources. To investigate the relation between biomass and nutrients intensive field experimentshad been conduced, because the data base is insufficient for that climate zone. Theresults of the field experiments were used to calibrate a model (EPIC). With this model it is possibleto compute the yield under different climate scenarios and the expected soil degradation.As well it is possible to identify the optimal fertiliser in quality and quantity. The calibration of
Subproject A3 IMPETUS 129the model to the conditions in Benin is an important achievement, because the first time the modelcould be used for yams.With the creation of the IMPTEUS-Atlas, available in a printed or a cost-effective digital form,new ways of communicating the research results has been carried out. With the IMPETUS-Atlasthe distribution of gained data and research results to interested people in Benin is possible. Soa competent discussion with the stakeholders and other interested persons can be initiated beforethe project is finished. In Benin the lack of information sources like a national atlas increases theimportance of the IMPETUS-Atlas.A3-1: Investigation and modelling of the changes in land use and land coverThe land use and land cover are key parameters in the meteorological system and the hydrologicalcycle. Furthermore land use and land cover has strong impact on the socio-economic conditions(e.g. food security, migration and other) (GLP, 2005). In the area of investigation therewere strong land-use and land-cover changes (LUCC) observed. Therefore there is a strong demandto model scenarios for future development of land use and land cover as information basefor sustainable development and resource management.In the first IMPETUS project phase techniques to assess land use and land cover of the past andthe present with remote sensing techniques had been developed successfully. As well the spatialexplicit land use and land cover change has been derived with advanced change detection methods.In the second phase the analyses of the underlying processes triggering the LUCC as well asthe set up of scenarios of future development has been one focus of the work. The most importantanthropogenic caused changes in land use and land cover had been the conversion of savannasand forests into agricultural area and settlements (Judex, 2003). To assess the extension ofagricultural land for different time steps a special classification method based on a decision treewas developed. Therewith a classification accuracy of 82% could be reached, which is very goodfor such heterogeneous, highly dynamic vegetation (Thamm et al., 2005).After an extensive analyse of available land use and land cover change models a multi-scalemodel chain was set up to analyse scenarios of LUCC in different spatial scales and organisationlevels (Thamm et al., 2005). Thereby the integration of research results of other disciplines (e.g.socio economists, social geographers) was a great help to design an appropriate model framework.The local scale of the model chain is covered by an LUCC analyses along the roadOuberou and Kikilé where good input data gained from own inquiries where available (Orekanet al., 2006), the regional scale is represented by modelling the HVO. Modelling of the totalcatchment of the Ouémé proves the ability of our model chain to give information for biggerareas. It was a challenge to deal with the different precision of the available input data and thedifferent processes. Additional in case studies the settlement development was modelled in anagent based approach (Borgwardt, 2004). For the modelling LUCC in a small spatial scale andthe total Ouémé catchment the CLUE-S model framework (Verburg et al., 2000) is used. To improvethe user friendliness and give more possibilities to integrate and combine other model approachesthe eXtenable Unified Land Use modelling platform (XULU) was created in cooperationwith the Institute for Computer Science of the University of Bonn (Schmitz, 2005).
130IMPETUS Subproject A3The used models are mainly based on statistic-dynamic approaches, which turn out to be mostsuitable for the special situation in the areas of investigation regarding the complexity of the underlyingprocess dynamics and available input data. For local studies with less complex processdynamic agent based methods (e.g. cellular automata) had been used.Due to the fact, that the occurrence of the spatial patterns of the land use and land cover changesare the results of highly complex, highly interrelated processes with different driving forcesmanifold input parameter of different disciplines are needed. In a good co-operation with othergroups of IMPTEUS especially the socio-economists and agriculturists valuable additional information(e.g. census database) could be gained which are important to parameterise the drivingforces triggering the LUCC.As a example for local modelling based on GIS, satellite image and socioeconomic data collectedfrom the very local level i.e. household level in the villages along the road Wouberou-Kikele, the CLUE-S model was run to predict the LUCC based on two scenarios from 2000 to2025 (Orekan et al., 2006): Business as usual (1) and environmental damaged scenario (2). Scenario1 deals with low population increase and forest change rate of 1.8% while scenario 2 ischaracterized by an increase in agricultural area rate of 6.09% followed by a high populationgrowth rate. The output of the modelling results can be seen on the following figure.Fig. A3-1: Simulated land-use 2025 and 2020 according to scenario 1: Business as usual (left) and scenario 2:Environmental damaged scenario (right)The most important land-use changes occur from north east to south west along the main road (inblue colour). A high percentage of natural vegetation (forest) decreases in the profit of agriculturalarea and settlements. Population density and distances (to settlements, to road and tostream) are supposed to be the main drivers. A little part of the forest will remain in the worsecase (scenario 2) in 2025 when none sustainable measures are set up for better resources management.The LUCC modelling in a regional scale (Judex et al., 2006) was computed in a spatial resolutionof 500 m. The following data were used as input: Distance to road, cost-weighted-distanceto bigger settlements (>5000 inhabitants), population density, area of the protected forests andthe suitability of soils for agriculture. These factors had been derived by multiple regressionanalyses. As a measure for the quality of the regressions the ROC-Curve (Relative OperatingCharacteristics) was computed (Pontius & Schneider, 2001). Based on it the AUC-index (Areaunder curve) had been derived specific for every land use class. The resulting values differ be-
Subproject A3 IMPETUS 131tween 0.69 for dense forests (thereby religious taboos, which are mainly controlling the appearancefor that specific land use class could not be parameterised satisfyingly) and 0.9 for settlement.A total fit would result in a value of 1.0 (Fig. A3-3 and Fig. A3-4).Different scenarios for the development of LUCC had been computed, based on the boundaryconditions for the scenarios formulated by IMPETUS. The developed model chain allows thedetection of hot spots of critical development, like areas where shortage of arable land will occur,so appropriate measures (e.g. improvement of the agricultural system) can be enforced.Fig. A3-2: ROC Curve of the multivariate model ofthe agricultural areas (AUC = 0.88)Fig. A3-3: ROC Curve of the multivariate modelof dense savannah and dense forests(AUC = 0.89)Furthermore the impact of different intervention measures can be evaluated with the developedmodel chain, as it is shown in Fig. A3-4. The example shows that the development of agriculturalland is strongly related with the state of the protected forests. If the authorities won’t assurethe protection of the forests, a strong conversion of forest to agricultural land will take place.Another intervention scenario points out the “pull factor” of new roads for mobile farmers. Theysettle along the new roads and start to convert tree savannahs and forest into agricultural land.The models can help to optimise the roadway arrangement for new roads. This information isimportant for decision makers and sustainable resource planning.The various demands on the land use modelling showed that the up to now available LUCCmodels have limitations. To overcome restrictions of the models and for a better adaptation onthe specific regional conditions XULU, a scalable and extendable modelling platform was created.It is quite user friendly and allows the integration of new concepts like the combination ofstatistic and agent based modelling approaches. XULU is realised in JAVA with a componentbased concept using open source libraries. The core consist of modules which provides basicfunctions like in- and export of raster and vector data, visualisation of data (in real time too), andsimulation control modules (start, stop, save, time stepping, et al.). The concept is shown in Fig.A3-5. Models can be realised either as modules or as plug-in. In a first step for the proof of conceptthe CLUE-S model was integrated successfully. In future it will be the basis tool for future
132IMPETUS Subproject A3model applications and developments. Due to its flexibility is possible to integrate it in decisionsupport systems. It is “no cost software”, very flexible and can be distributed in developingcountries.Fig. A3-4:Results of three scenarios of future land-cover in the upper Ouémé catchment (Settlements: red,agriculture: brown, forests: green, other savannas: light green). Expansion scenario (a), removal offorest protection of the “forêt classée de l’Ouémé superieure” (b), construction of a new road (c).Protected forest and new road are shown in violet.Fig. A3-5:Communication between platform and modelModelling the agricultural marginality for BeninAgricultural marginal sites are characterised by various environmental constraints limiting agriculturalland use and a high risk of land degradation caused by intensive agricultural activities.The identification of such marginal sites is of specific importance for a sustainable land use andconservation of natural resources for agricultural production. Beyond, land degradation has astrong impact on the hydrological cycle. For the determination of the agricultural marginality inBenin with a spatial resolution of 1 km, the model approach of Cassel-Gintz et al. (1997) wasfollowed with slight modifications and extensions. They defined the marginality index on a
Subproject A3 IMPETUS 133global scale on a spatial resolution of 0.5°. This index is the key element in PK Be-E6 and partof PK Be-L4.In a first step, it was analysed whether the defined six input parameters of the global approachare available and feasible on a national scale in a spatial resolution of 1km. This question wasdiscussed intensively with other scientists from the IMPETUS project (especially A1, A2 andA4) and stakeholders in Benin. Analyses and discussions showed that the limited number of inputdata makes the approach very attractive for national stakeholder. Furthermore, the parametersare generally suitable on a national scale, except for the constraint 'poor soils'. This parameteris originally calculated over the fertility factor S f defined by Leemans and van den Born(1994) which is based on the global soil map assessed by Zobler (1986). On the one hand,Zobler's database which is based on the FAO soil map is spatially not very sophisticated. On theother hand, there are not much detailed information about the S f -factor and its estimation. Inclose collaboration with A2 the approach by Leveque (1978) defining agro economic classesdirectly over the soil map was followed. Therefore, soil classes and evaluation methods weretransferred to the ORSTOM soil map of Benin. This meant a great improvement as the OR-STOM map is much more precise considering spatial and thematic. Whenever possible, appropriateinformation derived from remote sensing were used due to their up-to-dateness, high temporaland spatial resolution. Examples are the determination of the stream net work and the slopewhich were derived from SRTM (Shuttle Radar Topography Mission) data. They are necessaryfor calculating the potential irrigation capacity and the risk of soil erosion due to steep slopes. Ina second step, the feasibility of the original membership function fuzzy-fication the input datasets was tested. Due to the now higher resoluted images, all original membership functions hadto be modified. This process was done in consultation with national experts, like Dr. Igué (IN-RAB) and Prof. Baglo (ABE) as well as by using information found in literature. The possibilityto implement qualitative expert knowledge is one of the big advantages using fuzzy logic.In a further step, the fuzzy-fication of the input data as well as the marginality index was preliminaryvalidated. Until now nearly all input data were implemented and validated successively.The validation was done by using ground truth data collected during three field campaigns. Forthe validation of the general approach, different hypotheses have been defined and preliminarytested. For example, it is assumed that strong human-induced pressure on arable land resourceson marginal sites will result in land degradation. Therefore, actual land degradation derived fromtime series analyses of yearly sums of rainfall (from A1) and integrated NDVI (from NOAAGlobal Inventory Monitoring and Modelling Studies (GIMMS)) were used for the years 1982-2003. In Benin, the correlation between rainfall and iNDVI was proofed to be strong and istherefore useful information for the determination of changes in land performances and thus,land degradation. In a next step, this outcome, the marginality index and demographic data havebeen overlaid and analysed to quantify the visually existing relation between the data.Other ActivitiesApplication and improvement of a UAV (drone)To improve classification, change detection and modelling results there is a demand on trainingand test data in a high spatial resolution. As well for investigation of process dynamics like bush-
134IMPETUS Subproject A3fire, urbanisation, erosion etc. aerial photos in a high spatial resolution are needed. To meet thedemand a low cost drone was implemented and further developed. This is an interesting toolespecially for developing countries where the access to air planes is limited. Beside the work inIMPTEUS the drone was utilised for archaeological research in collaboration with the UniversityAbomey-Calavi and for investigation of vegetation structures in co-operation with the BIOTAproject in the Pendjari National park. In collaboration with the GTZ the drone is used to evaluateland conservation measures in the framework of the program “Adaptation to the climate change”in two catchments.For a further improvement of the system there are collaboration with the Institute of PhotogrammetryDüsseldorf and the Institute for Flight System Technique of the DLR in Braunschweigand the Monash University in Melbourne (Prof. Egan).Creation of the IMPETUS AtlasIn many research projects collected data model results and research results are not available forstakeholder and interested people in the guest countries. To meet that demand we created theIMPETUS-Atlas (Thamm et al., 2005). This should help to minimize the gap between scientistsand stakeholders or other users. It covers diagnostic and modeling results from various disciplines,e.g. meteorology, hydrology, geology, agronomy, botany, remote sensing, socioeconomy,anthropology and medicine in the form of maps, text, and GIS-like applications. Theinformation is presented in an understandable and user friendly so that non-experts can benefitfrom it as well. The digital application was developed in JAVA. Therefore it can be run in aregular internet browser without installation of additional software and independent from thecomputer platform. This also ensures the easy integration into World Wide Web pages. Georeferencedraster images and vector data can be displayed and overlaid interactively in the mapviewer which also features links to related data, graphics or additional information in HTML orPDF format. The print version presents detailed thematic maps with additional explanatory textand continuative bibliographical references on. It is realised as a loose-leaf-collection, so thatsingle maps can be taken out for comparison or analysis and new sheets can be integratedsmoothly. Some maps are printed on transparencies which can be overlaid to enable analyses ofdifferent layers. To save costs and time the atlas is printed as well in an A4 Version.
Subproject A3 IMPETUS 135A 3-2: Analyses of anthropogenic use of resources and modelling of it’s consequences onthe stability of the ecosystemProblemIn the Soudanian zone, land use change was strongly accelerated during the last 30 years due toan improvement of infrastructure and an increase in population. The most drastic and directlyobvious land use change is the conversion of forests, woodlands, and savannas to arable land andsettlements (FAO, 2001). The forest-savannah mosaic, however, can also be strongly influencedby an increase of less destructive land use forms, above all selective logging of valuable treespecies and grazing activity (Bassett et al., 2003). Detailed knowledge on the consequences ofboth impacts on the ecosystem is strongly needed in order to set up management plans.ObjectivesIn the second project phase the following objectives have been addressed for central Beninwithin this workpackage:• modelling the influence of selective logging on the dynamics of woodlands and savannas• continuing data collection of tree regeneration in permanent plots• assessing the magnitude of grazing activities and its influence on the woodlandsavannah-mosaic.With regard to the first objective a modelling approach set up during the first IMPETUS phasehad to be implemented and parameterised with collected data (e.g. stand structure, tree ringgrowth rate related to annual rainfall, logging intensity). The model should allow the regionalisationof results as well as the implementation of different scenarios for logging and rainfall regimes.Concerning the second objective the establishment of a sound data base with respects totree regeneration was continued due to the high annual variability of regeneration. Within thethird objective data on grazing and fire occurrence and their impacts on vegetation and tree regenerationhad to be addressed in different regions in central Benin. Both data from the secondand third objective are required in order to improve further modelling of the influence of influenceof anthropogenic use of natural recourses on the dynamics of woodlands and savannas incentral Benin.Modelling approachIn the second phase the modelling approach to model the influence of selective logging on thedynamics of woodlands and savannas was specified. In a first step the influence of selective loggingon ecological properties (e.g. stand structure and woody biomass) of the woodlands, weremost logging activities take place, and on the local income was investigated. Model runs wereperformed for Isoberlinia doka which is the dominating most logged tree species in the respectivewoodlands.
136IMPETUS Subproject A3Transfer of dataPK Be-L.1, PK Be-L.4,PK Be-L.5, PK Be-E.5PK Be-E.1Target figureecosystemstand t i+1Onset of rainy seasonstand t iEnd of dry seasonstand t iEnd of rainy seasonstand t iOnset of rainy seasonWoodextractionmodellExtractedtimber boardsMortality causedby fellingNatural mortalityWoody incrementWoodyincrementmodellTarget figureeconomyLocal forestryincomeSilviculturalmanagementScenariosRainfallInterventionscenariosFig. A3-6:Flow chart of the modelling approach applied to model the target Fig. “local forestry income”and “ecosystem properties” under three silvicultural-management scenarios andthree rainfall intervention scenarios (see details in the text).In PK Be-L.2 a modeling approach chosen to model local forestry income and ecosystem propertiesby selective logging of I. doka from 2006 to 2025 represents I. doka stands and theirchange within this time period caused by woody increment, natural mortality and mortality dueto felling (Fig. A3-6). At the beginning of each model run an I. doka population is created on thebasis of tree inventories sampled in 2002 in the Aguima catchment (Orthmann, 2005). Accordingto the densities found for the vegetation type ‘woodland dominated by Isoberlinia doka’ a treepopulation was created and dbh of each tree individual was chosen randomly within the range ofeach diameter class (solution = 1 cm). Woody increment during the rainy season was calculatedfor each individual from the growth function of the biomass model. In our tree ring study(Schöngart et al., in press) we found a strong linear response of woody increment and annualrainfall. This relation is implemented as a correction term of woody increment in dependence ofannual rainfall to incorporate climatic variability in the model.In our modeling approach three rainfall regimes are implemented. From a given mean and standarderror a density function assuming a normal distribution was derived from which annualrainfall was chosen randomly for each year. As ‘current rainfall’ the density function is based onthe rainfall events from 1972 until 2001 (30 years; mean 1183.7 mm/y). As “future rainfall” –under consideration of global change – the mean was derived from the modeling results of thesubproject AB1 (mean 1000mm/y). As both rainfall scenarios did not differ substantially a third‘drastic rainfall reduction’ scenario was set up with a mean annual rainfall of 750 mm.
Subproject A3 IMPETUS 137Natural mortality of tree individuals of all diameter classes was set to be 1% (compare Hartshorn,1990; van der Meer & Bongers, 1996). Mortality caused by felling reflects the felling intensityand was varied according to the three scenarios described in Tab. A3.1. The probabilityof timber board extraction for tree individuals of different size classes was derived from fellingobservations of I. doka in Orthmann (2005). In the model, the number of extracted timber boardsfor each felt tree individual was chosen randomly according to these probabilities. The value of atimber board sold in the country side is 2,000 CFA = 3.76 $ used to calculate the yearly localforestry income that is the target figure of the model. With regard to ecosystem properties outputof the model are changes in stand structure and woody biomass at the end of the dry season ofeach year (compare Fig. A-6).Tab. A3.1:Description of scenarios developed in the framework of the IMPETUS project and respectivemortality rate by felling for Isoberlinia doka tree individuals used to model local forestry incomefrom 2006 until 2025.ScenarioMortality rate by loggingB1: ‘on pousse’ The felling area is divided into 20 sub-areas to establish a rotationsystem for felling; each year all tree individuals > 45cm dbh of onesub-area are felled (mortality rate = 100% every 20 years).B2: ‘on fait avec’ All tree individuals > 45cm dbh are felled (mortality rate = 100%each year).B3: ‘on se débrouille’ All tree individuals > 45cm dbh are felled (mortality rate = 100%each year); tree individuals with a dbh of 30-≤45 cm are felled with aprobability of 5% in 2006 and 100% in 2025 – with an yearly increaseof 5% in between.ResultsModelling the influence of selective logging on local forestry income and ecosystem propertiesLocal forestry income is one target figure of our PK Be-L.2. Results of this target figure modeledfrom 2006 to 2025 for the three scenarios (details in Tab. A3.1) and two rainfall regimes arepresented in Fig. A3-7.Total local forestry income in the modeled time span was highest for scenario-B3 and lowest forscenario-B1. However, for scenario-B3 large benefit occurred during the first 10 years and localforestry income decreased strongly during the last 10 years (Fig. A3-7). Scenario-B2 revealed alarge local forestry income in 2006 due to the logging of all trees larger 45 cm dbh from the initialpopulation. Thereafter a constant local forestry income was modeled until 2025. For scenario-B1local forestry income was low in 2006 and increased to values in 2025 that were largerthan those of scenario-B2 and scenario-B3 (Fig. A3-7).This tendency was similar for both rainfall regimes. However, the rainfall regime ‘drastic rainfallreduction’ (750 mm/y) showed constantly lower values for local income compared to the ‘currentrainfall' regime (1183.7 mm/y) due to lower tree-ring increments during dryer years. Eventhough visually a difference between the rainfall regimes appears, a one-tailed statistical test
138IMPETUS Subproject A3(Steinke & Hennenberg, 2006) applied for each year revealed no significant differences (α =0.10) as a matter of large standard deviations of the data sets.Local forestry income (USD)504030201005040302010050403020100B1: on pousseCurrent rainfall: 130 US D / 20 yDrastic rainfall reduction: 104 USD / 20 yB2: on fait avecCurrent rainfall: 230 US D / 20 yDrastic Year rainfall reduction: 177 USD / 20 y20062007200820092010201120122013201420152016201720182019202020212022202320242025B3: on se débrouilleCurrent rainfall: 354 US D / 20 yDrastic Year rainfall reduction: 324 USD / 20 y2006200720082009201020112012201320142015201620172018201920202021202220232024202520062007200820092010201120122013201420152016201720182019202020212022202320242025Fig. A3-7:Current rainfall (1183.7 mm/y)YearDrastic rainfall reduction (750 mm/y)Modelled mean local forestry income from 2006 to 2025 for the three scenarios (details inTab. A3-1) and for two rainfall regimes (current rainfall and drastic rainfall reduction). Data forthe third, future rain fall are not presented. Error bars represent the standard deviation (replicates =100).Modeled results of changes in tree structure and biomass show similar courses as local forestryincome and are therefore not presented here. All data are made available within the IMPETUSframeworkto be incorporated into modeling approaches of PK Be-L.1, PK Be-L.4, PK Be-L.5and PK Be-E.5.The presented results can serve as a sound base for decision maker to develop silvicultural managementplans for central Benin. The importance of these results has to be stressed by as comparabledata for the region are absent. However, the model is limited to attribute long-term predictionsbecause regeneration and factors that drive regeneration – both studied during the first andsecond IMPETUS phase – are not jet implemented into the model. This extension is a challengefor our future work and is of strong importance for the modeling of climate – land cover relationsand vice versa within the IMPETUS framework.
Subproject A3 IMPETUS 139Tree regeneration in permanent plotsTree regeneration was sampled from 2001 until know in permanent plots in seven dominantvegetation types and gaps provoked by selective logging. Total species number and density ofseedlings differed strongly and simultaneously between the years across all vegetation types andgaps. This showed that some years were in general favourable and others were unfavourable fortree recruitment. In favourable years for recruitment characterized by a high species number anddensity of seedlings, differences between vegetation types and gaps were much more obviousthan in the most unfavourable year (e.g. 2004). In contrast, saplings appeared to be mainly influencedby the density of seedlings of the former year. In general, it can be assumed that higherrecruitment of seedlings should occur in wetter years. However, the pattern found was the inversewhich can be explained by the influences of fire, grazing or competition (for details seeOrthmann, 2005). In order to distinguish the effect of the different groups of parameters whichare strongly linked long term analyses as started in this project are highly challenging and neededfor the above described modelling approach.Magnitude of grazing activities and its influence on the woodland-savanna-mosaic.A detailed study on grazing regime and impact of grazing on the territory of the village Doguè,gives an insight into the grazing activities of the Upper Ouémé Catchment. First Fulani settlersarrived in 1996 (Wotto, 2003). Until 2003, 55 Fulani households were counted which ownedabout 6,000 cattle. Calculations of Wotto (2003) revealed already a three times overcharge of thepastures of the considered area. It can be assumed that the migration of farmers into the studyregion will continue and will lead to a conversion of large areas into farmland. Thus, the availabilityof woodland-savannah sites as will decline continuously. In addition, further restrictionfor Fulani to use areas in the National parks in northern Benin as well as areas of the “Forêt classée”surrounding Doguè will lead to an increasing pressure on the pasture of this region (Wotto,2003). This has strong impact on the regeneration of trees, on fire intensity and frequency as wellas on vegetation composition (Orthmann, 2005; Wotto, 2003). Based on these results a detailedstudy on the impact of grazing on vegetation dynamics was set up. Ismael Toko started in 2005his PhD study in close cooperation with Prof. Dr. Brice Sinsin.A3-3 Eco-physiology and plant nutritionPressure on land resources and spreading of the cultivated area depends to a great deal on theagricultural productivity, besides demographic growth. Consequences are an increasing demandfor food with a tendency of degradation of soils due to crop production with a shortening of fallowperiods. In order to prevent an expansion of land use and a decrease in soil fertility a sustainablesoil and nutrient management is essential. In addition water consumption of crops dependsstrongly on a balanced nutrient supply: the higher the nutritional disequilibria, the higherunproductive water losses.Furthermore agriculture in northern Benin is generally rain-fed leading to increased sensitivity ofcrop yields to climatic variations mostly of precipitation which can result in seasonal drought,variation in the length of growing season and changes in distribution of rainfall within the growingseason.
140IMPETUS Subproject A3Computer-based analytical tools, such as crop simulation models are valuable approaches to predictpotential yields under different environmental conditions. The agro-ecological model EPICis used to estimate the influences of optimized management strategies (prior fertilizer applications)and to predict the impact of climatic variations and soil degradation to crop production inBenin.Objective target• Field experiments• • Acquisition of required input data as well as data for calibration and validation of EPICmodel conducted on two different management levels (traditional farmer practice andimproved management with fertilizer application) (2004-2006)• Modelling• •Parameterisation of crops, treatments and fertilizers• •Calibration and validation of EPIC model• •Simulation of scenarios regarding climate variability (mostly precipitation) and soil degradationAnalysis• •Evaluation of the actual nutrient status of the important crops by conventional plant andsoil analysis and DRIS evaluationField experimentsSince 2004 test sites in Dogué (Upper Ouémé Catchment) with 30 x 30m were installed formaize, sorghum, cassava and yam with prior focus to collect the required data for EPIC model.Two different levels of soil fertility were conducted using different treatments. The treatmentswere on the one hand the traditional farmer’s practice without any fertilization (T0) and on theother hand with mineral fertilizer application (T1). The mineral fertilizer applications consists ofN-P-K (14:23:14) and Urea (Tab. A3.2).Tab. A3.2: Fertilizer applications for the T1 treatments 2004-2006Maize / Sorghum Yam CassavaN - P - K 300 kg/ha at planting 200 kg/ha at planting100kg/ha 60 DAP100 kg/ha at planting100 kg/ha 60 DAPUrea 100 kg/ha 40-45 DAP 100 kg/ha 60 DAP 50 kg/ha 60 DAP50 kg/ha 120 DAPOn each plot required model parameters for calibration and validation were measured such asdry matter accumulation, partitioning among plant parts, plant height and crop yield. Dependingon crop plant samples (5 for yams/cassava, 8 for maize/sorghum) were taken at four differentphysiological stages and separated in leaves, stem, cob / tuber. For determination of crop yieldfive squares per plot with 4 m² were sampled at harvest. Model input requires a multitude of parametersare. Weather data were provided by climatic stations of A3 and A2 and completed withpluviometers besides the experiment fields as EPIC is very sensitive to precipitation. Soil datacontains physical and chemical properties and were collected by drilling Pirkhauer-transects on
Subproject A3 IMPETUS 141each field. Regarding the high spatial variety mean values of each field transect are used formodelling shown in Tab. A3.3 for one of the maize fields (M1). Furthermore EPIC requires detaileddescriptions of management practices which must specify the timing of individual operationsby date. The operation schedule for one of the sorghum fields with fertilizer application isshown in Tab. A3.4. In addition permanent observation of plant population damages is implementedto determine the pesticide - damage factor in EPIC. For example in 2005 a storm destroyedapproximately 1/4 of a maize field. Other constrains of yields are caused by termites,monkeys or drought, the latter mostly for cassava with a growing period of 18 month includingthe dry season in Benin.Tab. A3.3:Measured soil properties used for EPIC input dataEPICSoil character Unites Layer 1 Layer 2 Layer 3 Layer 4parameterz Depth to bottom of layer m 0.15 0.28 0.48 0.85SAN Sand content % 62.1 71.3 65.7 65.3SIL Silt content % 29.7 17.5 18.4 14.8ROC Coarse fragments %vol 1.85 3.74 42.45 12.84pH(H2O) Soil pH 6.1 6.3 5.4 5.7WN Norg % 0.07 0.05 0.03 0.04CBN Corg % 1.4 0.7 0.4 0.4SMB Sum of bases cmol/kg 6..5 2.76 2.12 1.51CAC Calcium carbonate % 0 0 0 0CEC Cation exchange capacity cmol/kg 8.2 4.3 4.1 7.6AP assimilable P g/ t 15.6 8.1 3.7 0Tab. A3.4: Operation schedule on the sorghum fields 2005Year Month Day Crop Operation Volume2004 12 4 fallow slash and burning2005 7 20 fallow cutting biomass by coupe2005 7 22 fallow cattle plough depth 30 cm2005 7 27 sorghum sowing 8 plants/m²2005 7 27 sorghum fertilizer application NPK 300 kg/ha2005 8 20 sorghum weeding2005 9 10 sorghum fertilizer application Urea 100 kg/ha2005 9 12 sorghum weeding2005 12 8 sorghum harvestModellingEPIC (Environmental – Policy - Integrated Climate Model) is used to simulate yield and biomassdevelopment of important food crops (Maize, Sorghum, yam, cassava) in the HVO. EPIC iscomposed of physically based components integrating the major processes that occur in the atmosphere-soil-crop-managementsystem including weather, hydrology, erosion, plant growth
142IMPETUS Subproject A3and tillage. The model is evaluated to be suitable for simulations of crop yields depending to soilproperties, management strategies and climate scenarios (Adjeduwon, 2004; Tan 2003). ConsequentlyEPIC has the requisites for simulation of the IMPETUS scenarios.ParametrisationDeveloped for American conditions the EPIC parameters have to be adapted to the situation inBenin. Fieldwork in Benin is traditional done by handcraft so the most important procedures(slash and burn, field preparation by coupe, ploughing with a cattle plough, weeding and manualharvest) were new parameterized in the tillage file. Furthermore the most sensitive parameters inthe crop file were adapted for maize, sorghum and cassava as shown in Tab. A3.5.Tab. A3.5:Sensitive crop parameters used in the crop file for EPICCrop WA HI * TOP ** TBS *** DMLA * DLAP1***Bio-mass-Energy-Ratio(kg MJ -1)Corn 40.00****Sorghum 35.00****HarvestIndex(Mg Mg-1)Optimaltemperatureforplantgrowth(°C)Minimumtemperatureforplantgrowth(°C)Maximumpotential LAI1st pointon optimalLAI curveDLAP2***2ndpointon optimalLAIcurveRDMX**Rootdepth(m)0.20 – 0.30 28.00 8.00 2.50 15.05 50.95 0.800.20 – 0.25 30.00 10.00 2.00 – 3.30 15.01 50.95 0.80Yam 30.00 0.30 – 0.45 25.00 8.00 2.50 – 4.00 15.01 50.95 0.40Cassava 15.00 0.30 – 0.40 26.00 12.00 1.50 – 2.30 15.01 50.95 2.00Range 30.00 0.30 – 0.55 25.00 8.00 3.00 – 3.50 15.01 50.95 2.00* IIASA (2000); ** INRAB (1995); *** EPIC original files; **** Cabelguenne, M. (1990)As yam is not included in EPIC the parameters for potatoes where changed to values for yams.In order to get correct field rotations for long-term simulations and particularly to estimate theinfluence of a fallow shortening to yields range is included to simulate the growth of savannahgrass during fallow.Model testingAfter setting the parameters and transfer the measured data in EPIC conforms files first modelruns for model testing occurred. EPIC reproduces the time flow of the main inputs in a correctway: the rotations between fallow and crops were scheduled by the exact operation input daysand biomass accumulation showed a plausible growth curve for maize and sorghum. Comparisonof measured yields (three fields per crop with T0) with model results is represented in Fig. A3-8.Comparison of data is separated in YLD (yield data) and BIOM (total biomass). Results formaize are already in a good conformity but both, YLD and BIOM with a tendency to overestimationin EPIC. This requires a better calibration of PHU (potential heat units) with high influenceto BIOM and HI (Harvest index,) which regulates model yields. In contrast sorghum shows an
Subproject A3 IMPETUS 143underestimation of BIOM but good conformity with YLD. The main problem is yam for bothBIOM and YLD. Here the adaptation in EPIC needs much more changes for a better reproductionof yam growth such as LAI development, influence of plant density, PHU and HI amongothers.Assessing the suitability of EPIC under the environmental conditions in Benin for IMPETUSscenarios a general sensitivity analysis was conducted. Under assumption that model output isfollowing changes in environmental factors three different changes were simulated: increase insoil fertility by fertilizer applications and decrease of soil fertility by degraded soil profiles. Tovalidate the effects of fertilizer application the measured data of field experiments 2005 can beused. The N-P-K fertilizers of the trials were new parameterized in the accordant EPIC file.Yield SM kg/ha90008000700060005000400030002000100001:1 lineYLD maizeBIOM maizeYLD sorghumBIOM SorghumYLD yamsBIOM yams0 1000 2000 3000 4000 5000 6000 7000 8000 9000Yield MS kg/haFig. A3-8:Comparison of measured and modelled yields in 2005 for maize T0, sorghum T0 and yam T0For decreased soil fertility a measured degraded soil profile (A2) nearby Djougou was used forsoil input (sand%: 78%, sil%:10.05, C%: 0.36, N% 0.03, pH 5.2, CEC 2.91cmol/kg with toplayerof 10cm).Assessments of sensitivity to precipitation was tested by changing the weather input with measuredclimatic factors of 2004 but all other input have been retained unchanged. Annual amountof rainfall in 2005 has been 1208 mm in Dogué whereas 2004 990mm were measured with anincreased amount in the maize growth sensitive month of September and October (2005: 193mmand 120mm; 2004: 102 mm and 39 mm). Results are shown in Tab. A3.6.Sensitivity of EPIC to the changed environmental factors is demonstrated. Increased soil fertilityis coupled with an increasing of yields from pretty low yield on eroded soil with high number ofN stressed days to a medium position of fields cultivated by farmer’s practice. Best yields arereached with fertilizer application and scarcely number of stressed N days, whereas the limitationof yields with a less of precipitation results from accumulated days of water stress.
144IMPETUS Subproject A3Tab. A3.6:Sensitivity of EPIC to changed environmental factors used for IMPETUS scenariosINPUTSM maizeYLDMS maizeBIOM kg/ha SN SP SW YLD kg/ha BIOMkg/hakg/haFERT M1T1 3300.00 8000.00 3 0 2 3172.01 7846.25M2T1 3500.00 9100.00 2 2 2 3564.79 8914.16M3T1 3100.00 5200.00 5 2 3 2095.64 4842.49SOIL M1T0 2400.00 6800.00 9 4 3 2187.77 6028.21M2T0 1800.00 5100.00 9 7 3 1714.94 4952.15M3T0 1500.00 3100.00 13 7 3 1278.94 2939.36SOIL deg. 1100.00 2400.00 37 9 4PRCP 1300.00 2700.00 3 1 11FERT: on fields M1, M2, M3 with rates of Tab. A3-2; SN: number of stress days of N, SP: number of stressdays of P, SW: number of stress days with waterNutrient status of the most important crops in the HVO by DRIS-Evaluation:In order to assess the nutrient status, field experiments were set up from 2000 to 2003. We alreadyreported about the yield responses to the different fertilizer treatments, indicating nutrientdeficiencies to reduce yields site-specific by a factor of up to four. We further assessed the mostlimiting nutrients per crop according to the critical concentration and DRIS norms acc. toBeaufils and Sumner (Beaufils, 1971 and 1973). Below, we will report about the results formaize and yams. It has to be highlighted, that DRIS norms were for the first time developed foryams (publications in prep.).Using the data of field experiments in 2001 and 2002 DRIS analyses were carried out to assessnutrients in maize to compare mean yield, foliar nutrient and variance of nutrient of low and highyielding groups, using ratios of element contents to establish a series of values that will identifythose elements from the most to the least deficient. It is designed to assess relative nutrient imbalancesor deficiencies in plant tissues.For this study, the population was divided into high and low yielding subpopulations using themean + interval of confidence as criteria for cut-off. The nutrient ratio was calculated for bothhigh and low yielding populations, so that each of the nutrients determined in the tissue appearedin the denomination and again in the numerator in ratio with each of the other element. For eachform of expression, the variance for both of the high and low yielding populations was calculated.A variance ratio for each nutrient ratio is also determined by dividing the variance of thelow yielding population by the variance of the high yielding population. For each pair of nutrients,the form of expression, which gave the highest variance ratio, was selected as the parameterto be used for DRIS-evaluation. The mean of the selected parameters for the high yielding populationbecame the foliar diagnostic norms were then used, along with the standard deviation, tocalculate DRIS indices for diagnostic purposes. These values are shown in Tab. A3.9 for the year2002.The optimum ratio between two nutrients will produce a maximum yield only when both are intheir respective sufficiency ranges, but deficiency was observed during the two years of experi-
Subproject A3 IMPETUS 145ment according to the calculation of DRIS indices. The most limiting nutrients in the first year ofexperiment were P followed by S, K, and Zn, whereas in the second year it was Mn, followed byZn and Mg as most limiting (Fig. A3-9). According to the DRIS indices N and Ca level in 2001and, N, P, K, Ca and S level in 2002 were adequate. Kelling and Schulte (1986) determined anindex for nutrient balance in the plant: 15 to +15 for good, from –15 to –25 for possible deficiencyand lower than –25 is likely to be deficient. So in 2002 there is a deficiency with Zn andMn whereas in 2001 a possible deficiency of P, K, Mg, S and Zn is denoted. The NutritionalBalance Index (NBI) is a measure of balance among fields. It is obtained by adding the values ofDRIS indices irrespective of sign. NBI for 2001 was 183.8 and improved in 2002 to 141.2. Thismeans a decrease of intensity of imbalance among nutrients.N P K Ca Mg S ZnN P K Ca Mg S Zn MnNutrient indices806040200-20-40806040200-20-40DRIS Indices 2001 DRIS Indices 2002Fig. A3-9:DRIS indices for maize in farming system in Upper Ouémé Catchment of BeninIn summary, mean yield and foliar nutrient concentrations are different between the low- andhigh-yielding groups as well as the variances of nutrient ratios. From all nutrients selected asDRIS norms 2 out of 21 in the first year and 5 out of 28 in the second year show statistically significantdifferences between mean values in the low- and high- yielding groups. The differentnutritional balances between the low- and high-yielding groups provide some evidence that theDRIS norms developed in this study are reasonable.YamNitrogen, followed by K, P, and Mg were identified as the most limiting nutrients in 2001whereas S followed by N was identified as most limiting in 2002 (Fig. A3-10). This means thatalthough yam is usually the first crop after fallow, organic and mineral fertilizer applied in thefirst year seemed inadequate to cover the supply with these elements. Nutrient imbalances observedin 2001 were less pronounced compared to 2002, where yam was planted as a secondcrop. Thus, a significant contribution of fallow was to be seen with the DRIS evaluation, too. Inthe second year, P and K were close to the critical level, which indicates a need for further optimizationof mineral and organic fertilizer application rates. Manganese, which was not evaluatedin 2001, seemed to be excessive.
146IMPETUS Subproject A3In the absence of locally calibrated DRIS norms, norms developed under one set of conditionsonly should be applied to another if the nutrient concentrations of high-yielding plants fromthese different set of conditions are similar. Sulphur was identified as deficient as well by thecritical value approach (not shown) according to the data provided by Kelling and Schulte(1986). All other nutrients were adequately balanced.60N P K Ca Mg S Zn60N P K Ca Mg S Zn MnNutrient indices40200-20-4040200-20-40DRIS nutrient indices 2001 DRIS nutrient indices 2002Fig. A3-10: DRIS indices for yam in farming system in Upper Ouémé catchment of BeninConclusionDRIS norms established for the first time for yam showed to be useful to evaluate the crop nutritionalstatus. They should be used together with the critical value approach as a basis for calibratingthe fertilization program in Western Africa.Current workTo get regional estimates of crop production either scaling the model results of site-specificsimulations to regional units or scaling the data input from point measurements to regional modelsare possibilities. EPIC was used already for both approaches and reached acceptable results.While Tan (2004) integrated EPIC in a GIS for estimating global warming to global crop productivity,Izaurralde (2003) used the former approach for assessments in the conterminous UnitedStates. For up scaling the site-specific model results in Dogué to regional level of the UpperOuémé Catchment multiple EPIC runs will be conducted using the different soil unites from thesoil map of Benin (A2). Assignment of crops to suitable soil units will be done by using the FAOmaps of the agro-pedological Project (1:500 000) explaining soil suitability for different crops inBenin (FAO, 1980).In April 2006 new field experiments with rice cultivation in a Basfonds near by Dogué were conducted.To estimate the potential productivity of Basfonds and to predict the contribution of riceto a future food supply the experiments as were installed with two optimized management strategies:fertilizer application and water control by dykes. As one of the main focuses in the 3rdphase of IMPETUS is capacity building the field experiments are part of a DSS done by a Beninesestudent. Field results will be used for further modelling.
Subproject A3 IMPETUS 147LiteratureAdjeduwon, D. (2004): Assessing the Suitability of the EPIC Crop Model for Use in the Study of Impacts of Climate Variabilityand Climate Change in Wes Africa. AIACC Working Paper No.5Bassett, T. J., Bi, Z. K. & Ouattara, T. 2003. Fire in the savanna: environmental change & land reform in northern Côte d'Ivoire.In: Bassett, T. J. & Crummey, D. (eds.) African savannas: global narratives and local knowledge of environmentalchange, pp. 53-71. Currey, Oxford.Beaufils, E. R. (1971): Physiological diagnosis-A guide for improving maize production based on principles developed for rubbertrees. Fert. Soc. S. Afr. J. 1, 1-30.Beaufils, E. R. (1973): Diagnosis and Recommendation Integrated System (DRIS). Soil Sci. Bull. 1. University of Natal. SouthAfrica.Budde, M. E., Tappan, G., Rowland, J., Lewis, J. & L. L. Tieszen (2004): Assessing land cover performance in Senegal, WestAfrica using 1-km integrated NDVI and local variance analysis. In: Journal of Arid Environments 59 (3): 481-498.Cabelguenne, M. (1990): Calibration and Validation of EPIC for Crop Rotations in Southern France. Agricultural Systems 33,153-171.Cassel-Gintz, M. A, Lüdeke, M. K. B., Petschel-Held, G., Reusswig, F., Pöchl, M., Lammel, G.. & H. J. Schellnhuber (1997):Fuzzy logic based global assessment of marginality of agricultural land use. In: Climate Research. Interactions of Climatewith Organism, Ecosystems, and Human Societies 8 (2):135-150.FAO/IIASA (2004): Internim Report IR-00-064: Global Agro-Ecological Zones Assessment- Methodology and results.FAO (2001): Global forest resources assessment. FAO, Rom.FAO (1980): Project Agro – Pedologie: Carte d´aptitude des sols pour la culture du sorgho / yam/ cassava / maize. 1 : 500 000GLP (2005),'Science plan and implementation strategy', IGBP Report No. 53 / IHDP Report No. 19 , in Dennis Ojima; EmilioMoran; William McConnell; Mark Stafford Smith; Gregor Laumann; João Morais & Bill Young, ed.,.INRAB (1998): Fiche Technique: cultures vivrieres cereales, legumineuses a graines et tubercules.Izaurralde, R.C., Rosenberg, N.J., Thomson, A.M. (2003): Integrated assessment of Hadley Centre Climate Change Impacts onAgriculture Productivity and Irrigation Water Supply in the Conterminous United States. Part II. Regional AgriculturalProduction in 2030 and 2095. Agric. For. Meteorology 117; 97 – 122.Judex, M. (2003):Analyse und Erklärung der Landbedeckungs- und Landnut<strong>zu</strong>ngsänderungen im Upper Oueme Catchment(Benin, Westafrika) durch die Verknüpfung von LANDSAT-Daten mit sozioökonomischen Daten, Master's thesis, Universityof Bonn.Judex, M.; Thamm, H. & Menz, G. (2006): Modelling of land-use changes in a west african catchment, in N. Kerle & A.K.Skidmore, ed.,'ISPRS Mid-term symposium 2006 Proceedings: From pixels to processes'.Kelling, K. A. and Shulte, E. E. (1986). Review DRIS as a part of a routine p lant analysis program. J. Fert. Issues 3(3), 107-112.Leemans, R. & G. J. Van den Born (1994): Determining the potential distribution of vegetation crops and agriculture productivity.In: Water, Air & Soil pollution. An international journal of environmental pollution 76: 133-161.Leveque, A. (1978): Ressources en sols du Togo: Carte à 1/200 000 des unités agronomiques déduites de la carte pédologique.Socle granito-gneissique limité à l’ouest et au nord par les Monts Togo. In: ORSTOM (Ed.): Notice Explicative73.ORSTOM. Paris. 26 pp.Li, J., Lewis, J., Rowland, J., Tappan, G. & L. L. Tieszen (2004): Evaluation of land performance in Senegal using multitemporalNDVI and rainfall series. In: Journal of Arid Environments 59 (3): 463-480.Orekan, V.; Sinsin, B.; Thamm, H. & Menz, G. (2006) : Effets spatiaux de la migration sur l'occupation du sol dans le bassin del'Ouémé Supérieur au Bénin, in 'Gestion concertée des ressouces naturelles et de l'environnement'.Orthmann, B, 2005. Vegetation ecology of a woodland-savanna mosaic in central Benin (West Africa): Ecosystem analysis witha focus on the impact of selective logging. Dissertation Institut für Biowissenschaften, Universität Rostock, 137 ppSteinke, I. & Hennenberg, K.J. 2006. On the power of plotless density estimators (PDE) for statistical comparisons. CanadianJournal of Botany, 84: 3 pp. 421-432.Thamm, H.; Judex, M. & Menz, G. (2005): 'Modeling of Land-Use and Land-Cover Change (LUCC) in Western Africa usingRemote Sensing', Photogrammetrie Fernerkundung Geoinformation 3/2005, 191--199.Verburg, P.; Soepber, W.; Veldkamp, A.; Limpiada, R.; Espaldon, V. & Mastura, S. (2002), 'Modeling the spatial dynamics ofregional land use: the CLUE-S model', Environmental Management 30(3), 391--405.Pontius, R.G. & Schneider, L. (2001), 'Land-cover change model validation by an ROC method for the Ipswich watershed, Massachusetts,USA', Agriculture, Ecosystems and Environment 85, 239--248.Schmitz, M. (2005): Entwicklung einer generischen Plattform <strong>zu</strong>r implementierung von Simulationsmodellen am Beispiel derLandnut<strong>zu</strong>ngsmodellierung, Diplomathesis, University of Bonn.Tan, G., Shibasaki, R. (2003): Global estimation of crop productivity and the impacts of global warming by GIS and EPIC integration.Ecological Modelling 168; 357-370.Thamm, H.-P.; Schütz, O., Christoph, M (Publishers) 2005: IMPETUS Atlas - Benin - Research Results. Bonn, PublishingHouse: University of Bonn, REMOTE SENSING RESEARCH GROUP, ISBN 3-9810311-2-1.Thamm, H.-P. & M. Judex (2006): The “low cost drone” – an interesting tool for process monitoring in a high spatial resolution.ISPRS TC7 Mid Term Symposium “From Pixel to Processes”, ITC, 08.05.-11.05.2006, EnschedeThamm, H.-P. & M. Judex (2005): Einsatz einer kleinen Drohne für hoch aufgelöste Fernerkundung, in Strobel, J., Blaschke, T.& Griesebner (Hrsg.) Angewandte Geoinformatik 2005, SalzburgWotto, J., 2003. Pratique de l'Elevage des Bovins au Benin: son Intégration dans la Gestion des Ecosystèmes du Terroir de Doguè.Mémoire de Maîtrise (inédit) au Faculté des Sciences Agronomiques, Université d'Abomey-Calavi, 80 pp.Zobler, L. (1986): A world soil file for global climate modelling. NASA Technical Memorandum 87802. Goddard Institute forSpace Studies. New York. 32 pp.
Subproject A4 IMPETUS 149Teilprojekt A4Sozioökonomische Entwicklung im Hinblick auf die Verfügbarkeit derRessourcen – Agrarsektormodellierung und WasserbedarfsanalyseSocio-economic development against the background of resourceavailability – agricultural sector modelling and water demand analysisAntragsteller / ParticipantsProf. Dr. W. Schug (Koordinator)Institut für Agrarpolitik, Marktforschung und Wirtschaftssoziologie,Universität BonnProf. Dr. Th. HeckeleiInstitut für Agrarpolitik, Marktforschung und Wirtschaftssoziologie,Universität BonnProf. Dr. M. JanssensInstitut für Obstanbau und Gemüseanbau, Abt. TropischerPflanzenbau, Universität BonnFach / DisciplineVersorgungslage mit WasserSupply situation of waterPolitikinformationssysteme, ÖkonometriePolicy information systems, EconometricsBodennut<strong>zu</strong>ngssystemeGround use systemsZusammenfassungDas Teilprojekt A4 beschäftigt sich mit agronomischen und ökonomischen Aspekten der menschlichenWassernachfrage, unterteilt in die Bereiche Landwirtschaft und Trinkwasserversorgung.Das Teilprojekt besteht aus drei Workpackages: a) Wasserversorgung und Wassernut<strong>zu</strong>ng(Workpackage A4-1), b) Farmsysteme und ihre Wasseransprüche (Workpackage A4-2), und c)agrarökonomische Modellierung der Landnut<strong>zu</strong>ng mit besonderer Berücksichtigung von Wasserressourcen(Workpackage A4-3). Wasserversorgung und -nut<strong>zu</strong>ng (A4-1) arbeitet eng mit denTeilprojekten Hydrologie (A2) sowie Demographie/Ethnologie/Medizin (A5) <strong>zu</strong>sammen. Farmsysteme(A4-2) behandelt explizit die interdependenten Prozesse zwischen Farmsystemen, Landbedeckungund Vegetationsforschung und pflegt daher eine enge Zusammenarbeit mit TeilprojektA3, aber auch mit dem Bereich Regionalklima (A1). Die Agrarsektormodellierung (A4-3)schließlich ermöglicht den Austausch mit Pflanzenertrags- und Landnut<strong>zu</strong>ngsmodellen (A3) sowieDemographie (A5).Die Forschungsaktivitäten in den einzelnen Workpackages bestanden <strong>zu</strong>m einen in umfangreichenDatenerhebungen. Im Bereich „Wasserverfügbarkeit und –verbrauch“ konnte die Primärdatenerhebungabgeschlossen werden. Neben einem repräsentativen „Survey“ auf Haushaltsebenein 8 verschiedenen Städten führten weitere Erhebungen im landwirtschaftlichen und industriellenSektor <strong>zu</strong> einem vollständigen Abbild der gegenwärtigen und für Szenarien relevanten<strong>zu</strong>künftigen Situationen. Im Bereich „Farmsysteme“ wurden <strong>zu</strong>m einen Daten <strong>zu</strong> Anbausystemen,Produktionskalendern und Fruchtfolgen gesammelt. Des Weiteren wurden Biomasse undÖkovolumenmessungen typischer natürlicher und agrarischer Vegetationsgesellschaften im Un-
150IMPETUS Subproject A4tersuchungsgebiet erhoben. Zur Parametrisierung des Agrarsektormodells BenIMPACT wurdenauf der Ebene der regionalen Beratungsstellen Daten <strong>zu</strong> Produktionskosten erhoben und in dasModell implementiert. Ein „Survey“ unter Landwirten <strong>zu</strong>r Erfassung der dynamischen Aspektedes Wanderfeldbaues wurde gleichfalls durchgeführt und befindet sich noch in der Auswertung.Unter Tierhaltern und Tierhaltungsexperten wurde ebenfalls eine Befragung <strong>zu</strong> ProduktionsundVermarktungskosten sowie der Wasserversorgung der Tiere durchgeführt.Ein weiterer Aktivitätsschwerpunkt bestand in der Analyse der erhobenen Daten durch statistischeProgramme wie SPSS im Bereich Wassernachfrage. Die erhobenen Daten <strong>zu</strong>m Ökovolumenbefinden sich noch in der Auswertung. Unter Verwendung von agronomischen wie auch agrarökonomischenModellen wurden Szenarien <strong>zu</strong>r Landnut<strong>zu</strong>ng bis 2025 simuliert. Die Programmierungund weitere Entwicklung des Modells BenIMPACT stellte einen wichtigen Aktivitätsschwerpunktim Workpackage A4-3 in der zweiten Projektphase dar. Bisherige Ergebnisse derSzenariosimulationen deuten an, dass die Ausdehnung der Landnut<strong>zu</strong>ng durch Degradationsprozessedes Bodens bei knapper werdenden Landreserven eher gebremst wird, solange eine hinreichendeIntegration der landwirtschaftlichen Haushalte in lokale Arbeitsmärkte gegeben ist.SummarySub-project A4 deals with agronomic and economic aspects of water demand from agricultureand for drinking water. The sub-project consists of three workpackages: a) water provision anduse (workpackage A4-1), b) farming systems and their water needs (workpackage A4-2), and c)agro-economic modelling of land use with particular focus on water resources (workpackageA4-3). Water provision and use (A4-1) closely cooperates with sub-project hydrology (A2) anddemography/cultural anthropology/medicine (A5). Farming systems (A4-2) explicitly addressesthe interdependent processes between farming systems, land cover and vegetation research, andtherefore keeps up close ties with sub-project A3, but also with regional climate modelling (A1).Agricultural sector modelling (A4-3) interchanges results with crop growth and land use models(A3) as well as demographic models (A5).Comprehensive survey work was one of the major research activities in the individual workpackages.In the area of ‚water provision and use’, the data collection could be finished in thesecond phase. A representative household survey in 8 different cities, a rural survey coveringalso agricultural water use, and a survey dealing with industrial water use enable a comprehensivepicture of water use in Benin, which serves as a basis for future projections. In the area of‚farming systems’, data concerning cropping systems, production calendars and crop rotationswere collected. Moreover, the biomass and eco-volume of typical natural and agrarian vegetationtypes in the research area were measured. In order to refine the supply part of the agriculturalsector model BenIMPACT, data on production costs in farming were obtained from regionaladvisory services. A survey among farmers was conducted to gain insights into the dynamicaspects of shifting cultivation, the results of which are currently being processed. Finally,farmers and herders were surveyed to obtain production and marketing costs in livestock husbandryand figure out the role of animals in the local water economy.The processing and analysis of obtained data with statistical packages such as SPSS was anotherimportant activity in the second phase of IMPETUS. By using agronomic and agoeconomicmodels, land use scenarios up to the year 2025 were simulated. The programming and
Subproject A4 IMPETUS 151further development of the model BenIMPACT was another demanding activity in workpackageA4-3. Results of scenario simulations indicate that the expansion of agricultural land will becurbed by the combination of degradation processes and the possibility of farmers to leave thefarm sector. Thus, the integration of village economies into regional labour markets is a crucialfactor influencing decisions on the use of scarce land and water resources.Workpackage A4-1: Water provision and demandProblem statement and research objectivesIn order to achieve the Millennium Development Goals, the proportion of people without sustainableaccess to safe drinking water has to be reduced by half until 2015 (Van de Sand, 2005).In developing countries, the supply of drinking water plays a central role for development. InBenin, the status of research activities proved that water shortage is less a problem of wateravailability than a problem of access to water depending on seasonality as well as financial andtechnical problems (Behle and Schopp, 2003). So far, comprehensive studies concerning waterconsumption per capita have not been carried out on a broad regional basis and different kinds ofwater supply, which is why national strategies are often based on weak facts about the water sector.In this context the aim of workpackage A4-1 in the second period of the project was to assess thewater availability and the implementation of the new national strategy, as well as to investigatethe water demand in the economic sectors (household, agriculture and industry). All these resultsare considered in development strategies under dynamic socio-demographic and socio-economicaspects. Furthermore, a concept for supply management has to be developed to allow for a moreefficient water usage and a coordination of water policy decisions.Research activities in the second phaseThe first field survey on the development and management of drinking water supply was focussedon group discussions with target groups (women) in three different villages in the predefinedcatchment area. Another survey dealt with governmental and non-governmental organisations inthe water sector on various administrative levels in order to establish to what extent the nationalstrategy is accepted by the population and to determine whether the national strategy addressesthe present problems of drinking water supply. Group discussions based on these results wereorganised in 34 villages with a focus on assessing water problems at the household level. Finally,interviews with women were carried out in two different villages in order to find out more aboutmanagement structures and organisation of water supply.As to water demand, three sectors ought to be taken into consideration, namely the household,agricultural and industrial level (UNESCO, 2003). An interdisciplinary survey was carried out indifferent villages and one city to find out the water consumption per day and capita at the householdlevel. Water use categories were identified and classified in 40 households during a researchperiod of six months (Hadjer et al., 2005). This study aims at analysing the influence of socioeconomicparameters (e.g. affluence vs poverty) on water consumption in rural areas when dejureconditions of access to water sources are equal. The study found out a small variability of
152IMPETUS Subproject A4water consumption in rural areas, contrasted by a high variability in urban areas (with tap water).In order to look deeper into the issue of unequal access to water in urban areas, a representativesurvey was conducted in round about 1200 households in eight different cities (Bassila, Djougou,Parakou, Tchaurou, Savé, Glazoué, Klouékanmé and Sô-Ava) across Benin. The aim of thisstudy was to figure out water consumption quantities in urban areas with access to tap water, toanalyse the choice of different water sources, and the influence of socio-economic aspects. Tounderstand water consumption in the agricultural sector, a division between water used for irrigationpurposes and water used for livestock is necessary. The irrigation structure consists ofthree different levels: irrigation with watering cans mainly for vegetables cultivations near bigcities, inland valleys (“bas fonds”) and the large scale irrigation systems for the production ofrice, sugar cane and palm oil. Concerning the first level, a questionnaire distributed to more than100 farmers was realised in Porto Novo, Cotonou, Ouidah and Grand Popo, which are all locatedin the south of Benin. The questionnaire focuses on basic data about irrigated plants, limitingfactors, technical equipment, ownership structures and future trends. In addition to this, a quantitativeanalysis of irrigation water withdrawal took place in all large-scale irrigation systemswhich are located in Pobé, Savé, Malanville, Koussin-Lélé and Dévé. The part relating to theinland valleys (“bas fonds”) will be completed with the help of another research group (problemcluster PK Be-H.1). In addition to these analyses conducted by various methods of empiricalsocial research, the industrial sector has to be taken into account beside the household and agriculturalsector. To determine the water consumption in several ways of production, a sample wascreated with different kinds of sources (official data, books or handwritten notices). With thehelp of experts, all industrial activities were divided into three groups (full water dependence,partial water dependence, water independence). In the first and second group a complete inventorycount with a standardised questionnaire concerning seasonal dependence and different watersources was carried out at a national level.All these findings from different sectors (household, agriculture, industry) result in the waterbalance of the demand side. With the help of experts, the development until 2025 in considerationof three scenarios could be estimated, as well as an evaluation of the results. These resultsare necessary for the interdisciplinary work under changing conditions.Results of researchThe demand for water is quite high according to the following results stemming from the empiricalsocial research. Concerning the implementation of the new national supply strategy, the ruraldrinking water situation in Benin is still problematic. “This is reflected by high failure rates offunctional water supply facilities, and accordingly, by low proportional cover rates and by highexpenditure of time for the drinking water provision.” (Behle, 2006). Until now, the principles ofthe new national supply strategy could not be fulfilled in their entirety. Most rural municipalitiesdescribed the requirements for financial own-contribution as insurmountable problem when applyingfor new drinking water facilities. Moreover, repair and maintenance caused a lot of problemsfor the user municipalities (Behle, 2006).According to World Water Council (WWC, 2003), the average daily water consumptionamounts to 20 litres per capita and day on average. But an interdisciplinary micro-study in col-
Subproject A4 IMPETUS 153laboration with anthropologists in IMPETUS found out that in the same cases the water consumptionper capita was 18.7 litres. Fig. A4-1 illustrates the inter-seasonal differences of households’water consumption in both rural and urban areas.rural urban moving average (rural) moving average (urban)liter302520151050Aug Sep Oct Nov Dec Janrural 21,3 19,9 18,9 17,3 16,1 17,4urban 28 24,9 23,2 21,7 14,7 14,6monthFig. A4-1:Seasonal water consumption in rural and urban areas (n=40), Source: Hadjer et al. 2005, modifiedThe water consumption in urban areas is quite variable regarding their range (between minimumand maximum). De facto, access to piped water is often regarded as a prestige object. Even whenthe household is connected to tap water, the household members use other water sources likewater from wells. Concerning socio-economic data, the micro study established that in rural areasthe water consumption is more influenced by access to water than by economic wealth (richnessor poverty). The conditions of access to water for the rural population are nearly equalwhether people are rich or poor. Thereby the study also revealed that the variability of waterconsumption in the city is much higher than in the villages.SONEB (“Société Nationale de l’Eau du Bénin”, a government agency) is responsible for theurban water supply system. Until now, water supply networks have been installed in 69 towns. Inseveral towns the demand for taps was not high enough in economic terms; there water is providedby the DGH (“Direction de l’Hydraulique”).
154IMPETUS Subproject A4Tap waterTap water salePrivate wellRainwaterPublic wellPublic pipeWaterholeOthersLegend&CityStreetsRiversParakouRainy seasonDry seasonDjougouRainy seasonDry season&DjougouTchaourouRainy seasonDry seasonBassila&Rainy seasonDry seasonBassila&Parakou&TchaourouSavéRainy seasonDry seasonGlazouéRainy seasonDry season&Glazoué&SavéSô-AvaRainy seasonDry seasonKlouékanmé&KlouékanméRainy seasonDry seasonSô-Ava &±150 30 60 90 120KilometersFig. A4-2: Water sources used in the investigation areas, Source: Adams et al 2005When comparing all water sources (in absolute values), tap water was the most important sourcein the investigation areas, followed by rainwater and water from wells (Fig. A4-2). As waterholeswere frequently used in the rural areas, this urban survey shows that waterholes were usedduring the dry season in case of extreme water shortage, like in Sô-Ava for example. If we considerthe 8 focus towns, tap water becomes more and more important for the population in thefuture (Fig. A4-3).Number2500002000001500001000005000001985 1990 1995 2000 2005 2010 2015 2020 2025Connections to tap waterLinear trend of connections to tap waterFig. A4-3: Connections to tap water in the eight “focus towns”, Source: Adams et al. 2005
Subproject A4 IMPETUS 155As for water consumption at the industrial level, a survey with a questionnaire was carried out in173 companies. This survey shows to what extend the different industrial branches rely on watersources (tap water, water from wells, rainwater, etc.). Tap water provided by the governmentalorganization (SONEB) is mainly used for all activities (like production or toilette) in nearly allproduction industries. The beverage and food industry and hotels use high quantities of water. Toensure a continuous water supply, the companies often constructed their own water reservoir orthey are informed beforehand in case of water interferences if they are good customers. Especiallyin small companies without water reservoir the water need was not satisfied in periods ofwater stoppage. Mainly in this group, water is a limiting factor for development of the companiesbecause they are not able to continue their production.According to the part relating to the method, the water consumption in the agricultural sectorwas calculated at different levels. A survey concerning the water usage classified into “motorpump irrigation” and “watering can irrigation” was carried out in 4 different cities in the southBenin. The main water source concerning motor pump irrigation is groundwater from boreholes(72%), from wells (13%) and from swamplands (15%). Compared to watering can irrigation thewater sources are quite different (72% from swamplands, 20% from wells, 6% from waterholesand only 2% from boreholes). The results of the category “motor pump irrigation” are shown asan example in the following Fig. A4-4. The variability of water withdrawal is much higher in thedry season than in the rainy season. This is related to an abundant water supply in the investigationareas, where the groundwater level is only a few meters under the earth, which involves awasteful water exposure.2500,002000,00241500,0019m³/ha1000,00500,000,00Dry season 1 Rainy 2seasonFig. A4-4:Variability of irrigation water withdrawal with motor pumps
156IMPETUS Subproject A4These results at different levels identified mainly the same causes: an inadequate water managementat the governmental level and at the private level (private initiative), as well as insufficienttechnical and financial means.Tonuhewa (2006) describes the situation as follows:„Nous sommes un pays en développement parce que nous n’avons pas compris que nous devonsnous mettre à travailler pour nous développer. Qu’est-ce qu’on fait maintenant? On demande del’argent à nos partenaires. Le résultat est comme ça“.Workpackage A4-2: Farming Systems in the Ouémé BasinProblem statement and research objectivesLand use is becoming a force of global importance. In Benin, enormous changes to forests, farmlands,waterways, and air are being driven by the need to provide food, fiber, water, and shelterto rapidly growing population. Croplands, pastures, plantations, and urban areas have stronglyexpanded in the past 20 years, accompanied by large increases in energy, water, and fertilizerconsumption. Over-use of soils, however, potentially undermines the capacity of ecosystems tosustain food production, maintain freshwater and forest resources, regulate climate and air quality,and maintenance of soil fertility. The ecosystem’s response to land use vary according to thetype of land-use change and the ecological setting, and have local, short-term as well as global,long-term effects. Balancing the inherent trade-offs between immediate human needs and maintainingthe capacity of other ecosystem functions requires comprehensive knowledge about theseecosystem functions on the regional scale.In this work-package, we address interdependent processes between farming systems, land coverand vegetation research (A3), microclimate (A1), and agricultural economics (A4-3) in thewhole Ouémé basin. It is hypothesized that micro-climate, especially the eco-precipitation, isinfluenced by eco-volume dynamics. To test the hypotheses new theoretical concepts were developedand new integrative indicators are being improved. The notion of agro-climax is proposedas an alternative to that of eco-climax. The indicator ‘eco-volume’ is introduced as an additionaldimension (the three-dimensional space) in order to complement existing indicatorscharacterising vegetation types and farming systems such as biomass, land cover, or leaf area.The eco-volume contributes to supplementary precipitations of ecological origin. Finally, ecovolumeis an interconnecting parameter helping validating more complex hydrological models.This refocusing and rethinking was also illustrated in the problem cluster PK Be-L.4 “Ecovolumedynamics and adaptation of farming systems to climate change in the Ouémé Basin”, inthe 6 th research report of IMPETUS.The dynamic interplay between micro-climate and vegetation cover is central to this researchphase. Vegetation cover (more precisely: ‘eco-volume’) is rapidly declining in Benin. As a consequence,precipitations originating from local vegetation have declined by -53% in 2000 alreadyand are likely to further decrease by -80% in 2020 compared to earlier long-term averages(Janssens, Deng & Mulindabigwi, 2004). The agro-ecological constraints in the whole Ouémébasin were further investigated, allowing agro-ecological evolution to be predicted on a regional
Subproject A4 IMPETUS 157scale, which, in turn and combined with the results of the other subprojects, would enable a realisticpolicy analysis.Research activities in the second phase of IMPETUSHaving finished field work in the Upper-Ouémé basin, the agro-ecological data collection is finishingnow in the Lower-Ouémé, where a bimodal rainfall regime dominates, different from theUpper-Ouémé basin with a unimodal rainfall regime. The field work was extended also intoMiddle-Ouémé until the end of the 2nd project phase. By then, this research approach will havecovered the whole of the Ouémé basin. This will allow a comprehensive understanding of theinterplay between the micro-climate and vegetation dynamics. In Upper-, Middle- and Lower-Ouémé basins, vegetation was classified into 4 categories, namely forest, savanna-fallow, plantations,and annual crops.In 3 parts of the whole Ouémé basin, for each of above 4 categories, the following parametersand data were measured:• Basal area, height, planting density, litter-fall, specific leaf area, soil-litter, biomass;• Soil respiration, soil chemical and physical indicators;• Constraints and problems of production from the point of view of the local farmers;• Yields of the principal annual crops, cropping calendars, crop rotation and farm managementschemesFurthermore, local decision-makers in selected communes, the MAEP, and agricultural scientistswere interviewed. The local people show wide interest in co-operative and participative work inthe research areas of ‘eco-volume dynamics’ and ‘adaptation of farming systems to climatechange’.Results of research activitiesFarming systems in the Upper Ouémé basin in BeninIn this part, the farming systems were described and their impact on the land use, food securityand carbon sequestration was evaluated. The farming systems are dominated by shifting cultivation.The crops are sown or planted in pure or associations between May and July. The agriculturalintensification is limited to the cotton production system. Only with increasing scarcity ofarable land, farmers start intensifying their maize production systems. Rapid population growthand the decline of soil fertility constitute the principal factors of deforestation (2-3% per annum)in the upper Ouémé basin.The natural vegetation cover appears to work most effectively as a sink for carbon (“forêt densesemi-décidue”: 138,5 t ha -1 ; “forêt Claire”: 71,7 t ha -1 against 33,8 to 35,3 t ha -1 for the agriculturalsurfaces). Contrary to former studies (Nye & Greenland, 1960; Robert, 2001), carbon storedin the first 20 cm of soil on cultivated areas does not differ significantly from that of soils undernatural vegetation or fallow (Tab. A4.1). This may be explained as the consequence of regularbush fires. Thus, the differences in the potential for carbon sequestration stem from differencesin the aboveground biomass between natural and cultivated vegetation.
158IMPETUS Subproject A4Tab. A4.1:EcosystemsCarbon sequestration in different ecosystems in upper Ouémé basinAbovegroundwoodbiomassRatioBs/BaUntergroundwoodbiomassBiomass ofherbsBiomass offood cropsSoillitterSoil(20 cm)Totalcarbon(t ha -1 ) (t ha -1 ) (t ha -1 ) (t ha -1 ) (t ha -1 ) (t ha -1 ) (t ha -1 )DoguèCrops 3,4 0,25 0,9 1,6 4,1 0,1 25,1 35,3Fallow 14,8 0,25 3,7 2,1 0,0 0,6 21,6 42,7Cashew 12,3 0,27 3,3 1,7 0,0 1,7 25,5 44,5"Forêt claire" 40,9 0,20 8,2 0,4 0,0 0,5 21,7 71,7SérouCrops 2,8 0,25 0,7 1,3 3,2 0,1 25,7 33,8Fallow 3,7 0,25 0,9 2,6 0,0 0,4 24,9 32,6Cashew 9,0 0,27 2,4 1,2 0,0 2,3 24,8 39,9"Forêt d.s. décidue" 82,2 0,13 10,7 0,1 0,0 2,6 43,0 138,5Bs: unterground wood biomass; Ba: aboveground wood biomassThe evolution of the agricultural areas and the associated degradation of natural resources can besubdivided in five principal phases: (i) Ecological Equilibrium; (ii) collapse of ecological equilibrium;(iii) ecological degradation; (iv) structural food insecurity; (v) immiserisation and irreversiblehydrological degradation. The land use around the road Wari Maro – Doguè representsphase 2: collapse of ecological equilibrium, while the land use in Sérou is in phase 3 of the ecologicaldegradation. Until 2020, when climate scenarios predict shorter rainy seasons, the agriculturalarea will expand to 79.7% of the total arable area and will provide 116% (against 132%in 2000) of the needed calories. On the other hand, a demographic growth reduction from 4.9%to 3.0% and partial intensification of agriculture will allow for the production of 147% of requiredcalories in 2020 by using only 62% of the arable area. In the case of the actual land usesystems, the eco-volume will decline from 115386 to 49682 m³ ha -1 .115386(- 57 %)120000Ecovolume (m³ ha -1 )100000800006000040000200004986202000 2020Closed forest Trees savanna Fallow + savanna Cashew Arable landFig. A4-5:Prediction of eco-volume in upper Ouémé basin (status quo scenario)The agricultural intensification depends on the adoption of more productive technologies. Thesetechnologies were already developed by various national and regional agricultural research institutionsbut are not available to farmers. However, the agricultural intensification is not the only
Subproject A4 IMPETUS 159strategy to guarantee a durable use of the natural resources. It rather forms part of integratedstrategies for rural development which have to be objectively further defined and concretized.Eco-volume dynamics and adaptation of farming systems to climate changeThe data-set collected in this work-package, combined with other data-sets from A1, A3, A4,A5, allows a pathway analysis of relationships between different driving forces and eco-volume.A preliminary image of pathways is shown in Fig. A4-6.Fig. A4-6:Pathway analysis of eco-volume in the Ouémé watershed basin: a regionalapproach based on the Commune levelThe most relevant factors identified through pathway analysis will then be used to construct amultiple regression as exemplified in Fig. A4-7.Fig. A4-7:Results of a preliminary regression analysis as an example
160IMPETUS Subproject A4The most recent research results on eco-volume are (Janssens, Deng & Mulindabigwi, 2004):• Eco-precipitations are assumed to be reduced by -53% in 2000 and would reduce bysomewhat -80% in 2020 following a concomitant decline in eco-volume;• Vegetations formations colonise space more than they compete for biomass weight;• Agro-climax and eco-climax are important indicators;• Litter fall is a pivot for biomass parameterisation;• Eco-volume would improve multidisciplinary models and/or scenarios;• Although bio-surface is difficult to estimate, it may help improving universal scalinglaws in biology.Quantifying mango production in Upper-OuéméMango production offers an excellent chance to commercialise farm production in Benin, whilethe Mango trees have beneficial effects regarding biomass and soil cover, and thus on the regionalclimate and water cycle. The on-off fruiting phenomenon (meaning that harvests may berealised only once in two years) was identified as the major barrier of mango production in NorthBenin. Improper biomass partitioning was adopted as the simplest hypothesis to explain thisphenomenon. Consequently, pruning was predicted to be the most practical and efficient techniqueto overcome the ‘alternate fruit bearing’ problem. Knowledge about mango fruit productionand post-harvest treatment can be relatively easily transferred to the farmers without requiringlarger investments. A training course on mango tree pruning (Deng and Janssens, 2004)proved to be a successful test on capacity building by IMPETUS.100%90%80%70%Percentage60%50%40%30%20%10%No YieldYield0%Fig. A4-8:Total Eldon Kent Gouverneur Ordinaire OthersVarietyFruit loading difference between individual mango trees of different varieties in Upper-Ouémé, North BeninDuring field research from September 2003 to May 2004, the on-off fruiting phenomenon ofmango production was identified in N’Dali and Sérarou of North Benin, where an obvious dryseason dominates the region from October to April. Only 49% of the trees were bearing fruit atthat time (Fig. A4-8). Fig. A4-9 shows different yield levels of different mango plantations and
Subproject A4 IMPETUS 161varieties in N’Dali and Sérarou. Considering the yield differences in Fig. A4-9, one can recognisea huge technological potential to improve mango production in North Benin.Under the West African sub-humid (i.e. very positive) growing conditions, pruning was predictedas one of the most effective and feasible techniques. Indeed, pruning could double thecurrent average fruit yield of 3.2 t/ha to ca. 7 t/ha. And more importantly, it could stabilise thefruit yield between the different years, which is a prerequisite to supply surplus production to thelocal and international markets. Market mechanisms need predictable production information forprice formation, which in turn facilitates market transactions and enables an efficient resourceallocation (Alchian and Demsetz, 1972). Otherwise, high transaction costs from uncertaintycaused by periodic production failures will continue to cripple Benin’s potential to produceMango.To test the hypotheses, the necessary parameters were measured at a mango orchard in N’Dali(see Tab. A4.2), and a survey was carried out in four mango orchards in Northern Benin. Firstresults are documented here. The harvested and exported products (2.6 t of fruits/ha) amount to1/10 th of the total biomass, which remains within the sustainable potential of these orchards.Tab. A4.2:Primary Parameters of Mango Tree Biomass Productivity of N’Dali-103 (Average Value)Parameter LAI Basal DBH Crown Surface Height Biomass FruitArea cm Diameter, m m² mYieldAverage/tree 1.58 844 cm² 8.45 8.53 57.15 7.18 246.2 kg 26.2 kgOn ha basis** 0.90 8.44 m² - - 5715 - 24.62 t 2.6 t*: GPS-data: Elevation:1262 ft; N: 09°47,446´; E: 002°42,351´.**: Planting density: 10 m X 10 m, which means 100 trees/ha.Loosening other technological, institutional and economic constraints, progress in the mangosector can be reasonably imagined: beyond the orchard management strategy with pruning ascritical technique, assuming that mineral fertilizer would be available through liberalized marketaccess upon governmental intervention, and if modern weeding and plant protection measurescould be used, yield levels could reach ca. 15 t/ha, which is four times the current average yieldlevel. In addition, irrigation – preferably drip irrigation – could further improve yield levels up to30 t/ha.100,00Yield ( t/ha )7,006,005,004,003,002,00Yield per mango tree ( kg/tree )90,0080,0070,0060,0050,0040,0030,0020,001,0010,000,00Ser-01 Ser-02 N'Dali-103 AVERAGEMango Plantations0,00Eldon Kent Ordinaire Gouverneur OthersVarietyFig. A4-9:Difference of yield levels between different mango plantations and varieties in Upper-Ouémé,North Benin
162IMPETUS Subproject A4Workpackage A4-3Problem statement and research objectivesLand use for agricultural purposes represents an increasingly important part of total land use inBenin, and figures as the prime source of food for the population. Climate change and a rapidlygrowing population are accelerating deforestation and plant biomass reduction, which may negativelyimpact on the hydrological cycle. The primary goal of the IMPETUS workpackage A4-3was to assess consequences of climate change as well as population and economic growth oncrop land use within a forecasting period from 2000-2025. Moreover, the consequences of landuse changes for cropping mixes, food supply and consumption were projected by this researchgroup. The following major scientific achievements (‘milestones’) were suggested in the researchproposal for the 2nd phase of IMPETUS:• Finalisation of the agro-economics simulation model• Final version of a model database• Creating links to meteorological, hydrological, and demographical models• Presentation of plausible development paths through scenario simulations• Establish production-related coefficients in animal husbandry such as water requirementsand future fodder availabilityResearch activities in the second phase of IMPETUSField researchIn 2003 a survey of production costs in cropping was carried out. The data were obtained fromagricultural extension offices on the departmental level and consist of detailed labour time requirementsfor different crops and specific seasonal stages, complemented by costs for nonlabourinputs. Moreover, the collection of official data was completed by the end of 2004. In2005, a survey among animal keepers in three representative regions was conducted as well as asurvey among experts for animal husbandry. Finally, a survey on the farm level was carried outin 2006 in order to unveil suspected links between land use and crop productivity in shifting cultivationsystems.Database compilationData from different sources had been collected by the end of 2004, comprising official data fromnational sources and international bodies; own surveys as well as surveys carried out by otherresearch teams, and data representing results from other research in IMPETUS. Some of thesedata were not consistent with data from other sources (e.g. regional commodity balances, regionalprice links, trade costs and flows, etc.), a problem which had to be solved with specialbalancing techniques which were partly developed in an innovative way (see Jansson (2005a) fordetails of the transport cost estimation).
Subproject A4 IMPETUS 163Economic modellingBENIMPACT 1 is a numerical spatial agricultural sector model programmed in GAMS, the mainfeatures of which have been developed during the second phase of IMPETUS. Food supply isrepresented by regional 2 aggregate farm models with a calibrated supply function which is quadraticin crop mix shares. Commodity demand is expressed by a generalised Leontieff expendituresystem (Ryan and Wales, 1996) with time separability (four periods per year). Regional marketsare linked through net trade flows. Eight major important food and cash crops represent farmoutput, 3 while the integration of a livestock module is in progress. Scenarios runs are calculatedin a recursive-dynamic fashion in five-year steps until 2025. The long-term impact of climatechange on yields of crops and pastures was projected using the CWR tool (Crop Water Requirementcalculator), where differentials between theoretically possible maximum yields and actualyields are determined by future deficits in water availability (Kuhn et al., 2005).WorkshopsA first BenIMPACT presentation workshop took place in fall 2003 in Cotonou. In November2005, survey results concerning animal husbandry were presented at a roundtable meeting withanimal husbandry experts in Cotonou.Multidisciplinary activitiesResearchers of workpackage A4-3 became leading scientists in two inter-disciplinary problemclusters (PKs):• PK Be-E.1: The impact of resources pressure and rainfall variability on land use andfood security in Benin (responsible: Dr. Arnim Kuhn)• PK Be-E.5: Land and water requirements of livestock husbandry in Benin (responsible:Ina Gruber)Simulation of scenariosScenario simulations covering the period 2000-2025 were started as soon as the recursivedynamicversion of the agricultural sector model BenIMPACT had been finished in the beginningof 2006. Important inputs were delivered from climate research and demographers withinIMPETUS. Results of scenario simulations are presented in the next section.123A description of BenIMPACT can be found in Jansson (2005a, 2005b, 2005c).The regional partition is currently applied to the departmental level within Benin. Neighbouring countries ofBenin as well as the ‘rest of the world’ are represented with stylised supply and demand functions.These are maize, cassava, yam, pulses, cotton, sorghum and millet, peanuts, and rice.
164IMPETUS Subproject A4Results of research activitiesCropland use: Exploring the link between land availability and yieldsScenario designThe assumptions for the scenario 2025 are based on trends in population growth, internal migration,climate change 4 and national income per capita. Demographic projections for Benin’s departmentsfor 2025 were provided by Doevenspeck and Heldmann (2005). Moreover, real worldmarket prices are kept constant. Annual growth in real income for the non-agricultural sector ofone percent per capita is assumed.The first scenario is the ‘business as usual scenario’ (BAU) for the year 2025 considering onlythe impacts of climate change on crop yields. In the BAU scenario, agricultural land use is expandeddue to high population growth causing higher demand for food, and economic growth innon-agricultural income of one percent per capita is assumed. As the country’s arable land resourcesare becoming scarcer and more degraded, the second scenario “yield decrease” (Yieldec)is built on the additional assumption that there is a negative relation between available land reservesand crop yields for some crops (maize, cotton, pulses, peanuts). For these crops, yields arenot fixed as in the BAU scenario, but determined endogenously considering decreasing yieldswhen more and more land reserves are taken into cultivation and thus the share of fertilitypreservingfallow in the cropping cycle decreases.The negative relation between crop yields and the duration of fallow in shifting cultivation haslong been a stylised fact in tropical agronomics and a basis for the theory of endogenous agriculturalintensification as first formulated by Boserup (1965). For Benin, it is fair to assume a negativerelation of some crop yields with the share of fallow in the rotation. Maize yields, for instance,where almost three times higher in the thirties than today in the southern parts of thecountry (Igue et al., 2000). Thus, additional features have been added to BENIMPACT to takeinto account the effect of yield decline due to a smaller share of fallow in the cropping cycle. Across-sectional estimation of the yield-fallow relationship yielded negative coefficients formaize, pulses and peanuts, and cotton.ResultsFig. A4-10 and Tab. A4.3 shows selected results for the two scenarios for 2025. Fig. A4-10compares the development of crop area use in southern, central and northern Benin for the twoscenarios. At the start of the simulation period, southern Benin still has the largest crop area, butfew reserves which are about to be used up within the BAU scenario. Thanks to larger land reserves,crop area use swiftly increases in the central and northern part of the country, reaching itsmaximum by 2015 already. While both scenarios result in land reserves almost entirely used upby 2025, the increase of crop area is slower in the scenario where yields of some crops decreasewith decreasing available crop area. This may seem counter-intuitive, but as farm households can4The projected consequences of climate change on crop yields in 2025 have already been described in the previoussection.
Subproject A4 IMPETUS 165“sell” surplus labour, decreased crop productivity is rather likely to be compensated in this wayinstead of using ever more land. The important result is that land is not used up as quickly asrural population growth would suggest.Crop area in1000 haBusiness as usualCrop area in1000 haSimulation of endogenous yields100010009009008008007007006006005005004004003002000 2005 2010 2015 2020 20253002000 2005 2010 2015 2020 2025Southern Benin Central Benin Northern BeninSouthern Benin Central Benin Northern BeninFig. A4-10: Development of crop area use in the two different scenarios, Source: Kuhn and Gruber (2006)Tab. A4-3 shows that the average nutritional status of the population improves in the BAU scenariofrom 2381 to 2464 kcal per capita and day, which is somewhat lower than the ‘medium’estimates by IFPRI (2005) for all Sub-Saharan Africa. According to these estimations, the foodsituation seems to improve slightly until 2025. Additional calorie intake is delivered by roots andtubers (cassava and yams) in the first place, followed by pulses. In the scenario with exogenousyields, the increase in calorie intake is less than in the BAU scenario, but still strongly positive.Tab. A4.3: Population and calorie intake from food crops in Benin, 2001/02 and 2025Base period2001/02BAU 2025scenarioChange to baseperiod in %YIELDEC 2025scenarioChange to baseperiod in %Population in 1000 6769 12594 86.0 12594 86.0Calorie intake a 2381 2464 3.5 2447 2.8Calories produceddomestically 2300 2425 5.4 2411 4.8Calorie net trade -81 39 - 36 -in % of total calorie intake 3.4 1.6 - 1.5 -a. kCal/capita and dayWhen looking at results at the regional level (omitted), it becomes clear that developments inboth scenarios will be highly dependent on the availability of land. While the land-rich northernand central departments of Atakora, Alibori, Bourgou and Donga will enjoy strong increases incalorie intake, those departments with land constraints such as Atlantique, Zou or Couffo willexperience stagnating or even decreasing food intake.Livestock husbandry: water and fodder needsIn the second phase of the project another thematic focus has been set on livestock husbandrydue to its manifold interactions with cropping. Particularly in the area of land use, cropping and
166IMPETUS Subproject A4livestock management are progressively more competing for scarce land. While livestock productionactually depends to a great extent on the availability of natural pasture, the expansion ofcropland leads to a reduction of natural pasture, which is why the availability of forage will bereduced by continued conversion of pasture/fallow into cropland. At the same time the developmentduring the last ten years shows a clear increase in animal numbers as expanding herds is theonly response to higher demand in animal products. There still seems to be sufficient land availablein most of Benin’s regions that both an expansion of cropland and land requirements forruminant livestock is feasible. But this coexistence is sure to change in the long run when agriculturalland reserves will become short. This implicates that one production system will crowdout the other. For Benin it is assumed that cropping will dominate livestock husbandry like inother African countries such as in Ethiopia (Ghirotti, 1998), primarily due to the stronger positionof crop farmers as compared to migrating herders when it comes to establishing and exercisinguse and property rights in the traditional land use system. At present, in regions where landreserves exist, beef production is obviously higher than in densely populated regions, as thetranshumant production mode requires land reserves as pasture. In the southern regions, mostagricultural land is used for crop production and no natural pasture is left for large ruminants. Asintensive farming systems for pigs and chicken have not yet been established, these animals largelyfeed on household waste and crop residues. We can therefore expect a stable supply of porkand small ruminants, whereas production of beef will inevitably be reduced if herders continue torely solely on the transhumant production mode.In addition to production difficulties due to seasonal and regional availability of fodder, animalkeepers are concerned with continuous drinking water supply for their herds.in % of all sources per season70,060,050,040,030,020,010,00,0puddle marigot river barrage wellrainy seasondry seasonFig. A4-11: Used water sources for livestock according to season, Source: own survey, 2005Water sources used differ significantly with respect to the season, as Fig. A4-11 shows. Smallpuddles alongside streets and “Marigots” are the main water sources for livestock, whereas water-bearingrivers and wells are used more frequently in dry season. In the northern regions ofBenin, where productive livestock need up to twice the water amount than human beings (seealso interim report, 2006), this can lead especially in dry season to competitive situations or evenconflicts among the user groups near water sources.
Subproject A4 IMPETUS 167LiteratureAdams, Eyring, Schopp 2005: Water consumption in urban areas. In: Thamm, H.-P.; Schütz, O., Christoph, M (Publishers) 2005:IMPETUS Atlas - Benin - Research Results. Bonn, Publishing House: University of Bonn, Remote Sensing ResearchGroup, ISBN 3-9810311-2-1.Alchian, A. A., Demsetz, H., (1972): Production, Information Costs and Economic Organization. American Economic Review,December 1972: 777- 95pp.Behle 2006: Ländliche Trinkwasserversorgung in Benin unter Berücksichtigung der nationalen Wasserstrategie “Alimentation eneau potable et assainissement en milieu rural”, Rheinische Friedrich-Wilhelms-Universität Bonn, Dissertationsschrift,URN: urn:nbn:de:hbz:5N-05988; URL:http://hss.ulb.uni-bonn.de/diss_online/landw_fak/2006/behle_cornelia/Boserup, E., 1965: The conditions of agricultural growth. The economics of agrarian change under population pressure.Earthscan Publications Ltd., London.Behle, Schopp 2003: Water supply situation in Benin, West-Africa In: Technological and Institutional Innovations for SustainableRural Development, Book of Abstracts, Deutscher Tropentag 2003, Georg-August-Universität GöttingenDeng, Zh.X., Janssens, M.J.J., 2004. Shaping the future through pruning the mango tree? A case study in Upper-Ouémé, NorthBenin. International Conference on integrated water resource management of tropical river basins, Cotonou, Octobre2004.Doevenspeck M. and Heldmann M., 2005: Population projections for Benin. In: IMPETUS Atlas Benin: research results, version1.0.Ghirotti M., 1998: The role of livestock in mitigating land degradation, poverty and child malnutrition in mixed farmingsystems: The case of coffee-growing midlands of Sidama – Ethiopia. http://www.fao.org/documentsHadjer, Klein, Schopp 2005: Water consumption embedded in its social context, north-western Benin. In: Physics and Chemistryof the Earth. Special Issue, Vol. 30, Issues 6-7, S. 357-364. See also:http://authors.elsevier.com/sd/article/S1474706505000434.IFPRI, 2005: Facing Alternative Futures – Prospects for and Paths to Food Security in Africa. 2020 Africa Conference Brief 17.Igue A. M., Floquet A., and K. Stahr, 2000: Land use and farming systems in Benin. In: Graef, F., Lawrence, P., and M. vonOppen [eds.], Adapted Farming in West Africa: Issues, Potentials and Perspectives. Grauer, Stuttgart, Germany.Jansson, T., 2005a: Two ways of estimating a transport model. Discussion Paper 2005:1, Institut für Agrarpolitik, UniversitätBonn. Download: http://www.agp.uni-bonn.de/publ/dispap_d.htmJansson T., 2005b: A demand system for the BenIMPACT model. Department for Agricultural Policy, Bonn University. TechnicalPaper, March 2005. Download: http://www.agp.uni-bonn.de/agpo/rsrch/impetus/A4_publi_e.htmJansson T., 2005c: The Economic Model BenImpact. Department for Agricultural Policy, Bonn University. Technical Paper,May 2005. Download: http://www.agp.uni-bonn.de/agpo/rsrch/impetus/A4_publi_e.htmJanssens, M.J.J., Deng, Zh.X., & Mulindabigwi, V. (2004). Contribution agronomique à la validation des scénarios hydrologiquesdu bassin de l’Ouémé. Worshop Le cycle hydrologique du bassin versant de l’Ouémé et ses implications socioéconomiques,Cotonou, Octobre 2004.Kuhn, A., Gruber, I., Doevenspeck, M., Paeth, H., 2005: The Impact of Resources Pressure and Rainfall Variability on Land Useand Food Supply in Benin. Vortrag <strong>zu</strong>r GLOWA-Statuskonferenz 18./19.05.2005, Universität <strong>zu</strong> Köln.Ryan, D.L.; Wales, T.J., 1996: Flexible and semiflexible consumer demands with quadratic Engel curves; Discussion paper No.96-30, University of British Columbia.Tonuhewa 2006: Mündliche Auskunft, Chef Genie Rural, Porto Novo, Benin.UNESCO 2003: Wasser für Menschen, Wasser für Leben – Weltwasserentwicklungsbericht der Vereinten Nationen. UNO-Verlag, Bonn.Van de Sand 2005: Die MDG als Herausforderung für die deutsche Entwicklungspolitik. Die Geberländer müssen eine effizientereUnterstüt<strong>zu</strong>ng leisten. In: ded Brief, Heft 2, Juni 2005. Bonn. S. 8-11.WWC 2003: http://www.worldwatercouncil.org/Vision/Documents/WestAfrica2.PDF, 23.08.2004
Subproject A5 IMPETUS 169Teilprojekt A5Verfügbarkeit, Qualität und Management von natürlichen Ressourcen:Sozialwissenschaftliche und medizinische PerspektivenAvailability, quality and management of naturalresources: social and medical perspectivesAntragsteller / ParticipantsProf. Dr. M. Bollig (Koordinator)Institut für Völkerkunde, Universität <strong>zu</strong> KölnDr. Dr. R. Baginski / Prof. Dr. M. KrönkeInstitut für Medizinische Mikrobiologie, Immunologieund Hygiene, Universität <strong>zu</strong> KölnDr. J. Verheyen / Prof. Dr. H. PfisterInstitut für Virologie, Universität <strong>zu</strong> KölnFach / DisciplineEthnologieSocial anthropologyMedizin:Bakteriologie, Chemie und ToxikologieMedicine:bacteriology, chemistry and toxicologyMedizin:VirologieMedicine:VirologyZusammenfassungDie Szenarienanalyse als Ziel von IMPETUS in der zweiten Förderphase führte <strong>zu</strong>r inhaltlichenund methodischen Weiterentwicklung der sozialwissenschaftlichen „Workpackages“. Inhaltlichgingen aus den Workpackages drei Problemkomplexe hervor, die in wichtigen Themenfeldernhinsichtlich der Entwicklung von Managementlösungen für die Wassernut<strong>zu</strong>ng als dem Gesamtzieldes Projektes angesiedelt sind.Der Problemkomplex „Demographische Projektionen für das Ein<strong>zu</strong>gsgebiet des Ouémé (PK Be-G.1)“ ist dabei als Basistool an<strong>zu</strong>sehen, mit dem wichtige demographische Entwicklungen angesichtsunterschiedlicher <strong>zu</strong>künftiger Rahmenbedingungen prognostiziert werden können. Einzentrales Produkt stellen Bevölkerungsprojektionen für den IMPETUS Szenarienzeitraum bis2025 dar, die bis auf die kommunale Ebene räumlich differenziert sind.Der Problemkomplex „Wassermanagement und institutioneller Wandel (PK Be-G.2)“ analysiertneue Managementregime im Wassersektor zwischen zentralstaatlichen Wasserbehörden, denGemeinden als wichtiger Ebene der Entwicklungsplanung seit der Dezentralisierung und lokalenEntscheidungsträgern. Ziele sind die Entwicklung von qualitativen „Policyszenarien“ sowie dieGenerierung von Daten bezüglich der Errichtung von Wasserstellen, ihrer Verwaltung und ihrerNut<strong>zu</strong>ng im Hinblick auf die IMPETUS-Modellbildung.Der Problemkomplex „Wasser und Existenzsicherung (PK Be-G.3)“ fokussiert die Entwicklungstatistisch repräsentativer Datensätze auf Regionalebene <strong>zu</strong>r Analyse lokaler Existenzsicherungsstrategienim Hinblick auf den Umgang mit und Zugang <strong>zu</strong>r Ressource Wasser. Im Zent-
170IMPETUS Subproject A5rum steht die Einbettung lokaler Strategien des Trinkwassermanagements in soziales und wirtschaftlichesHandeln, wodurch Daten <strong>zu</strong> Themen wie ‚Wasser als produktives Gut’, Gesundheitoder Ernährungsunsicherheit generiert und der Modellbildung <strong>zu</strong>gänglich gemacht werden.Als zentrale Datengrundlage für die Problemkomplexe „Wasser und Existenzsicherung“ sowie„Wasser und institutioneller Wandel“ dient ein statistisch repräsentativer quantitativer „Regionalsurvey“<strong>zu</strong>r Existenzsicherung im oberen Ouémé Ein<strong>zu</strong>gsgebiet, der im Jahr 2004 umgesetztwurde. Wichtige Erkenntnisse und Fragestellungen der ursprünglichen Workpackages flossen indie Konzeption der Erhebung ein. Im Zentrum stand das „upscaling“ komplexer sozialer Sachverhalteder Lokalebene auf die Gemeindeebene im Rahmen der IMPETUS-Szenarienanalyse.Zu Beispielen zählen Reziprozität und Gabentausch, Kapitalakkumulation und Konsumtion, Geschlechterdifferenzenoder der Ressourcen<strong>zu</strong>gang und –transfer. Anders als in bisherigen quantitativenStudien <strong>zu</strong> Benin wurde ein innovativer Ansatz entwickelt, der Geschlechterdifferenzenund die soziale Einbettung der Ökonomie der Modellbildung durch die Umset<strong>zu</strong>ng einer akteurszentriertenBefragung von Frauen und Männern <strong>zu</strong>gänglich macht. Als Produkt steht nun demGesamtprojekt und beninischen Anwendern eine statistisch repräsentative sozioökonomischeDatenbank als wichtiges IMPETUS-Produkt <strong>zu</strong>r Modellierung und Integration in ein „SpatialDecision Support System“ (SDSS) <strong>zu</strong>r Verfügung.Die nachhaltige Implementierung wissenschaftlicher Erkenntnisse in den Bereich der Entwicklungsplanungerfordert Maßnahmen des Kompetenztransfers. Vor diesem Hintergrund wurde dieDatenbank für beninische Anwender aufbereitet und eine Schulungsmaßnahme <strong>zu</strong> ihrer Benut<strong>zu</strong>ngmittels des sozialwissenschaftlichen Statistikprogramm SPSS entwickelt und durchgeführt.Im Rahmen der Schulungsmaßnahmen wurde die Datenbank Vertretern der Departements undder Gemeinden übergeben.Im medizinischen Bereich des Teilprojekts befasst sich der Problemkomplex „Bakteriologischeund virologische Belastung von Trinkwasserquellen im oberen Ouémé-Ein<strong>zu</strong>gsgebiet (PK Be-G.5)“ mit der Qualität des Trinkwassers. Ca. 2 Mio. Menschen, darunter besonders Kinder unter5 Jahren, sterben jährlich an Durchfallerkrankungen, die auf kontaminiertes Wasser <strong>zu</strong>rück<strong>zu</strong>führensind (WHO, 2004). Bedingt durch eine schlechte Trinkwasserqualität sinkt auch dieArbeitskraft in den betroffenen Populationen deutlich. Im Rahmen des PK Be-G.5 wird der Einflussunterschiedlicher Faktoren auf die Qualität des Trinkwassers im Beprobungsgebiet ermittelt.Zu diesen Faktoren gehören die Art der Wasserquelle, das Hygieneverhalten der Brunnen-Nutzer, das Halten bestimmter Tiere im Umkreis der Wasserquelle, die Geologie des Brunnenstandortes,klimatische Bedingungen sowie verschiedene Sanierungs- und Desinfektionsmaßnahmen.Anhand der mit etablierten Analyseverfahren ermittelten Daten <strong>zu</strong>r bakteriologischenund virologischen Wasserqualität werden die erwähnten Einflussfaktoren bewertet und entsprechendihrer Bedeutung in das Expertenmodell MIVIK integriert. MIVIK soll dabei helfen, anhandder gesammelten Informationen einen Überblick über Risikokonstellationen innerhalb desoberen Ouémé-Ein<strong>zu</strong>gsgebietes <strong>zu</strong> bekommen, die an Entscheidungsträger weitergeleitet werdenkönnen. Ziel ist es, durch den gezielten Transfer von Daten <strong>zu</strong>r Verbesserung der wasserhygienischenSituation im ländlichen Benin bei<strong>zu</strong>tragen.Ein weiterer Problemkomplex an der Schnittstelle zwischen Meteorologie und Medizin befasstsich mit der „Risikoabschät<strong>zu</strong>ng bezüglich des Auftretens von Malaria und Meningokokken-
Subproject A5 IMPETUS 171Meningitiserkrankungen in Westafrika unter dem Einfluss des heutigen und eines modifizierten<strong>zu</strong>künftigen Klimas (PK Be-G.4)“. Jährlich treten südlich der Sahara 90 % der über 1 MillionenMalariatoten auf (Greenwood und Mutabingwa, 2002). Im so genannten „Meningitis-Gürtel“erkranken jährlich bis <strong>zu</strong> 200.000 Menschen an der gefährlichen Meningokokken-Meningitis(Sultan et al. 2005). Im Falle der Malaria wird mit Hilfe des sog. „Liverpool Malaria Model(LMM)“ die Malaria simuliert. Für die Abschät<strong>zu</strong>ng von Veränderungen, die sich für das Malariarisikoin einem modifizierten Klima ergeben, werden verschiedene Szenarienläufe des „RegionalModel (REMO)“ verwendet, die auf unterschiedlichen Treibhausgasemissionen und Veränderungender Landoberfläche basieren. Bezüglich der Meningokokken-Meningitis soll anhandvon Daten synoptischer Wetterstationen aus Benin und Niger untersucht werden, inwiefern dieWitterung in der Trockenzeit das Auftreten von Meningitisfällen beeinflusst. Die aufgedecktenZusammenhänge zwischen meteorologischen Variablen und Meningitisfällen werden in einem <strong>zu</strong>entwickelnden statistischen Modell integriert, um das Vorkommen von Meningitisfällen in derZukunft abschätzen <strong>zu</strong> können.SummaryScenario analysis as the aim of IMPETUS in the second phase of the incentive period leads tothe further development of the content and method of the social scientific workpackages. Withregard to content, three problem clusters arose out of the workpackages that are established inimportant topic areas concerning the development of management solutions for water use as theoverall objective of the project.The problem cluster “Demographic projections for the Ouémé Catchment (PK Be-G.1)” can beconsidered to be a basis tool with which important demographic developments can be forecast inthe light of diverse future determining factors. A central product constitutes the population projectionsof the IMPETUS scenario period up to 2025 which are spatially differentiated until themunicipal level.The problem cluster “Water management and institutional change (PK Be-G.2)“ analyses newmanagement regimes in the water sector between central government water authorities, the districtsas an important stage in the development planning since decentralisation and local decisionmakers. The objectives are the development of qualitative policy scenarios as well as thegeneration of data concerning the construction of water sites, their maintenance and their utilisationwith regard to the IMPETUS modelling.The problem cluster “Water and livelihood security (PK Be-G.3)” focuses on the development ofstatistically representative data sets at a regional level in order to analyse local livelihood securitystrategies in view of the access to and the maintenance of the resource water The centralobjective is the integration of local strategies for potable water management in social and commercialactivities, whereby data on themes such as “Water as a productive commodity”, healthor food insecurity are generated and made accessible to the modelling.A statistically representative and quantitative regional survey for livelihood security in the UpperOuémé Catchment which was implemented in 2004 serves as the central data base for theproblem-clusters “Water and livelihood security“ and “Water management and institutionalchange“. Important insights and questions from the original workpackages were incorporated
172IMPETUS Subproject A5into the conceptional design of the survey. The main focus was the up-scaling of complex socialcircumstances at local level to communal level in the scope of the IMPETUS scenarios analysis.Reciprocity and exchange of gifts, consumption and the accumulation of capital, gender differenceswith regard to access to and the transfer of resources are some examples. Different fromprevious quantitative studies over Benin, an innovative approach was developed which makesgender differences and the social integration of the economy accessible to modelling through theimplementation of an actor centred interview for men and women. Now the overall project andBeninese stakeholders have a statistically representative socio-economic data bank as an importantIMPETUS product at their disposal for modelling and integration in a “Spatial DecisionSupport System” (SDSS).The sustainable implementation of scientific findings in the field of development planning necessitatesmeasures for competence transfer. With this in mind the data bank was produced for Beninesestakeholders and training measures for its use were developed and implemented throughthe social scientific statistics programme SPSS. In the framework of the trainings the data bankwas handed over to the representatives of the departments and the districts.Within the medical area of the subproject, the problem cluster “Bacteriologic and viral contaminationof drinking water sources in the Upper Ouémé Catchment (PK Be-G.5)” deals withsweet-water-quality in Benin. Almost two million people, especially children under the age offive years, die of diarrhoeal diseases due to contamination of drinking water each year (WHO2004). Unsafe drinking water supply also decreases manpower of the consumers. The main topicof PK Be-G.5 is to investigate the influence of several different factors on microbial water quality,as there are the kind of drinking water source, hygienic behaviour of water consumers, animalhusbandry near the water source, geology of the site, climate conditions and sanitary- orreconstruction measures, and water disinfections. On the basis of the data concerning bacterialand viral water quality which were acquired by means of established methods the magnitudes ofinfluence were estimated and integrated into the expert model MIVIK. The database and expertmodel assessments will help to understand the constellations of hazards in the Upper OuéméCatchment, thus supporting the work of local decision-makers by elucidation of rules that maycontribute to improvement of sanitary measures, better hygiene, adequate nutrition, and accessto clean water 5 .A second problem cluster at the interface between medicine an meteorology deals with the riskassessment with regard to the occurrence of malaria and the meningococcal meningitis diseasesin West Africa under the influence of the present and a modified future climate (PK Be-G.4).Malaria is leading in sub-Saharan Africa to at least 90% of the more than one million yearlymalaria deaths (Greenwood and Mutabingwa, 2002). In the so- called “Meningitis Belt” up to200,000 people are affected by the dangerous meningococcal meningitis disease (Sultan et al.2005). Malaria is simulated using the so called “Liverpool Malaria Model (LMM)”. For theassessment of modifications in the malaria risk in the future the data from the transient REMO(“Regional Model”) scenario-runs will be used, that are based on different greenhouse-gas
Subproject A5 IMPETUS 173emissions, as well as land-surface modifications. In the case of the meningococcal meningitisspecial weather conditions and meningitis cases will be correlated in order to find a close connectionbetween weather and the disease. Detected connections will allow for the development ofa statistical model in order to simulate future climate impacts on the meningococcal meningitiscases.PK Be-G.1: Demographic projections for the Ouémé CatchmentThe aim of the problem cluster which arose from the workpackage “Scenarios for populationdevelopment and population dispersal” is the differentiated spatial modelling of the demographicdevelopment in the whole Ouémé Catchment as an important component of the IMPETUS scenarioanalysis and the IMPETUS Spatial Decision Support System (ISDSS) that is to be developed.The compilation of spatial differentiated projections and their visualisation were carried out onthe one hand for the diverse catchments of the High, Middle and Lower Ouémé as the threeIMPETUS scenario regions, and on the other hand in the framework of the down-scaling on thelevel of the 77 districts as important actors of the development planning including their respectivesub-districts. The demographic projections for the urban population were considered at thesediverse spatial levels as well.The compilation of the demographic projections was carried out with the expert model SpectrumDemProj. Current population figures from the state census in 2002 were used as input data.Questions on important demographic parameters for the departments were included such as fertilityand death rates as well as migration rates. Furthermore, assumptions, based on sound regionalknowledge, regarding the future development of these parameters as well as assumptionsfrom the three IMPETUS scenarios were included in the calculation of the projections in yearlystages up until 2025. As a result, there exist now projections for population density in whichgender and age differentiated population figures, mortality and fertility measures, growth ratesand doubling rates are included.An important result is the projection of the current total population of Benin up to the year 2025,which will almost double under the basic parameters of all three IMPETUS scenarios. A particularlyimportant example of a result for the regional development planning and the capacity buildingof the districts is, furthermore, the depiction of the population development according to thescenario conditions from the extrapolation of current trends (scenario BIII), differentiated on acommunal level (Fig. A5-1).Here, the urbanisation process due to a strong growth rate of over 5% becomes apparent in theurban agglomeration between Cotonou, Abomey-Calavi und Porto-Novo. However, also a lot ofdistricts in rural areas in Central and North Benin, such as parts of the HVO, show high growthrates due to continuous immigration and a continuous high fertility level. This will place the developmentplanning before significant challenges in respect to the management of natural resourcesincluding water.
174IMPETUS Subproject A520022010 2015DjougouParakouGlazoueOuesseKetou0 100 200kmAbomey-Calavi2020 2025 Population of the Communesinhabitants / km²< 5051 - 100101 - 250251 - 400401 - 550551 - 700701 - 900901 - 1.100> 1.100DépartementsCommunesFig. A5-1:The development of population density in Benin’s districts up to 2025 according to scenario BIII.PK Be-G.2: Water management and institutional change.The scientific monitoring of decision making in the water sector through policy scenarios demandsaccurate knowledge of a quickly changing institutional scene due to decentralisation. Thisproblem cluster, which has developed significantly from the workpackage “Management of waterand water dependent resources in social and political arenas in the Upper Ouémé Catchment”as well as from the consecutive scientific monitoring of the involved staff concerned with thedecentralisation process, analyses new institutional arrangements of the water sector, generatesdata for future water use and infrastructure and thus derives policy scenarios. The following figureof the qualitative expert model illustrates several of the central questions in view of the decentralisationof the water sector.Qualitative orientated surveys, a policy documentation conducted in all departments at the levelof the central actors in the water sector and insights based on the regional survey on livelihoodsecurity were considered in the results.
Subproject A5 IMPETUS 175DonorsPolicy recommendationsand financingMinistry of Mine, Energyand Hydraulic(MMEH)OrdersPolicy formulation and agenda setting (PADEAR)Regional water resource service (SDH) Implementation of PADEARNGOsOrdersNatural conditions of water useExisting relationshipEmerging relationship with example(= object of policy analysis)Construction companiesTransfer of competencies and finances?Construction of infrastructureCapacity buildingOrders?Localcontributions?Collection of taxes?Water points per village?VillagesUser associationsDistrictsSubdistrictsTarifs?Local water quality and availabiltyMaintenance?Fig. A5-2:The changing institutional landscape of Benin’s water sector and central research areasWith regard to the planned finance and competence transfer from the de-concentrated state-runwater authorities at the regional levels to the districts (Fig. A5-2) in the framework of the decentralisationit can be seen that the situation has hardly changed in comparison to the time previousto decentralisation. The governmental water authorities, at which level the donor financed staterunwater programme PADEAR is established, still control the administration of the water sector.The districts, which should be gaining stronger decision making and coordination functionsin the framework of the water sectors communal development plans, do not have any funds attheir disposal in order to build water points. Also their coordination function with regard to themanagement of the existing public supply network or its extension can be seen to be weak. Forexample, requests for new water points or repairs are still dealt with intermediary NGOs betweenvillage decision makers and the state-run water authorities or between village authorities andprivate service providers. The establishment of communal funds for a stronger involvement inthe water sector therefore fails not only because of the institutional inertia of the governmentalagencies, but also on the resistance of the local decision makers against entrusting the districtswith a part of the village generated income from the utilisation of the water point without a clearmandate. For this reason, there will probably be no change to the fundamental situation of disparitybetween villages from a district with regard to the provision of water infrastructure: villages,whose decision makers have good connections to those responsible in the state-run watersector and who have large local funds at their disposal, will still profit disproportionately fromthe state-run water programme.In this respect the quantitative increase of water sites established in the departments says littleabout the actual supply situation of broader sections of the population. This can be made clear on
176IMPETUS Subproject A5the basis of the results from the regional survey concerning the dependency of the population onunclean drinking water, for example from inland valleys, spatially differentiated according todistricts.100%90%80%70%60%50%40%Noyes (dry season)yes (whole year)30%20%10%0%Fig. A4-3:Bassila Copargo Djougou N'Dali Ouaké Parakou TchaourouNecessity of using inland valleys in the districts of the Upper Ouémé Catchment (Regional survey,2004, n = 839)As can be seen in Fig. A5-3, in some of the districts up to 40% of the population is partially dependenton unclean water. This figure has been reached spanning over districts for groups suchas the Fulbe whose settlements are scattered over a large area due to their economic strategies.Alongside the factors already mentioned local institutional arrangements also decide on the individualaccess to clean drinking water. Concerning this matter, several of the causes of classicalproblem spheres known from the qualitative preliminary studies have been recorded quantitatively.These include the inadequate conflict solving competence of user committees or the rationalefor local preferences with regard to the type of water site. These can hinder the optimalefficiency of the local supply network. The institutional uncertainty in conflict cases and the fearof the (female) population for wells which have been cast with a bad spell are given as examplefindings. Decision making criteria that are deemed as being central in the public discourse (e.g.distance between the dwelling and water site) in reality play a subordinate role in the selection ofthe water site. In contrast, a higher relevance pertains to criteria’s which have been neglected inthe planning up until now. One of them is the fear of a broader section of the population of usingwater sites which are objects of occult practises. The aim of the third incentive phase is the integrationof the data concerning water obtained from the policy documentation and the regionalsurvey in an ISDSS. Policy scenarios continue to be compiled for the future development of thewater sector.PK Be-G.3: Water and livelihood securityRealistic estimations of local livelihood security strategies depict an important component of theformulation of scenarios and courses of action. The present problem cluster considers findingsfrom the micro and meso levels of livelihood security and vulnerability with regard to the influencingvariable water. As a starting point of the observation results from more than one year’s
Subproject A5 IMPETUS 177worth of ethnological research of the workpackages “Therapeutic pathways: availability, qualityand management of medical care” and “Influences of gender and hierarchy on the vulnerabilityof individuals and households” are taken. The integration and matching of the results of the microlevel took place through the regional survey for livelihood security (discussed below) in theUpper Ouémé Catchment.The problem cluster fulfils a holistic, quantitative applied observation of social and economicaction with reference to the access to and management of fresh water. As men and women primarilyaccumulate individually in the survey area and as there is a clearly marked gender specificallocation of rights, responsibilities and buying strategies the analysis of livelihood securitystrategies requires an equally weighted survey of men and women for the analysis. This procedure,implemented for the first time on a statistically representative level for quantitative socialresearch in the survey area, provides up-scaled results on the connection between water and livelihoodsecurity, which have so far been heavily neglected. This is especially relevant for the developmentof an ISDSS that satisfies the complex social realities.This can be exemplarily shown by water purchase and the economical dependence on water. AsFig. A5-4 shows, approximately 40% of the population depend on the additional purchase ofwater, thereof 17% all year round. This is especially an urban phenomenon - in the district Parakouonly 10% stated that they don’t spent money on water, as shown in Fig. A5-4.$1Ouaké$1$1CopargoBassila$1Djougou$1$1$1N'DaliParakouTchaourou0 50100Kilometers$1DépartementsCommunesCapitals of CommunesUpper Ouémé ValleyProportion of inhabitants:Proportion of inhabitants paying water7% - 25% 51% - 75%26% - 50% 76% - 89%not paying for waterpaying during the dry seasonpaying during the whole yearFig. A5-4: Purchase of water (Regional survey, 2004, n = 839)On the assumption that the average per-capita consumption amounts to 18.7 litres, the costs willsum up to approximately 1.000 CFA per month/adult. The mean value of a regular daily incomeof men and women constitutes 1.300 CFA, thus earning structures allow the additional purchaseof water. However, in reality men and women operate quite differently: men gain larger amounts
178IMPETUS Subproject A5over longer time intervals whereas women earn small amounts on a regular basis. Particularlywith regard to men, weeks may elapse without any income (80% of them did not earn any moneyon the previous day to the survey). Fetching water is traditionally a female domain. The extraexpenditure on water frequently results in domestic conflicts because of unresolved responsibilitiesfor payment.If the additional purchased water is used for productive activities, the responsibilities are clearlydistributed because men and women primarily operate separately. Altogether a third of the populationinterviewed requires water for productive activities, as shown in Fig. A5-5.$1Ouaké$1$1CopargoBassila$1Djougou$1$1$1N'DaliParakouTchaourou0 50100KilometersDépartements Economic activities depending on waterCommunes 50%$1 Capitals of CommunesUpper Ouémé Valley51% - 61%62% - 67%Access to secureand unsecure waterunsecure water (%)rather unsecure water (%)rather secure water (%)Fig. A5-5: Economic activities depending on water (Regional survey, 2004, n = 839)As can be seen on the map, the economic dependency on water reached 70% in two districts(Tchaourou, Ouaké). The poorest access situation to water exists in the northwest of the country.Alone in the district Copargo 37% of those interviewed depend on insecure sources all yearround. Nevertheless, 58% of the population exercises water dependent activities. This region isparticularly at risk in the case of drought or e.g. a non differentiated water-taxation: with the declineof available water, economic capacities diminish and vulnerability increases.Particularly women are dependent on water due to transformational activities carried out bythem, e.g. further processing of agricultural products into meals and beverages. Admittedly, thesewomen domains occur in other studies as sources of income. However, its interconnectionwith the collective production receives insufficient regard. For example, 23 % of all the interviewedwomen sold fruit or firewood (16%) which they had collected themselves in the bush.Where income is thus irregular and the dependence on outside influences such as rain is veryhigh (over half of those interviewed work in agriculture), precautions have to be taken for shortages– last but not least food is bought on a regular basis. The most salient strategy is maintained
Subproject A5 IMPETUS 179equally in urban and rural areas: networking. In times of crisis the family ranks as the first place:75% first turn to relatives. Also an active gift exchange takes place all year long. Women exchangemore frequently higher amounts of gifts in shorter time intervals and with a higher rate ofreciprocity, i.e. the gifts are mutual. Money, food, and paraphernalia are exchanged. Nevertheless,one-fifth of the interviewed people have taken out a loan in the last 12 months; thereof onethirddrew on relatives. Livelihood-security depends very much on the regular income of women.It is the men who earn a larger amount of money but the women who earn more regularly. Mostof the time women take over nursing and therefore the resulting loss of income has to be consideredas an important aspect. Often they pay for treatment, too. Only in cases of severe sicknessand hospitalization is this generally done by men. Thus, the role of men and women differ concerningnursing and the coverage of expenses for treatment. Concerning the 234 reported severecases of the regional survey (duration of illness-episode was longer than 7 days) 8.500.000 CFAplus diverse presents (cocks, sheep, goats, and beverages) were spent on treatment and transportationby families.With an increasing scarcity of water and a decreasing quality of water, infant mortality as well ascases of severe infection (including that of livestock) will rise. The resulting circumstances, e.g.higher work loads for the remaining healthy members of society, agricultural shortfall, loss oflivestock, and a higher financial burden, give rise to an increasing conflict potential and enhancethe vulnerability of individual, household and society. In total it should be noted that water accessand water quality have a strong impact on the economy and the individual’s vulnerability.Regional survey for livelihood security in the Upper Ouémé CatchmentAlongside the earnings from the problem clusters, the statistically representative regional surveyfor livelihood security constitutes a central contribution of the subproject A5 to the IMPETUSscenario analysis and to the development of a policy relevant ISDSS. It arose out of the originalworkpackage in the framework of the up-scaling of socio-economic data necessary for modelling.On the basis of long standing preliminary studies the main objective was to operationalisevariables for complex socio-economic questions and thus to make factors of livelihood securitymodelling and scenario analysis accessible. These factors have not been collected quantitativelyin Benin up to now and thus, for example, were not accessible for development planning.The following subject areas have been integrated into the regional survey from the workpackages:(1.) Ways of access to water and water management in local and regional political arenas,(2.) the influence of gender differences and hierarchies on the vulnerability of households andindividuals, (3.) availability, quality, and management in medical care as well as (4.) access toland, land transfer and land use. Furthermore, the integration of questions from other subprojectstook place, among which were crop rotation, soil quality, and agricultural innovation. The mostimportant areas of local livelihood security strategies were analysed on the basis of the followingmain topics: work and production, food, distribution and exchange systems, capital, water, andhealth.The statistically representative survey took place in the seven districts of the Upper OuéméCatchment (Ouaké, Djougou, N’Dali, Bassila, Tchaourou, Parakou, Copargo), which totals afifth of the countries area (22.260 km 2 ). 420 women and 419 men were interviewed in a period
180IMPETUS Subproject A5of 10 weeks by same-sex assistants in a total of 35 languages. The final product constitutes adatabank in SPSS for integration into the scenario analysis and as a component of the ISDSS.The extension of the second incentive phase could be used in order to prepare for the publicationof the innovative method of the regional survey in an internationally recognised socio-scientificprofessional journal.Capacity building with department and district representativesThe databank for livelihood security formed the basis for a training in the use of data banks bymeans of the socio-scientific statistic programme SPSS, which took place in December 2005 in”Laboratoire d'Etudes et de Recherches sur les Dynamiques Sociales et le Développement local“(LASDEL) in Parakou . In total 17 representatives from two departments and seven districts, inwhich the surveys had taken place, took part in the training. The regional development plannershave scant socio-economic data available on their administrative units, which could enable efficientdevelopment planning or the formulation of their own development projects. The databankwas prepared for the workshop and training materials provided. Furthermore, it was insured thatthe districts have available the technological conditions in order to operate the databank. Selectedand for the regional development plan relevant results, were presented prior to the introductionto SPSS and exercises for the practical use of the databank. Furthermore, during theworkshop the needs of the departments and districts for further capacity building measures aswell as the desired contents of the same were determined (see article by V. Mulindabigwi). Forexample, as a result of these needs analysis follow on trainings will be organised with a reviewedcontent and will become a component of the third incentive phase.PK Be-G.5: Bacteriological and viral contamination of drinking water sources in the UpperOuémé CatchmentUnsafe water supply, inadequate sanitation and hygiene may lead to diarrhoeal diseases such ascholera, dysentery, and typhus. “In some developing countries, children have more than 12 episodesof diarrhoea per year and diarrhoeal diseases account for 15-34% of all deaths. The diversityof bacterial and viral infections that may cause diarrhoea complicates accurate surveillanceand diagnosis (…). The specific disease burden attributable to a particular infectious agent isespecially complex, given the multiplicity of these agents and their serotypes, and depends onlaboratory facilities” (WHO diarrhoea). In rural areas of Benin water for human consumption ismostly obtained from open surface water sources like ponds, lakes, rivers, and traditional or modernwells. Drinking water from groundwater sources like boreholes with pumps can only rarelybe found.As a first step to estimate the burden of water-borne bacterial and viral disease contaminants allwater sources supplies in the Upper Ouémé Catchment were located and recorded. The databaseof more than 1300 fresh-water sources shows that 89% are open wells (traditional and modern)representing the most frequent type of drinking water sources. While 4.5% are ponds and lakes,boreholes with pumps represent only 5% of the registered water sources. Moreover, some villagesdo not have access to water from boreholes at all. The problem cluster PK Be-G.5 has beencreated in 2005 of the consisting workpackages A5-6 and A5-7 dealing with viral, bacteriologi-
Subproject A5 IMPETUS 181cal and chemical drinking water quality and operating in the same catchment on the basis of thesame database of drinking water sources. This database has been administered and regeneratedregularly and was upgraded with position data of all latrines and new built pumps and wells inthe survey area.In Parakou our central laboratory with facilities to access modern standard laboratory proceduresfor water analysis has been established. The competence for bacteriological, chemical und virologicalmethods has been extended to three local laboratory assistants.Bacterial pathogens like E. coli, coliforms, Yersinia sp., Vibrio cholerae, Salmonellae, Shigellaeand Clostridium species can be isolated from water samples by cultivation on selective mediaand determined bio chemically and serologically at the IMPETUS-Laboratory in Parakou. Preliminaryresults of bacteriologic analysis of drinking water sources show that about 70% of allopen surface water sources like wells, ponds, and rivers are contaminated with faecal flora (E.coli and other coliform bacteria) and 8% of them even carry non-typhoid Salmonella entericassp. enterica. In contrast, water samples taken from closed borehole-systems with pumps arefound free of bacterial contamination. The presence of faecal bacteria in drinking water indicatesa source of contamination near the water source by which pathogen bacteria as Vibrio choleraeor typhoid Salmonellae may enter the water. After observations of the surroundings of watersites and hygienic behaviour of consumers it may be assumed that bacteria are passed from theground into the draw-well-water via so called “puisettes”. These black buckets, which are usedto scoop water from wells, are not stored under appropriate hygienic conditions.The isolated Salmonellae may be responsible for enteric fevers, gastroenteritis, and septicaemia.They are presumably of veterinary origin and are found to belong to rarely known serotypes inEurope. Multilocus sequence typing (MLST), a molecular method for typing of pathogen bacteria,has been established for characterization of all isolated Salmonella serotypes. A hitherto unknownserotype in the Kauffmann-White-scheme carrying the antigen-pattern 1,42:1,w:z35 wasfound in the village Yatanifaga and will be designated “Salmonella Parakou”. Further investigationswere carried out in the village Kaki Koka after six out of a total of 22 water sources werefound to be contaminated by Salmonellae. Stool samples of 357 water consumers who took upwater from these sources were examined for Salmonella ssp., Shigella ssp., Adeno- and Rotaviruses.The analysis of stool samples revealed that 2% of the inhabitants are carriers of Salmonellae,which amazingly are different to those found in the water sources, unable to contribute toepidemiological studies. These findings bring up new questions about the epidemiological chainand also to the immunological protection of the affected consumers. To assess their actual healthstatus and socio-medical habits additional questionnaire data were collected. They show a highprevalence of diarrhoea and other gastrointestinal diseases. The effect of sanitation initiatives oncontaminated water in open wells was investigated in 2004. In Benin water disinfections are usuallycarried out as chlorination, which implies the risk of production of disinfection by-products(DBP) like MX, a strong mutagen formed from chlorine and humic acids. In order to provide analternative and applicable method for water sanitation, the application of chlorine dioxide produced‘in-situ’ as an aqueous solution has been studied. Chlorine dioxide does not react withorganic material in water to bring up DBPs; however, its effectiveness is limited by the organicand inorganic matrix. Therefore killing-kinetics for E. coli, coliforms, Salmonella, Shigella,
182IMPETUS Subproject A5Clostridium and Vibrio sp. of this disinfectant, depending on the pH, TOC and permanganateindexwere determined, thus allowing adapting the concentration on the ambience demands. Themissed long-term effect again reinforces the thesis of recontamination of open water-sources dueto ongoing usage of contaminated “puisettes”.During the term of the second project phase several cooperation’s between different organisationsof well diggers and the laboratory of IMPETUS were initiated. The detection of unacceptablecontaminations of open-water-sources for instance changed the conceptual policy of theSwiss project HELVETAS for the sanitation of wells: Instead of restoring defective wells theydecided to convert them into closed pumping systems by central insertion of a hollow drill pipeinto a gravel-packed bed and coverage of the upper opening thus preventing contamination. Traditionalwells in 15 villages with unsafe water sources have been converted so far. Concurrenthygienic monitoring of these pumps affected by IMPETUS reveals that even after severalmonths the charge of faecal flora has been significantly reduced. In the same way IMPETUSactually accompanies constructions of small elevated tanks build by HELVETAS for supply ofseveral health centres in the region of N´dali and Tchaourou. In order to induce an analogouspolicy, other projects like DED, CARITAS, the local SRH ”Service Regional de l´Hydraulique”,with actual activities in construction of open-wells, a pre-post-monitoring has been offered andhygienic-survey is actually accomplished by IMPETUS. By these measures a stable and safeguardedlong-term-quality of water may be established.Valid methods that describe the chemical water quality are under construction at the laboratoryin Parakou. First results clearly show that an exclusive observation of the microbiological situationis insufficient to describe the total risk for consumers. In order to screen for parameters withunknown mutagen potential – like MX especially in chlorinated piped water - the AMES-Testwith S. Typhimurium TA98 and TA100 has been established.The analysis of water samples from the Upper Ouémé Catchment with regard to viral contaminationwas established in collaboration with the IMPETUS laboratory in Parakou and the Instituteof Virology in Cologne during the first phase. Filters loaded with 10l of water were sent to theUniversity of Cologne and were analysed for viral genomes of indicator viruses (Entero-, Hepatitis-Eand Noroviruses). Despite an increased number of analysed water wells at the beginning ofthe second phase, almost no viral contamination could be detected. Therefore the search for indicatorviruses was abandoned and the spectrum of analysed viruses was completed with Adeno-,Rota- and Hepatitis-A-Viruses, known for their water related occurrence. Especially Rotavirusescould lead to severe diarrhoea in young children with potentially life threatening complications.Diarrhoea caused by adenoviruses are often less severe but could affect more frequently adults.Hepatitis-A-Virus is the agent of a faecal-oral transmitted acute hepatitis that is endemic in thispart of the world due to low hygienic standards. We did not only focus on the detection of additionalviruses but also altered the technique of viral genome detection. Since the previously appliedpolymerase-chain reaction with gel detection was not suitable for quantitative virus detection,real-time polymerase chain reaction techniques were introduced for the detection of Adeno-, Entero-, Hepatitis-A-, Noro- and Rotaviruses. The new primers and procedures were tested withappropriate positive and negative controls ensuring the amplification of specific genomes. Moreover,validation experiments enabled us to gain apart from positive/negative findings (semi-)
Subproject A5 IMPETUS 183quantitative results for Adeno-, Entero-, Hepatitis-A (commercial kit), Noro- and Rotaviruses.Adenoviruses growing well in cell culture were used to create stocks with definite virus concentrations,which were diluted in 10l of tap water and filtrated similar to the procedure performedin Parakou with samples from drinking water sources. Further dilution experiments with adenovirusesrevealed a detection limit of about 1000 adenoviruses per 10l with this method. Theseresults preclude for this method any analysis of drinking water supplies in developed countries,but it is sufficient for surface water analysis as well as drinking water sources without routinelyperformed disinfection. Additionally, we analysed control samples of even more vulnerable enteroviruseswith a RNA genome that were treated like water samples in Parakou and were sentthereafter to Cologne for further analysis, which could confirm the presence of enterovirus genomes(Verheyen et al., 2005).With this well validated method we extended our efforts to analyse water samples of drinkingwater sources in the Upper Ouémé Catchment and finally we succeeded in detecting viral contamination.In about 10% of analysed water samples we could provide evidence of contaminationwith adenoviruses. Furthermore, 1.5% of drinking water sources were tested positive forrotaviruses but only 0.7% for enteroviruses. Interestingly, the first positive results were obtainedduring June/July, especially with moderate rainfalls in advance, in three villages nearby Parakou.These villages express beginning urbanisation like the implementation of latrines for more thanone household. These observations, together with the temporary nature of viral contaminationdue to continuous degradation of viruses in nature, suggested a contamination derived from watermovements in the upper part of the soil or even surface water flow contaminated with faecalspecies. This way of contamination, already described in the literature (Godfrey et al. 2005),seems to be even more likely, since some water wells obviously lacked proper surroundings. Dueto these findings we extended our water well database with geo-referenced coordinates of latrinesin the analysed area to determine high-risk constellations (Verheyen et al., 2006).A second cluster of adenovirus positive wells was detected in December and January 2004/2005during the dry season in the analysed area. Due to this fact, surface contamination was impossibleas the cause of our findings. In literature often two ways of contamination are discussed, onthe one hand the surface contamination by localised pathways and on the other hand contaminationby aquifer pathways, where pathogens migrate through the subsoil from a faecal source tothe water table (Godfrey et al., 2005). Since we were also able to detect adenoviruses in a rivernearby some positive wells, this second possibility seemed to be most likely.Altogether our results indicated two different pathways for viruses entering the analysed watersources, both depending on local conditions and seasonal changes. These revealed two differenthigh-risk periods of the year, where viral contamination could more frequently take place. Inorder to prove the relevance of adenoviral contamination of drinking water sources cooperationwith the University of Parakou was initiated. Stool samples from children with diarrhoea whowere hospitalized at the University of Parakou were analysed for rota- and adenovirus infection.These results could provide data about the burden of disease from diarrhoea due to adeno-/rotavirus infection. The numbers of rota- and adenovirus infections were quite similar during thefirst time period of observation, although adenovirus infection tended to be more frequent. This
184IMPETUS Subproject A5cooperation will be extended to reveal infection chains in more detail and to gain a response indicatorfor intervention efforts.The recent bacteriological, virological, chemical and toxicological findings should lead to a holisticview on the total risk for water consumers in the survey area.PK Be-G4: Risk assessment with regard to the occurrence of malaria and the meningococcalmeningitis diseases in West Africa under the influence of the present and a modifiedfuture climateMalaria and the meningococcal meningitis (MCM) are serious health problems in the world (e.g.De Savingy and Binka, 2004; Dittmann, 2004). On the basis of malaria alone distinct from 2billion people, i.e. more than 40% of the total world population, are exposed to the mosquitobornemalaria disease (WHO, 1997). Malaria is distributed by Anopheles vectors leading to highmortality rates. As a result, at least 90% of the more than one million yearly malaria deaths occurin sub-Saharan Africa (Greenwood and Mutabingwa 2002). In the case of MCM up to 200,000people are affected by this dangerous disease (Sultan et al. 2005). In the so called “MeningitisBelt” every year MCM epidemics occur in the dry period, probably due to the reduced respiratoryimmunity of human beings. Malaria is highly sensitive to global warming and associatedchanges in precipitation and rainfall (Martens et al., 1997). With regard to MCM, climate variabilityis linked to the life cycle of its causative agent (e.g. Besancenot et al., 1997) and MCMincidence is therefore likely to be affected by future environmental changes.Because of the linkage between climate and malaria, as well as the MCM disease, the globalscientific community is faced with the task of assessing the impacts of global change on thesediseases. The aim of the study is therefore the detection of changes in the geographical distribution,seasonality (interannual variability), and in the prevalence. In a first step, for the past climatethe spatial and seasonal distributions of the malaria and MCM diseases were analysed particularalong the north-south transect at about 2°E. In the case of MCM, special weather conditionsand meningitis cases will be correlated in order to find a close connection between weatherand the disease. Unfortunately, the collection of weekly MCM data was hitherto not sufficient toapply the statistical correlation methods. However an adequate sample size will be available atthe beginning of the 3rd IMPETUS phase. In order to assess the occurrence of malaria the socalled“Liverpool Malaria Model (LMM)” is applied and enables the simulation of the malariaprevalence on the basis of daily-mean temperatures, as well as daily accumulated precipitation.As a start, the sensitivity of the malaria model with regard to temperature and precipitation wastested at 10 locations in Benin, Niger and Mali along a north-south transect at about 2°E.The first LMM results show, that the simulation of malaria is fairly sensitive to the parametersetting of the LMM. For example the mosquito survival scheme is a key parameterization in themodel. The original LMM setting consists of a scheme in which the survival probability decreasessharply at daily-mean temperatures higher than 25 o C. That leads to low or even no malariatransmission simulated in Niger north of Niamey (13 o 29’N, 2 o 10’E). However, in reality adefinite malaria season south of Agadez/Niger (16 o 58’N, 7 o 59’E) is observed (Stafford Smith,1981). Another survival scheme is given by Martens (1997) which shows nearly constant survivalprobability between temperatures of about 15 to 30 o C, but leads to a too long transmission.
Subproject A5 IMPETUS 185The nearly constant survival probability between temperatures of about 15 to 30 o C is supportedby the laboratory study of Bayoh (2001). However, mortality rates are much higher in real worldthan in the laboratory (Clements and Paterson, 1981). In order to reduce the survival probabilitiesa set-off (called Bayoh-12.5% survival scheme) was introduced and shows encouraging results:Malaria transmission season is as long as depicted by maps from the Mapping MalariaRisk in Africa project (MARA; cf. Craig et al., 1999) and malaria is prevalent in Tilabery(14 o 12’N,1 o 27’E) whereas an epidemic occurrence is simulated in Gao (16 o 16’N, 0 o 03’W).Using the new survival scheme, simulations were carried out on the basis of the transect stationdata (1980-2004) as well as the REMO data (1979-2003). The LMM output shows in general adecrease in the malaria incidence and for the duration of the malaria season from the south to thenorth of West Africa. The modelled mosquito population is clearly related to rainfall of the WestAfrican summer monsoon. At the northernmost transect stations, in Tilabery and Gao, malariaseason lasts only several weeks and occurs epidemically, respectively. This fact is also shown bythe two-dimensional simulations: For the whole of West Africa malaria prevalence varies interannualnorth of about 15 o N. A strip of about 2 to 3 latitudes displays high values of the standarddeviation of the yearly maximum prevalence.For the assessment of modifications in the malaria risk, that result from a modified climate,REMO output from time slice experiments covering the years of 2000, 2005, 2010, 2015, 2020,and 2025 was utilised. Due to changes in precipitation, the distribution of malaria of the year2025 is different in comparison to that of the year 2000. Rainfall declines in the Sahelian zoneand consequently, malaria transmission is primarily reduced in that semi-arid zone. In the regionof the Upper Ouémé Valley (UOV) rainfall is unchanged thus, not altering the spreading of themalaria parasite significantly. In a next step, the data from transient scenario-runs will be used inorder to get more meaningful results.Abreviations:DBP disinfection by-productsDED Deutscher EntwicklungsdienstHELVETAS Schweizer Gesellschaft für internationale ZusammenarbeitISDSS IMPETUS Spatial Decision Support SystemLASDEL Laboratoire d'Etudes et de Recherches sur les Dynamiques Sociales et le Développementlocal“LMM Liverpool Malaria ModelMARA Mapping Malaria Risk in Africa projectMCM Malaria and the meningococcal meningitisMLST Multilocus sequence typingPADEAR Projet d´Assistance au Développement du Secteur d´Alimentation en Eau Potableet de l´Assainissement en Milieu RuralREMO Regionales KlimamodellSDSS Spatial Decision Support SystemSPSS Statistical Package for the Social SciencesSRH Service Regional de l’HydrauliqueUOV Upper Ouémé Valley
186IMPETUS Subproject A5LiteratureBayoh, M. N., (2001): Studies on the development and survival of Anopheles gambiae sensu stricto at various temperatures andrelative humidities. PhD thesis, University of Durham.Besancenot, J. P., M. Boko, and P. C. Oke, (1997): Weather conditions and cerebrospinal meningitis in Benin (Gulf of Guinea,West Africa). European Journal of Epidemiology, 13, 807-815.Clements, A. N., and G. D. Paterson, (1981): The analysis of mortality and survival rates in wild populations of mosquitoes. TheJournal of Applied Ecology, 18, 373-399.Craig, M. H., R. W. Snow und D. le Sueur, (1999): A Climate-based Distribution Model of Malaria Transmission in Sub-SaharanAfrica. Parasitology Today, 15, 105-111.De Savigny, D., and F. Binka. (2004): Monitoring future impact on malaria burden in sub-Saharan Africa. American Journal ofTropical Medicine and Hygiene, 71 (Suppl. 2), 224-231.Dittmann, S., (2004): Meningokokken-Erkrankungen. Deutsche Medizinische Wochenzeitschrift, 129, 2666-2671.Godfrey, S., F. Timo and M. Smith (2005). Relationship between rainfall and microbiological contamination of shallow groundwaterin Northern Mozambique. In: Water SA 31: 609-614.Greenwood, B., and T. Mutabingwa, (2002): Malaria in 2002. Nature, 415, 670-672.Martens, W. J. M., (1997): Health Impacts of Climate Change and Ozone Depletion: an Eco- epidemiological Modelling Approach.Maastricht University.Martens, W. J. M., T. H. Jetten, and D. A. Focks, (1997): Sensitivity of Malaria, Schistomiasis and Dengue to Global Warming.Climatic Change, 35, 145-156.Stafford Smith, D. M., (1981): Mosquito records from the Republic of Niger, with reference to the construction of the new’Trans-Sahara Highway’. Journal of Tropical Medicine and Hygiene, 84, 95-100.Sultan Benjamin, Labadi K., Guégan J., Janicot S., (2005): Climate Drives the Meningitis Epidemics Onset in West Africa. PLoSMedicine, 2(1):e6Verheyen J., J. Rissland, A. Kos, S. Sen, A. Uesbeck and H. Pfister (2005). Challenges in determing the virological water qualityin Benin, West Africa; Annual meeting Gesellschaft für Virologie, Hannover.Verheyen J, I. Boussaad, S. Sen, A. Kos, A. Uesbeck, J. Rissland and H. Pfister (2006). Viral water quality in the Upper Ouémévalley of benin, West Africa. Annual meeting Gesellschaft für Virologie, München.WHO (diarrhoea). .WHO (2004). .WHO (1997): World malaria situation in 1994. Weekly Epidemiological Record, 72, 269-276.
Part B IMPETUS 187Projektbereich BDie Wasserbilanz des Drâa-Ein<strong>zu</strong>gsgebietesund sozioökonomische ImplikationenPart BWater-balance of the Drâa-catchment areaand socio-economic implications
Subproject AB1 IMPETUS 189Teilprojekt AB1Externe Klima-Antriebsszenarien auf der globalen und kontinentalen SkalaExternal climate forcing scenarios on the global to continental scaleAntragsteller / ParticipantsProf. Dr. P. Speth (Koordinator)Institut für Geophysik und Meteorologie,Universität <strong>zu</strong> KölnProf. Dr. A. HenseMeteorologisches Institut, Universität BonnDr. M. LatifMax-Planck-Institut für Meteorologie, HamburgProf. Dr. C. SimmerMeteorologisches Institut, Universität BonnFach / DisciplineMeteorologie:Klimamodellvalidierung und KlimadynamikMeteorology:climate modelling evaluation andclimate dynamicsMeteorologie:Großskalige Klimamodellierungund RegionalisierungMeteorology:large-scale climate modelling andregionalisationMeteorologie:Großskalige KlimamodellierungMeteorology:large-scale climate modellingMeteorologie:Mesoskalige Modellierung undFernerkundungMeteorology:meso-scale modelling and remotesensingZusammenfassungDas Teilprojekt AB1 umfasst Arbeiten im Bereich der Meteorologie, deren Ergebnisse übergreifendfür die Teilprojekte in Marokko und Benin relevant sind. Die Arbeitsbereiche unterteilensich in globale Klimamodellierung mit ECHAM (AB1-1), regionale (synoptisch-skalige, kontinentweite)Klimamodellierung mit REMO (AB1-2) und Niederschlagsmonitoring mit Hilfe dersatellitengestützten Fernerkundung (AB1-3). Die in IMPETUS verwirklichte Modellkette - startendauf der globalen Skala mit ECHAM bis hin <strong>zu</strong>r lokalen Skala (FOOT3DK) - hat den Vorteil,durch (statistisch) dynamisches „Downscaling“ alle relevanten Skalenwechselwirkungen <strong>zu</strong> erfassen.Da dem globalen Modell ECHAM als oberstes Glied der Kette eine entscheidende Rollefür den Antrieb von Klimaänderungen <strong>zu</strong>kommt, werden die relevanten Wechselwirkungen bereitshier möglichst exakt berücksichtigt: Zunächst wurde das verwendete globale Atmosphärenzirkulations-ModellECHAM in seiner neuesten Generation an ein optimiertes Vegetationsmodellgekoppelt. Weiterhin ist ein globaler Aerosol-Datensatz implementiert, der eine realistischeAerosolkonzentration für ein <strong>zu</strong>künftiges Klima berücksichtigt. Die Ergebnisse analysierter Klimaläufe,die mit beobachteten Meeresoberflächen-Temperaturen und See-Eis Konzentration
190IMPETUS Subproject AB1angetrieben wurden, zeigen trotz einer <strong>zu</strong>r Originalversion reduzierten horizontalen Auflösung(T63 -> T42) eine deutliche Verbesserung in der Wiedergabe beobachteter Niederschlagsmuster.Bekannte Korrelationen zwischen gefallenem Niederschlag und beobachteter Meerestemperaturwerden ebenso wiedergegeben, wie auch die räumliche Niederschlagsvariabilität. Die globalenKlimasimulationen mit ECHAM wurden in einem Ensemble-Modus durchgeführt. In der regionalenKlimamodellierung mit REMO ist es gelungen, Eigenschaften der Monsunzirkulation detailgetreuerund realistischer ab<strong>zu</strong>bilden, als es in den bisherigen Regionalklimamodellierungenmöglich war. Insbesondere konnten die in der Zukunft erwarteten anthropogenen Änderungender Landoberfläche berücksichtigt werden. Auch die transienten regionalen Klimamodellierungenwurden im Ensemble-Modus für den Zeitraum 1960-2000 und für die IPCC SRES-SzenarienA1B und B1 des Zeitraumes 2000-2050 gerechnet. Mit Hilfe dieser Klimaprognosen ist eine Abschät<strong>zu</strong>ngder modellinternen Variabilität (die <strong>zu</strong>mindest mit der natürlichen Klimavariabilitätverknüpft ist) und der Unsicherheit durch den Antrieb auf regionaler Skala möglich. Mit Hilfeder Fernerkundung von Satelliten konnten in den Tropen Westafrikas raum-zeitlich hochauflösendeNiederschlagsklimatologien für die Jahre 2002-2005 erstellt werden. Die Methodik wurdefür den Einsatz im laufenden Niederschlagsmonitoring entwickelt, das die Grundlage für einNiederschlags-Informationssystem in der dritten Phase von IMPETUS bildet. Ein äußerst wertvollesNebenprodukt der Validierungsarbeiten für diese Daten war die Erstellung von Niederschlagsklimatologienfür den Zeitraum 1921-2004, welche durch eine einmalige Zusammenarbeitzwischen EUMETSAT, dem AMMA-Projekt, dem beninischen Wetterdienst DMN undIMPETUS auf der Basis einer extrem umfangreichen Datenbasis möglich war. Die Niederschlagsklimatologiensind u. a. <strong>zu</strong>r Modellevaluierung von unschätzbarem Wert.SummarySubproject AB1 contains progress in atmospheric science which is relevant for both areas ofinvestigation: Benin and Morocco. The work area is divided in three parts: global climate modellingusing the ECHAM model (AB1-1), regional (synoptic-scale, continent-wide) climate modellingusing REMO and rainfall monitoring using satellite based remote sensing. The model hierarchyin IMPETUS – from the global scale (ECHAM) to the local scale (FOOT3DK) – has theadvantage of capturing scale interactions by the application of dynamical-statistical downscalingtechniques. Since the global model ECHAM plays an outstanding role in describing theforcing of climatic change, relevant forcing and feedback mechanisms are realized in thatmodel: First, the global circulation model ECHAM has been coupled to an improved vegetationmodel. Secondly, a global aerosol emission data set has been implemented in order to representaerosol concentration also for future climates in a more realistic way. Control simulations of thepresent day climate driven by observed SST and sea-ice cover reveal an improvement of representingpatterns of rainfall variability in tropical Africa, although the grid resolution of ECHAMhas been reduced from T63 to T42. Observed teleconnection patterns between SST and rainfallin tropical Africa are represented sufficiently as well as spatial patterns of rainfall variability.Global climate simulations with ECHAM have been carried out in an ensemble mode. Concerningthe regional climate modelling with REMO, the Monsoonal circulation over West Africacould be simulated in a more realistic and more detailed way compared with former attempts ofregional climate modelling over West Africa. Particularly, anthropogenic land cover changes
Subproject AB1 IMPETUS 191could be included into future climate scenarios for Northern and Tropical Africa. Transient regionalclimate simulations have been undertaken in an ensemble mode with REMO for the period1960-2000 and for the IPCC SRES scenarios A1B and B1 for the period 2000-2050. Usingthese climate simulations, an analysis of model related variability (at least somewhat comparableto natural variability) and uncertainty imposed by the regional scale forcing of future climatescenarios is possible. The progress in the application of new techniques in satellite based remotesensing of rainfall in tropical West Africa allowed to compute very high resolution rainfall patternsin both space and time for the years 2002 to 2005. The rainfall detection techniques weredeveloped for the application in rainfall monitoring, which will be the basis of a rainfall informationsystem in the third phase of IMPETUS. A very valuable and helpful by-product of thevalidation is a new precipitation climatology for the period 1921-2004, which is based on anextensive data base made possible by a unique cooperation between EUMETSAT, the AMMAproject, the weather service of Benin (DMN) and IMPETUS. These rainfall climatologies are ofvery high value for the evaluation of atmospheric model data.For details please confer Part A, Subproject AB1, page 69
Subproject B1 IMPETUS 193Teilprojekt B1Regionale und lokale Szenarien der raum-zeitlichen Variabilitätvon Niederschlag und Verdunstung in MarokkoRegional and local scenarios of the spatio-temporal variabilityof precipitation and evaporation in MoroccoAntragsteller / ParticipantsProf. Dr. P. Speth (Koordinator)Institut für Geophysik und Meteorologie,Universität <strong>zu</strong> KölnProf. Dr. M. KerschgensInstitut für Geophysik und Meteorologie,Universität <strong>zu</strong> KölnProf. Dr. C. SimmerMeteorologisches Institut, Universität BonnFach / DisciplineMeteorologie:Klimamodellvalidierung und KlimadynamikMeteorology:climate modelling evaluation andclimate dynamicsMeteorologie:Kleinskalige ModellierungMeteorology:small-scale modellingMeteorologie:Mesoskalige ModellierungMeteorology:meso-scale modellingZusammenfassungDie in B1 durchgeführten Arbeiten in der 2. Phase lassen sich im Wesentlichen in zwei Schwerpunktsbereichegliedern:- Tropische und extratropische Antriebe der Niederschlagsvariabilität in einem <strong>zu</strong>künftigen Klimain Marokko,- Berechnung einer Niederschlags- und Verdunstungsklimatologie für das mittlere Drâa-Talunter geänderten Klimabedingungen.Mit Hilfe des Lokal-Modells (LM) des Deutschen Wetterdienstes (DWD) wurde das Jahr 2002nachsimuliert, um dem nachfolgenden Modell FOOT3DK Episoden <strong>zu</strong>r statistisch-dynamischenRegionalisierung <strong>zu</strong>r Verfügung <strong>zu</strong> stellen. Ergebnisse der Regionalklima-Modellierung wurdenqualitativ validiert, indem sie mit den modellierten Vegetationsverteilungen aus B3 verglichenwurden. Ein Werkzeug <strong>zu</strong>r Weiterverarbeitung meteorologischer Daten vor allem in der hydrologischenModellierung wurde entwickelt.Für zwei verschiedene Klimasimulationen mit zwei verschiedenen globalen Klimamodellen wurdemittels der Methode der statistisch-dynamischen Regionalisierung der Einfluss der Klimaänderungauf den Niederschlag und die Verdunstung für das südliche Drâa-Tal untersucht. DieErgebnisse der Regionalisierung wurden mit dem direkten Modellniederschlag der jeweiligenKlimamodelle verglichen. Dabei ergibt sich im Unterschied <strong>zu</strong>m direkt mit den globalen Model-
194IMPETUS Subproject B1len simulierten Niederschlag eine leichte Niederschlags<strong>zu</strong>nahme aus der Auswertung der statistisch-dynamischenRegionalisierung. Diese resultiert aus der höheren horizontalen Auflösungder Modells FOOT3DK im Vergleich <strong>zu</strong> den globalen Modellen, die es ermöglicht, niederschlagsbringendeProzesse besser auf<strong>zu</strong>lösen. Besonders die Begren<strong>zu</strong>ng des Einflusses von Zyklonenim Mittelmeerraum und Südeuropa auf den Niederschlag in Südmarokko und die Hebungam Südhang des Atlas Gebirges können aufgrund ihrer Skala in globalen Modellen mit gröbererAuflösung nicht erfasst werden, sind jedoch von wesentlicher Bedeutung für das Niederschlagsaufkommenin der Region.SummaryThe investigations in B1 carried out during the second phase of IMPETUS can be separated intotwo parts:- Tropical and extra-tropical forcing of rainfall variability in Morocco in a future climate- Calculation of a precipitation- and evaporation-climatology for the Middle Drâa in a futureclimateUsing the “Lokal-Modell” (LM) of the German Weather Service DWD the year 2002 was simulatedin order to provide episodes for the statistico-dynamical downscaling with FOOT3DK.Results of regional climate modelling have been evaluated qualitatively by comparison of modelledvegetation distributions provided by B3. A tool for the further processing of meteorologicaldata especially for hydrological modelling has been developed.The impact of climate change on precipitation an evaporation of the Middle Drâa region wasexamined using two different climate simulations with two different global climate models(GCMs) for regional statistico-dynamical downscaling. The results of the statistico-dynamicaldownscaling were compared directly with the GCM output. In opposition to the GCM simulations,a slight increase in rainfall can be seen in the results of the regionalization. This resultsfrom the higher grid resolution of FOOT3DK, which enables the model to resolve rainfallbearingevents better. Especially the limitation of the influence of Mediterranean cyclones onprecipitation in southern Morocco and the orographic lifting at the southern slope of the AtlasMountains cannot be represented correctly by the coarse resolution GCMs, but are importantfor the rainfall variability in the Middle Drâa region.
Subproject B1 IMPETUS 195Workpackage B1-1: Tropical and extra-tropical forcing of rainfall variability in Moroccoin a future climateProblemFor applications in hydrological modelling, rainfall patterns should be of a very high resolutionin order to represent orographic effects. Global climate models are not able to resolve the Drâaregion sufficiently. One challenge of the climate modelling in the region south of the High AtlasMountains is the evaluation of the model results, because only sparse observations over periodsof sufficient duration exist. Processes causing interannual rainfall variability could be elucidatedin sensitivity studies of selected rainfall-bearing events. The transport of warm and humid airfrom lower latitudes connected with a south western flow in front of a very large trough off theNorthwest-African shore turned out to be a very important mechanism. One aim was to providedata for the nesting of FOOT3DK in the “Lokal-Modell” (LM) region in order to construct climatescenarios via recombination of characteristic episodes. Another goal is the preparation ofatmospheric data from the applied models for applications in hydrology.Work in the second phaseThe work regarding to the LM applications is separated in three parts. Some aspects of the plansin 2003 had to be thought over and slightly changed. In the first part, one year with observationsof IMPETUS stations was simulated in different ways in order to proof the ability of the LM tosimulate long time periods. In the second part, a rough validation of climate model data has beenundertaken, where REMO and LM data have been used. In the third part, an interpolation andaggregation tool was build up, because the original model output did not fit the demands of subsequentmodels. The third part is of major importance for the future application of meteorologicaldata in problem clusters. The LM data will be provided to the problem cluster MA-H.4 (WaterManagement and interannual rainfall variability), MA-H.3 (Run-off from snowmelt) andMA-L.3 (Extreme rainfall events).In a first step, the capability of the LM to compute regional climate in long-term runs was tested.The time period Nov 2001-Dec 2002 was simulated using the LM in short-term forecast mode,in a first constellation (CONTROL) starting every day with a new model initialization, forcedwith 6-hourly GME analysis data. In a second run, only the lateral boundary data were prescribedfrom the GME analyses and the LM was run over the whole period of 14 months(SCEN). An example for some collected meteorological parameters is shown in Fig. B1-1. Theoverview shown here (March, 2002) contains an episode of heavy rainfall starting on Mar 28 th ,which was caused by a strong south western flow with humid air stemming from a region overthe tropical Atlantic. This episode has been examined extensively (Huebener et al., 2006).In both cases, a sufficient regional climate data base could be produced. IMPETUS climate stationdata (subproject B2) as well as satellite observations (subproject AB1) permitted the evaluationof the model results. Major differences can be seen especially in soil-moisture related fieldslike near surface temperatures and moisture. The daily initialized simulation tends to somewhatsmaller rainfall rates than the continuous run, hinting to an underestimate of atmospheric moisturein the analysis data. A more detailed examination of the modelled climate was undertaken
196IMPETUS Subproject B1by clustering the data using Self Organizing Maps (SOM). The trajectories of the clusters’ centresof gravity represent climate variability. This has been complemented by classical climateanalysis of vegetation related atmospheric parameters.Fig. B1-1:An overview over the LM simulation for one month, March 2002. Upper row from left to right:2m-Temperatures in °C: Average, standard deviation, mean daily minimum and mean dailymaximum temperature. Second row left: mean deviation of 2m-temperatures from mean dailycycle and accumulated precipitation. Second row right: maximum vs. minimum 2m-temperature,colours denote heights of the grid points. Third row: Monthly rainfall vs. height (left) and 2mtemperaturevs. height. Fourth row, left 2 panels: Total rainfall in mm (left) and maximum rainfallrate in mm/h (right). Fourth row, right 2 panels: same, but zoomed in the Drâa region.Scenarios of wetter than normal years constructed by recombination of rainfall events show therole of extra tropical-tropical interactions. By increasing the amount of rainfall events connectedwith conveyor belts originating in tropical areas, the southern part of the Drâa catchment showsincreased rainfall rates of up to 30%. The effect on precipitation in the plane of Ouarzazate(10%) and the High Atlas is much smaller since the total rainfall sum is relatively large. On theother hand, recombining a scenario with enhanced extra tropical synoptic activity, the impact on
Subproject B1 IMPETUS 197rainfall south of the High Atlas is below any statistical significance. In the High Atlas, the snowline in April sinks by about 200 m, leading to a substantially increased snow covered area.LM simulation data were implemented especially to statistical vegetation models in B3. Scenariosof changes in runoff and freshwater availability computed with a hydrological model (MMS)in B2 are triggered by rainfall and evaporation interpolated on the hydrological response units ofthe hydrological model.In order to use the LM data for the MMS, an interface between the models had to be defined. Aninterpolation and aggregation tool was developed to extract the forcing data for hydrologicalmodelling in subproject B2. For that purpose, the data were interpolated with a height correctionon a 1km-grid within the area of interest (Fig. B1-2), in a second step the average for each of thesub catchments was calculated. In principle, this interpolation and aggregation tool can be appliedon any model data. In our case, the qualitative validation of REMO data with respect tovegetation-relevant parameters is shown.Fig. B1-2:Sub catchments of the hydrological model area inB2 for the plane of Ouarzazate and the High Atlas.For each sub catchment, an averaged value of relevantparameters (T, rainfall, radiation, wind) is calculated.The REMO data have been chosen, because they permitted the use of transient data. A recombinationof LM data in order to develop higher resolution transient data has not been undertaken,since this should be done with FOOT3DK. Fig. B1-3 shows the temporal evolution of rainfalland temperatures for the model domain of the hydrological model depicted in Fig. B1-2.
198IMPETUS Subproject B1Fig. B1- 3:9-year filtered data of rainfall (mm/a, left) and temperatures (K, right) with standard deviation fromREMO for the 1961-2000 period and for the 2000-2050 A1B and B1 scenario, for the region of hydrologicalmodelling (Fig. B1-2).One can see that the decrease in rainfall is about 10-20% of the mean value, while the 2mtemperaturerises by about 1.5K, which means a rise of the snowline by about 250 m. But thesedata can hardly be evaluated or validated, because the INPETUS observations cover only thetime after the year 2000 and are located at sometimes very exposed places, which can not becompared easily to a regional climate model with 0.5° grid spacing. In order to enable at least aqualitative, exhaustive comparison, vegetation data from B3 have been used to evaluate the“climate state”. The Emberger-parameter (Emberger, 1942), which describes the climatic stresson a plant from annual precipitation, mean temperature and the difference of the annual monthlymaximum temperature and minimum temperature – in order to estimate the effect of evaporationat least qualitatively – has been calculated from REMO data and compared to actual vegetationobtained from a combination of observations and a statistical vegetation model (Fig. B1-4).One result of this comparison was that the REMO model forced with ERA/ECMWF analysesseemed to produce a moderate mediterranean climate in the plane of Ouarzazate, whereas thevegetation model shows a region of low index values near Ouarzazate, which means that we expectmore desert-like vegetation in this area. The new REMO simulations with forcing fromECHAM5 (applied as coupled ocean-atmosphere GCM) for the period 1961-2000 showed a distinctimprovement, but still does not represent the attributes of the observation completely. Areason for the overestimation of rainfall might be found in the improper representation of theHigh Atlas Mountains in REMO, which leads to higher than observed precipitation values southof the mountain ridge. A comparison with the LM precipitation (Fig. B1-5) promises better results:Filtering the data by means of an EOF analysis produces a pattern, which has been almostcleared by random effects but keeps the influence of the stationary, orographic-related patterns.A stochastic modelling of the EOF loadings is tested, but up to now the development is not finishedyet. This technique will be further developed in order to provide high resolution modeldata to the problem clusters PK MA-H.4 and PK MA-L.3.
Subproject B1 IMPETUS 199Fig. B1-4:The Emberger-Index calculated from REMO values for the 1979-2003 period (forcingERA/ECMWF analyses, left) and the 1961-2000 period (forcing ECHAM5).Bottom: Vegetation zones from modelling (M. Finkh and J. Oldeland, B3)Fig. B1-5:Data reduction by omitting the random part of rainfall patterns by means of an EOF analysiswith subsequent reconstruction of the deterministic signal using only statistically significant EOFpatterns. Left: reconstructed annual rainfall, right: examples of the first eight EOF patterns.Workpackage B1-2: Changes in local precipitation- and evaporation-patterns in the MiddleDrâa regionProblemPrecipitation and evaporation in the area of the middle Drâa valley, as it was calculated byFOOT3DK, has been examined in detail. Using single years, the resistance of the obtained resultsagainst small changes in the classification of circulation weather types has been studied.Since only few transpiration measurements were available, the validation had to be focussed on
200IMPETUS Subproject B1precipitation. For two climate simulations obtained with different global climate models, theimpact of climate change on precipitation and evaporation in the Middle Drâa Valley, as it couldbe obtained with the recombination technique, has been studied. The results of the regionalisationhave been compared directly with the large scale model rainfall. Different from GCM simulations,a slight increase of precipitation can be seen in the regionalized data. This result seems tobe caused by the higher spatial resolution of FOOT3DK compared to global models, which enablesthe model to resolve rainfall-bearing processes in a better way. Especially the limited influenceof Mediterranean and southern European cyclones on the rainfall south of the High Atlasand the orographic lifting in cases of south western flow could not be represented with globalscale models due to their coarse resolution. These events are relative important for the rainfallpatterns in the Drâa catchment.Work in the second phaseThe connection between sea level pressure (SLP) fields and precipitation of three climate stations(Ouarzazate, Errachidia and Bechar) has been examined with a classification of circulationweather types (CWT). The SLP was taken from NCEP reanalysis data for the period 1958-1997.The results are depicted in Fig. B1-6.(a)(b)(c)(d)Fig. B1-6: (a) Monthly mean frequencies of CWTs in % for the point 30°N/5°W for the time period 1958-1997 from NCEP reanalysis data. (b-d) Monthly mean rainfall sum (mm) for each CWT for 1978-1998 for Oarzazate (b), Errachidia (c) and Bechar (d).The climatological annual cycle of CWTs shows occurrencies
Subproject B1 IMPETUS 201Two climate scenarios were examined with respect to their impact on precipitation in southernMorocco. The climate scenarios were taken from the SRES IS92a scenario obtained withECHAM/OPYC3 (called here EH4) and from SRES A1B scenarios provided by ECHAM5/MPI-OM1 (EH5). From both simulations, the period 1960-1989 has been used as control period and2060-2089 as scenario period. Resulting mean monthly probabilities of occurrence of circulationweather types (CWT) for the two scenarios are shown in Fig. B1-7.Fig. B1-7:Mean monthly occurrences of the CWT in % fort he grid point 30°N, 5°W from EH4 (top)and EH5 (bottom), each fort he control period 1960-89 (left panels) and for the scenarios2060-2089 (right panels).First, all four distribution show a large agreement and differ from the CWT distribution obtainedfrom NCEP data (1958-1997) substantially (Huebener and Kerschgens, 2005a and 2005b). Thecyclonic class C (gray) occurs too often in the summer months. While this class for the NCEPreanalyses only shows frequencies of less than 10%, EH4 and EH5 produces noteworthy largerfrequencies of the C-class. The anticyclonic class A (green) is detected for every month in theNCEP reanalysis, EH4 and EH5 show this class only in winter time. A systematic shift fromnorth-easterly (NE, light yellow) to easterly (E, yellow) wind directions can also be seen. Thesouth-easterly (SE, orange) class of the wind direction occurs too often in EH4 and EH5 comparedto NCEP reanalysis data. The shift of NE classes to E has no impact on the precipitation inthe region: Both CWTs are not significantly connected to precipitation in Ouarzazate. Due to thesimilarity of the related synoptic situation the E and NE classes are treated as one class for thestatistical-dynamical regionalization. The systematic differences for the other CWT classes havesignificant influence on the rainfall in the Drâa region. The cyclonic CWT is significantly correlatedwith precipitation in Ouarzazate; the correlation in winter is stronger than in summer. Duringsummer, the cyclonic CWT contains dominantly warm lows over the Sahara, which is notconnected to rainfall. The anticyclonic CWT is significantly anti-correlated with the precipitationin the Drâa region.The comparison of the future periods with the control periods shows that the shift of CWT classesis systematic fort he control- and for the scenario periods. In order to exclude this systematic
202IMPETUS Subproject B1bias from analysis only the trend of the model data, i.e. the difference between scenario and controlperiod, has been interpreted. This includes the assumption that climate trends are correctlyrepresented by the models, even if the present climate is not matched perfectly. The temporaltrends of monthly mean frequencies of the CWT are shown in Fig. B1-8.Fig. B1-8:Trends of the mean monthly CWT frequencies between scenario and control period for EH4 (left)and EH5 (right).The EH4 climate trend (Fig. B1-8, left) clearly shows an increased frequency of the SE CWTbetween November and April. Although some months show a negative trend, it sums up to anincrease of 3.3%. If the trend is combined with S and SW CWTs, all three CWTs show a positivetrend of 2% for the whole year. Because these CWTs are positively correlated with rainfall, an increase of annual rainfall is expected for the IS92a scenario. During October-April, we find negativetendencies of the A CWT. Because The A CWT is negatively correlated with rainfall in theregion, also this reduction leads to an increase of the annual rainfall. The more frequent occurrenceof the cyclonic C class in summer (May-September) leads to an overestimate of the rainfallwith this method, because this class is positively correlated with rainfall, but only in winter. Becausethe recombination is carried out for the whole year and we have not enough representantsto form an annual cycle, the number of rainy days is supposedly overestimated.The EH5 climate trend (Fig. B1-8, right) shows qualitatively similar structures like the EH4trend. Nevertheless, changes in the EH5 trend are weaker. The group of southern CWTs (S, SE,SW) shows a positive trend of 1.4 % for the whole year. The increase of the C class frequencyduring summer is weaker for EH5 than for EH4. The above mentioned overestimate of rainfall issmaller.In a next step, the calculated trends have been added to the climatic NCEP CWT classes, theresults are shown in Fig. B1-9.The recombination of rainfall patterns in the statistic-dynamic regionalization calculates for theNCEP climatology plus EH4 climate trend a mean annual rainfall of 38.4 mm for the model area,compared to 31.9 mm for the NCEP-based climatology. This means an increase of about 20%.Addition of the EH5 climate trend leads to an area mean rainfall of 34.4 mm; that is an increaseof about 8%. The resulting difference of rainfall between the NCEP climatology andNCEP+EH4/5 trends is shown in Fig. B1-10.
Subproject B1 IMPETUS 203Fig. B1-9:Mean monthly CWT frequencies and for climate scenarios EH4 (left) and EH5(right) obtained from combining the NCEP-based classification and EH4/5 trends.Fig. B1-10: Difference of the climatic mean of the annual rainfall, obtained fromstatistical-dynamical downscaling: NCEP + EH4 trends (left) and NCEP+ EH5 trends (right) minus NCEP climatology.Both EH4 and EH5 trends produce an increase of annual rainfall in the model domain. The increaseis stronger for the EH4 trend than for the EH5 trend. The spatial patterns of the increaseare similar: the changes in rainfall amounts in the southerly part of the area are relatively small,but in the northern part stronger trends can be seen. Especially at the slopes in the Ati-atlas regionstrong maxima of rainfall changes occur.The results shown above are interesting, because they differ from rainfall obtained from globalclimate models. In order to discuss the disparities, Fig. B1-11 shows the modelled rainfall fromEH4 and EH5 for the simulated periods.EH4 produces unrealistic high rainfall amounts throughout large parts of the Sahara. Over theAtlas Mountains a distinct maximum is located. The rainfall value of the maximum is not unrealistic(~300 to 400 mm, compared to up to 1200 mm observed annual rainfall at single stations inthe High Mountain regions), but it is too expanded and reaches too far into the desert area. Thestrong NW-SE gradient of rainfall at the southerly slope of the Atlas Mountains is too weak. Inthe southerly parts of the Sahara, monsoonal rainfall penetrates too far into the northerly Sahel.In the scenario, the maxima are even amplified. For the position of the FOOT3DK region in themiddle Drâa EH4 would predict an increase in annual rainfall of about 25 mm.
204IMPETUS Subproject B1The pattern of annual rainfall from EH5 is somewhat more realistic, especially it does not tend tooverestimate Saharan rainfall. The maximum of EH$ in the Atlas region can not be found, insteada continuous decrease of rainfall from Gibraltar to the Sahara is simulated. The area affectedby monsoonal rainfall in the southerly Sahara and Sahel is reduced. The scenario periodshows a stronger N-S gradient in the Atlas region. Comparison with the control period showsthat a decrease of rainfall is predicted for the whole Mediterranean and Southern Europe. In themodel area of FOOT3DK, a decrease of about 25 mm for the annual rainfall is expected.The evaluation of the global climate simulations EH4 and EH5 gives a hint that the impact of theAtlas Mountains as a storm breaking area is underestimated by the global climate models. This iscertainly a consequence of the coarse resolution. For the precipitation in the Drâa region, theHigh Mountains play a central role with respect to the rainfall. The mountain ridge prevents theadvection of moist air from Northwest and decouples rainfall at the southerly slope of the AtlasMountains largely from extra tropical cyclonic and frontal systems. At the same time, the mountainridge acts as a barrier, where air masses coming from south are forced to raise. If the air isunstable, convection and precipitation occurs. These processes can only be simulated in a realisticway if the model resolution is very high. The disparities of the results between EH4 and EH5simulations and the statistical-dynamical downscaling can be interpreted consistently and makesphysically sense. The small scale model used for estimating rainfall in CWT-representing epiabcdefFig. B1-11: Simulated precipitation from EH4 (left) and EH5 (right) for the control period (top),the scenario period (middle) and the difference scenario minus control. Isolines aredrawn every 100 mm in the upper to rows and 25 mm for the differences.
Subproject B1 IMPETUS 205sodes puts additional information about the local characteristics of the area to the GCM information,which can not be determined by the large scale models alone. It has to be kept in mind thatthe increase in rainfall in general results from an increase of temperature and, thus, from an increasein specific humidity of the air. This effect has not been taken into consideration by thestatistical-dynamical downscaling, so that the increase in rainfall might be stronger than shownhere.The evaporation (no figure) also shows an increase for the climate scenarios EH4 and EH5.Compared to the evaporation of the NCEP climatology, the amount of evaporation is increasedby the value of rainfall increase. This has to be expected, since the soil water is not treated differentlyup to now and the local water cycle has to balance the additional input of water. Impactsof changing subsurface water content, of irrigation and other anthropogenic factors have to becalculated.With respect to the above discussed climate changes, it has to be pointed out that the effect ofincreased air temperature due to the GHG effect and increased specific humidity is not build ininto the simulations. Therefore, the results should be interpreted only qualitatively, not quantitatively.LiteratureHuebener, H., Born, K. and M. Kerschgens: Downscaling heavy rainfall in the subtropics – Challenges and limits, submitted toAdvances in Geophysical Research.Emberger, L. 1942. Un projet d'une classification des climats du point de vue phytogéographique. Bull. Soc. Hist. Nat. Toulouse77: 97-124.Huebener, H.; Kerschgens, M., 2005: Downscaling of current and future rainfall climatologies for southern Morocco. Part I:Downscaling method and current climatology. Int. J. Climatology (submitted)Huebener, H.; Kerschgens, M., 2005: Downscaling of current and future rainfall climatologies for southern Morocco. Part II:Climate change signals. Int. J. Climatology (submitted)
Subproject B2 IMPETUS 207Teilprojekt B2Wasserverfügbarkeit und BodendegradationWater availability and soil degradationAntragsteller / ParticipantsProf. Dr. B. Diekkrüger (Koordinator)Geographisches Institut, Universität BonnProf. Dr. B. Reichert,Geologisches Institut, Universität BonnProf. Dr. J. TheinGeologisches Institut, Universität BonnProf. Dr. M. Winiger,Geographisches Institut, Universität BonnFach / DisciplineHydrologie, BodenkundeHydrology, Soil scienceHydrogeologie, HydrogeochemieHydrogeology, HydrogeochemistryGeologie, GeochemieGeology, GeochemistryGeographie:KlimatologieGeography:ClimatologyZusammenfassungZiel des Teilprojektes B2 in der zweiten Phase war die Analyse der hydrologischen Prozesse derOberflächen- und Grundwasserressourcen sowie der Bodenerosion im Ein<strong>zu</strong>gsgebiet des Drâa.Dabei stand die Aufbereitung der Datenbasis für die hydrologische Modellierung sowie dieDurchführung von ersten Simulationen im Mittelpunkt der Aktivitäten. Die Simulationen wurdenmit dem Modellsystem MMS berechnet. Sie zeigen die Komplexität des betrachteten Systems,welches durch die große Heterogenität sowohl der Oberflächeneigenschaften als auch die desUntergrundes hervorgerufen wird. Eine abschließende Validierung konnte daher bislang nichtdurchgeführt werden, ist aber derzeit in Bearbeitung.Die für die Bewässerungswirtschaft bedeutendste Wasserressource ist der Schneespeicher imHohen Atlas. Aus den vorhandenen Punktmessungen der von IMPETUS betriebenen Klimastationenalleine kann keine Abschät<strong>zu</strong>ng der Wassermenge erfolgen. Aus diesem Grund wurden detaillierteMessungen mit Fernerkundungsmethoden und Modellierung verknüpft. Die Schneeschmelzean den Messstellen wurde mit dem physikalisch basierten Modellsystem „Utah EnergyBalance Model“ (UEB) berechnet, welches insbesondere den für die Wasserverfügbarkeit wichtigenProzess der Sublimation detailliert berücksichtigt. Auf der regionalen Skala wurde aufgrundder fehlenden Daten auf einen konzeptionellen Ansatz (Snowmelt Runoff Model, SRM)<strong>zu</strong>rückgegriffen. Trotz der hohen Heterogenität des Ein<strong>zu</strong>gsgebietes konnten mit diesem Ansatzbefriedigende Ergebnisse erzielt werden.Auf der regionalen Skala wurden die Bodeneigenschaften aus einer Kombination von Bodenprobenund statistischer Regionalisierung gewonnen. Trotz der Größe des Gebietes konnten die wesentlichenEigenschaften erhoben werden und stehen den anderen Teilprojekten <strong>zu</strong>r Verfügung.Die Bodendegradation wurde mit dem distributiven Modellsystem PESERA berechnet. Erste
208IMPETUS Subproject B2Szenarienrechnungen zeigen, dass das gewählte Modell einen guten Kompromiss zwischen Detailtreueund Anwendbarkeit auf der regionalen Skala darstellt.Hinsichtlich der hydrogeologischen Situation wurden in der 2 Phase die Grundwasserressourcendes nördlichen und mittleren Drâa-Ein<strong>zu</strong>gsgebietes sowohl hinsichtlich Menge als auchQualität untersucht und bewertet. Mit dem Modell MODFLOW konnten die alluvialen Aquiferedes Beckens von Ouarzazate befriedigend simuliert werden. Ein konzeptionelles Modell für dieAquifer-Kaskaden der Oasen des mittleren Drâa-Tals wurde entwickelt und angewendet. ErsteSzenarienrechnungen belegen die Sensitivität des Systems hinsichtlich der Nut<strong>zu</strong>ng der Grundwasserressourcen.Das Teilprojekt leitet drei Problemkomplexe. Im PK Ma-H.1 werden die Wasserressourcen fürdas gesamte betrachtete Ein<strong>zu</strong>gsgebiet des Drâa in der Größe von ca. 30.000 km 2 berechnet.Während die Region oberhalb des Staudamms im Wesentlichen direkt von den Wasserflüssen ausdem Hohen Atlas abhängen, sind die Oasen auf die Abgabe von Wasser aus dem Staudamm angewiesen.Mit dem eingesetzten Modellsystem wird untersucht, wie sich die Wasserressourcen inden nächsten Jahrzehnten entwickeln werden und welche Auswirkungen dieses auf den Bewässerungsfeldbauder Oasen haben wird.Während der PK Ma-H.1 sich auf die regionale Skala konzentriert, werden im PK Ma-H.2 dieProzesse auf der Skala der Oasen untersucht. Die Auswirkung der Bewässerung auf den Grundwasserhaushaltund somit auf die lokale Wasserverfügbarkeit wird hierbei mittels Simulationsmodellenquantifiziert. Des Weiteren werden die Folgen des Bewässerungsfeldbaus auf die Bodenqualität(Versal<strong>zu</strong>ng) simuliert, um die Abnahme der Bodenfruchtbarkeit abschätzen <strong>zu</strong> können.Die einzelnen Modellkomponenten, ergänzt um Aussagen <strong>zu</strong>m häuslichen Wasserverbrauch,werden in ein DSS integriert, mit dem man Managementmaßnahmen untersuchen und bewertenkann.Für eine längerfristige Planung der <strong>zu</strong>künftig <strong>zu</strong>r Bewässerung <strong>zu</strong>r Verfügung stehenden Wasserressourcenist eine Quantifizierung der im Schnee gespeicherten Wassermenge notwendig,was im PK Ma-H.3 bearbeitet wird. Ziel dieses Problemkomplexes ist die Entwicklung und Implementierungeines Monitoringtools, das eine saisonale Abflussvorhersage für die Zuflüsse inden Stausee El Mansour Eddahbi bei Ouarzazate und dessen Füllstand ermöglicht. Dieses Toolbasiert auf einer Kombination von weitgehend automatischer Auswertung von Satellitendatensowie der Erfassung und Verarbeitung aktueller Daten von marokkanischen und projekteigenenWetterstationen mit der Simulation der Schneeschmelze mittels eines Schneeablationsmodells.SummaryThe objective of subproject B2 in the second phase was to analyse the hydrological processes,surface and groundwater water resources as well as soil erosion in the Drâa catchment. Theemphasis was laid on the creation of a data base required for hydrological and erosion modelling.The model system MMS was chosen for simulating the water resources and their dynamic.First results show the complexity of the system which is caused by the large heterogeneity ofgeology as well as topography. Due to this complexity a final validation could not be performedyet but will be carried out soon.
Subproject B2 IMPETUS 209The most important water resource for irrigation is the snow cover in the High Atlas Mountains.Although a number of climate stations have been installed in the mountainous area, a combinationof field measurements, remote sensing and modelling is required for the assessment of theregional snow cover. At the point scale the physically based Utah Energy Balance Model (UEB)was chosen which considers sublimation in detail. At the regional scale the conceptual SnowmeltRunoff Model (SRM) was successfully applied.Soil properties for the whole catchment were estimated using soil samples and statistical regionalization.Despite the size of the catchment all main properties were analysed and offered toother sub-projects. The model PESERA was chosen for analysing soil degradation. First scenariocalculations reveal that PESERA is an appropriate compromise between accuracy andapplicability at the regional scale.Concerning the hydro-geological situation the aim of the 2 nd phase was the determination of thegroundwater resources of the northern and middle Drâa catchment. Groundwater quantity aswell as quality was investigated. Using MODFLOW the main alluvial aquifer system of the Basinof Ouarzazate could be described in reasonable accordance to reality. A conceptual model of theaquifers of the chain of the oases in the middle Drâa Valley was developed and successfully applied.First scenario calculations reveal the sensitivity of the system to the use of the groundwaterby motor pumps.The subproject is responsible for three problem clusters. Within problem cluster Ma-H.1 thewater resources of the whole basin (about 30,000 km 2 ) are analysed and simulated. While theupper catchment directly depends on the water fluxes from the High Atlas Mountains, the oasesdownstream of the reservoir are controlled by the reservoir filling and water release. With themodel system it can be studied how water resources will develop in future and how this affectsagricultural usage of the oases.While problem cluster Ma-H.1 concentrates on the regional scale, Ma-H.2 analyses the processesat the field scale. The effects of irrigation using groundwater on water storage in the aquiferare quantified using groundwater models. Furthermore, the effects on soil salinity are analysedand quantified in order to assess the reduction of soil fertility. The different model approachesare combined in a decision support system which can be used to study and to evaluatethe effects of water management strategies.Water availability for irrigation mainly depends on the water stored in the snow cover. The aimof problem cluster Ma-H.3 is to quantify the amount of water stored in the snow cover in theHigh Atlas Mountains to be able to forecast reservoir filling at the seasonal scale. This will beperformed by a combination of remote sensing, modelling and data from climate stations. Thedata will be processed automatically and the evaluation is performed using dynamic snow meltmodels.
210IMPETUS Subproject B2Workpackage B2-1: Climatic and ecological regionalizationDuring the second phase of the IMPETUS project the emphasis was laid on the creation of basicGIS layers for the MMS pre-processor WEASEL and on modelling with MMS. The subdivisionof the Drâa catchment upstream of the reservoir into 14 sub catchments was based on the DRH(“Direction Régional de l’Hydraulique”) discharge gauging stages shown in Fig.B2-1. Every subcatchment was further subdivided into HRUs with average size of 5 km 2 (Fig. B2-2a). An importantpre-requisite for the hydrological modelling in the mountains is a high resolution DEM.Since the Ifre catchment has the largest areal distribution with altitudes above 3000 m it thereforehas the highest potential for snow precipitation. Other important basics for modelling arevegetation (in relation to evapotranspiration), geomorphology (in relation to infiltration, watertransfer and discharge generation, Fig. B2-2c) and geology (in relation to groundwater transferand groundwater storage, Fig. B2-2b). Under arid conditions, especially in the mountains, soilsare not well developed (de Jong et al., 2005; de Jong et al., 2004). Therefore the hydrologicalcharacteristics of the surface and subsurface units are defined via the geomorphological andpetrographical conditions. Instead of a soil-oriented approach based on the DEM, geomorphologicalunits are delineated and used to define the soil hydrological characteristics of e.g.screen areas or fans (de Jong, 2005; de Jong et al., 2005 b). Separate input layers defining permeability(e.g. rock faces are defined as impermeable) and groundwater reservoirs (with differentstorage potentials) were created for the pre-processor.Fig. B2-1:Hydrological sub catchments with stage gauges (blue triangles) and confluencepoints (blue points) of the Upper Drâa in the catchment of the Mansour Eddahbireservoir projected on the DEM.
Subproject B2 IMPETUS 211a)b)c)Fig. B2-2:The mountainous Ifre catchment was subdivided into a) HRUs with oases, b) hydro geologicalunits reflecting different groundwater availability and c) hydro geomorphological units.The water balance was modelled for the Ifre catchment with the MMS system. Modelled dischargewas validated with observed discharge data for the Ifre gauging station between 1994 and1999. In addition to presented results (Speth & Diekkrüger, 2006; PK Ma-H.1) a general overviewis given here.Discharge is most sensitive to rainfall and snowmelt, the distribution of impermeable surfacesand the loss from surface to subsurface reservoirs. The typically sharp flood peaks are the resultof the dominance of impermeable rock faces in the catchment. The built up of seasonal waterstorage is largely steered by the effects of spring snowmelt and the slow draining from subsurfacereservoirs. Only approximately 20 % of the precipitation produces surface runoff, a largeproportion is lost into subsurface reservoirs and evapotranspiration. For a spring flood event dischargeis nearly 20 times higher than base flow. Spring and autumn flood events have differentcharacteristics. Autumn events have sharp, symmetrical peaks. The sharp decrease during therecession is the result of the poorly developed storage capacity in the river banks. Spring eventshave sharp rising flood limbs and initially fast descending limbs with a longer and slower finalphase. The asymmetrical shape of the flood wave is caused by snowmelt effects in spring time.After the winter snowfalls, the snow reservoir slowly melts out over the next 6 weeks. Withoutthe snow storage, runoff resumes to base flow within 1-3 days.The fastest discharge and the highest surface runoff are generated on the steeply inclined rockfaces in the northern and southern Ouzighimt valley and on the deeply incised clayey badlands insouthern Ifre. Least surface runoff is produced over the quickly infiltrating fans, screen slopesand ephemeral wadi beds. Slopes in the limestone areas with characteristic clayey, debris-richweathering produce only average amounts of surface discharge. The geomorphological charac-
212IMPETUS Subproject B2teristics are similar in the other mountainous sub-catchments (Msemrir, Tenhir and Dades). Ifredominates with approximately 80 % permeable substrate, so that it can be assumed that subsurfaceflow dominates in this catchment. In the other catchments only approximately 50 % is permeable.Most water is available at the spring horizon above the through flow area of the screenslopes and in the wadi beds. After strong precipitation events these zones become saturated andcause rapid surface flow.The majority of this discharge then infiltrates through the porous wadi beds (as “channel lossfunction” in the model) and limestone into deep groundwater stores. Therefore surface dischargein the Ameskar valley is often minimal. The situation is different in Ouzighimt valley. On theone hand discharge is favoured by many karst springs, on the other hand it is favoured by thespatially and temporally much larger snow store in the cirque floors (red zones in Fig. B2-2c).The discharge here is constant and ample during the whole year (ca 5 m 3 per second). Duringsnowmelt it increases, so that the confluence of M’Goun and Ameskar River has on averagedouble the amount of discharge as the M’Goun in periods without snowmelt. However, dischargeat the catchment outlet in Ifre is low relative to the snowfall inputs.The minimal surface discharge is typical for karstified areas and for arid regions with deep andwide wadi beds (de Jong et al., 2005c; Corripio and de Jong, 2004). The wadi river beds (wadifans on the map, Fig. B2-2c) are present in both the lower reaches of the M’Goun and Ameskar,so that the continual decrease in surface flow with increasing distance from the mountains can beexplained by the areal increase in infiltration loss. Under flood conditions impervious zones (e.g.clay areas) as well as saturated areas steer the discharge dynamics. The wadi river beds andlower slopes that dry up during the summer months become active. After longer duration precipitation(more than 6 hours), flood wave amplitudes are well developed. The smaller flood wavesare of high importance for the local users whilst the extreme events are of importance for theMansour Eddhabi reservoir.Evapotranspiration measurementsIn order to validate evapotranspiration outputs from the model field measurements of evapotranspirationwere carried out. An automatically weighing plant lysimeter with hedgehog cushionshrub was installed at 3200 m near Tichki in the High Atlas in the spring of 2004 to quantifyactual evapotranspiration and condensation. Although measurements were only available over a10 day period, the results are unique for this altitude and region. Temperatures fluctuated aroundthe zero level and several snowfall events occurred during the measurement period. The resultsfrom the selected day show that evapotranspiration dominates between 10-17:00 (approx. 1 mm)and that there are large amounts of condensation in the late evening (from 21:00 onwards,approx. 0.8 mm). At night there are large fluctuations in actual evapotranspiration and condensation.During these cold periods the water turn-over by condensation is about 60% of the dailyactual evapotranspiration. No data is available for the summer period yet, but it is assumed thatcondensation as well as evapotranspiration will be much reduced due to reduced water availability.
Subproject B2 IMPETUS 213Workpackage B2-2: Snow climatology and hydrology in the High Atlas MountainsAim of this workpackage was the analysis of the snow cover dynamic in space and time and theinvestigation of its relevance for the regional water balance, the precipitation climatology, andthe vegetation ecology. This was performed in a threefold approach of remote sensing, groundmeasurements and modelling (Fig. B2-3). For this purpose regional snow cover mapping withMODIS satellite imagery was refined to cope with the quickly changing situations of shallowsnow cover in the High Atlas Mountains while staying in a nearly operational mode. Moreover,snow cover duration maps have been calculated for the Central High Atlas (Speth & Diekkrüger,2006; PK Ma-H.3). Monitoring of climate, especially snow, at the project test sites with automaticweather stations and during field campaigns was continued. Water balance calculations atpoint and catchment scale were continued based on physical and conceptual snow ablation andrunoff modelling. The approach described above and the integration of a weather generator developedin the meteorological branch of IMPETUS serve as a basis for the design of a plannedmonitoring tool for the prediction of snowmelt runoff in problem cluster Ma-H.3.Fig. B2-3:Approach for the snow research in workpackage B2-2. Methods have been chosenguided by the questions in the arrow.Physical modelling of snow ablation processesSnow ablation modelling using the Utah Energy Balance Model (UEB; Tarboton and Luce,1996) has been improved due to the installation of two snow pillows and snow temperature/surfacetemperature sensors in 2003. The indirect validation of physically modelled snowmeltand sublimation processes showed good agreement regarding the length of the snow coverperiods, hourly snow surface temperature and the dynamic of changes in snow water equivalent.Where no snow pillow data were available the estimation of the snow mass based on snow depthmeasurements and assumptions of new snow density was effectively continued.
214IMPETUS Subproject B2Periods of snow melt and sublimation occurred during every winter since the installation of theautomatic weather stations in 2001. Under cold and dry conditions modelled snow sublimationrates in altitudes of 3000 m and above were usually in the order of 2-3 mm per day whichmatches the measurements done with snow plates in 2003. Whereas former UEB calculations forthe sites Tichki and Tounza indicated a loss in water equivalent of 30 to 40 % during winter (PKMa-H.1 in Speth & Diekkrüger, 2006; Schulz and de Jong 2004, 2006), the environmental conditionsat the station M’Goun (3850 m) forced the snow cover to sublimate 80 % of its waterequivalent in winter 2004/05. The modelling results were validated with measured snow coverduration and snow surface temperature (Fig. B2-4).Fig. B2-4: UEB modelling results at the station M’Goun (3850 m) for the period 6.11.2004-4.4.2005 (x-axis: day of year). Red colours indicate measurements (snow surface temperature,snow depth); Ts: modelled snow surface temperature; SWE: modelled snow water equivalent;Cum Sublimation/Melt: modelled cumulative sublimation and melt. The model was initializedwith a snow depth of 1 m ≅ 150 mm SWE.Conceptual snowmelt runoff modellingAnalysis of discharge with data from three runoff gauges along one river showed the complexprocess of snowmelt induced runoff generation within the high mountain sub-basin of the OuedM’Goun (Fig. B2-5). According to gauge data and to results in WP B2-1 only heavy rain orsnowfall events lead to changes in surface runoff that can be recorded. Apart from water lossesthrough high evaporation rates, periods of snow sublimation in winter and water use for irrigationthis confirms that during most time of the year discharge is generated by groundwater outflow.Since only heavy events produce floods and refill storage lakes like the Mansour Eddahbireservoir near Ouarzazate, an analysis of the general course of events is given for the hydrologi-
Subproject B2 IMPETUS 215cal year 2002/03 by observations and conceptual modelling with the Snowmelt Runoff Model(SRM; Martinec et al., 1998).In mid-March 2003, a precipitation event of 35-110 mm (rising gradient from Ifre to M’GounPeak; 100% rain in Ifre changing to 100% snow at M’Goun) caused the first flood peak of theyear at all gauges. Runoff coefficients were around 0.1-0.2 which matches the calculations ofWP B2-5. Rain and mixed rain and snow in lower regions generated runoff at all three gaugingstations. The quick recession at Ifre is modelled well. The rising runoff at Cascade was causedby ongoing snowmelt in the upper parts of the sun exposed M’Goun region as it was the case forhigher Taria. Here, recession started earlier due to the small catchment area and falling air temperatures.A second melt period in late March is indicated by the second order peaks at Ifre andTaria. SRM modelling for Cascade was of moderate success and does not match the quick recessionin April.The conclusion is that northerly exposed flanks and high elevated regions of the M’Goun subbasinexperience the main melt with quick rising air temperatures at the beginning of springwhile sun-exposed flanks of medium elevation produce snowmelt runoff continually until totalablation, which in the case of Cascade is proved by snow depth data from the Tichki automaticweather station.Fig. B2-5: Measured and SRM modelled discharge at the gauging stations Taria (elevation at gauge: 2700m, basin area: 5,2 km²), Cascade (2200 m, 54 km²) and Ifre (1500 m, 1250 km²) within theM’Goun sub-basin/High Atlas Mountains. Taria, Cascade data: IMPETUS; Ifre data: Servicede l’Eau Ouarzazate.Precipitation mapsMaps of the annual precipitation sum of the Drâa basin for the hydrological years 2001/02 to2003/04 were produced by a combination of data measured at the automatic IMPETUS weather
216IMPETUS Subproject B2stations and data of the official Moroccan stations (Service de l’Eau Ouarzazate) (Fig. B2-6). Bythis combination the station density was increased in the Basin of Ouarzazate, and the Anti-Atlasand measured data of the high mountain region (snow water equivalent included) was added forthe first time. Statistical analysis of the regional distribution for the three years resulted in spatialgradients that were strongly correlated with elevation (R² of 0.95 to 0.98). Besides the dominatinggradient given by the south-eastwards decreasing elevation of the Drâa basin, only local effectsare reflected at the single stations. No further regional trends can be observed with that database. Therefore the precipitation maps were calculated based on the digital elevation model. Alayer of residuals was interpolated and added to the raster map. Last steps were a resamplingfrom 30 to 300 m and a low pass filtering (3x3) to smooth the resulting precipitation maps.Fig. B2-6: Annual sum of precipitation (2001 – 2004) in the Drâa basin and coefficient of variation for 3years.The maps serve as first estimations of the actual regional precipitation for several purposeswithin the project (e.g. statistical correlations with distribution of soil and vegetation parame-
Subproject B2 IMPETUS 217ters). The coefficient of variation generally increases with decreasing precipitation in the MiddleDrâa Valley. In 2001/02 the precipitation gradient was smaller than in the following years due toless snowfall in the High Atlas in winter but heavier rain events in the Anti-Atlas in autumn andspring. Since station density in the mountainous regions remains sparse and the shape of the digitalelevation model may produce erroneous precipitation sums not linked to elevation, altitudinaland regional gradients have to be validated during further field work and future design of meteorologicalobservation nets.Workpackage B2-4: soil properties and soil degradation at the regional scaleRegionalisation of soil propertiesA regional map of soil properties is a crucial data base for several models running in IMPETUS,e.g. the hydrological model SWAT or the eco-physiological model SAVANNA (WP B3). Thusit is an input for the problem clusters Ma-E.2, Ma-H.1, Ma-H.2, Ma-L.2 and Ma-L.3. Up to now,soil maps exist only for the agriculturally used oases. In the first two phases, 199 soil profileswere investigated and classified according to the World Reference Base (WRB) soil classificationscheme (Bailly et al., 1998). This data forms the basis for the regionalisation of the soilproperties as texture, organic matter content or soil depth. Below, the regionalisation procedureis explained via the example of sand content of the topsoil and the hitherto existing results areshown.As the Drâa catchment is 30.000 km² in size and is characterised by a very heterogeneous lithology,a direct regionalisation of soil properties is not possible. Fig. B2-7 shows the semivariogramof sand content. A Gaussian model is fitted; the colour indicates the number of pairs.It is clearly illustrated, that the spatial autocorrelation of this soil variable is very weak.Fig. B2-7:Variogram of sand content in the topsoilIn order to reduce the variability, it is analysed whether the variability of the sand content can beexplained by a subdivision according to the geomorphologic unit and the parent material. Fig.
218IMPETUS Subproject B2B2-8 shows the median (horizontal line), the 75% and 25% quartiles (box) as well as the rangeof values (vertical line) of the sand content for each unit.The geomorphologic units are defined following the approach of Dikau et al. (1991). The informationon parent materials is extracted from the geological information system (WP B2-5). Concerningthese geomorphological units, the Student’s t-test shows that the sand content differswith statistical significance (10%-level) from one unit to another. The only exception is given bythe unit “tablelands”, which can not be separated from “open hills and mountains”. So these twoclasses are merged for further analysis. Regarding the parent material, classes of sand contentcan not be clearly separated in several cases. For example, the sand content of soils formed onmagmatical rocks like granite, rhyolite and basalt is not significantly different from other soils.On the other hand, soils formed on sandstones differ significantly from each other. The soil samplescover all spatially important parent materials as well as all geomorphologic units in thecatchment.1009080100a)90b)80sand content [%]7060504030sand content [%]7060504030202010100plainsplains withhills ormountainstablelandsopen hillsandmountainshills andmountains0gneissmarllimestonesandstoneschistbasaltgranitrhyolitsand, silt & claysandstonesiltFig. B2-8:Sand content of the topsoil subdivided into geomorphological units (a) and parent material (b)Furthermore, correlations with relief parameters and climatic variables (precipitation and temperature)are computed for each class separately. Relief parameters like the topographic wetnessindex (Beven & Kirkby, 1979) are computed from the DEM. Regional maps of precipitation andtemperature are provided by WP B2-2 (Schulz, submitted). The coefficient of correlation isweak. There seems to be a slight relationship between sand content and curvature (R² = 0.42 forsoils on sandstones). Comparable low R² values are often mentioned in the literature in the contextof pedometrics. Bourennane et al. (1996) gained a R² value of 0.32 when correlating thicknessof a silt-clay-loam horizon with the slope gradient. The slope gradient is then used as covariablefor the regionalisation of the horizon’s thickness. McBratney et al. (2000) found a correlation(R² = -0.358) between clay content and elevation and use this as a basis for predicting claycontent via different statistical methods. Other authors use multivariate statistics to explain variabilityof soil properties (de Bruin & Stein, 1998; Odeh et al., 1994). Multivariate methods arecurrently applied to the data of the Drâa catchment. Furthermore, different statistical interpolationmethods are tested. Herbst (2001) described regression kriging as the most powerful method
Subproject B2 IMPETUS 219in terms of soil mapping; this is confirmed by Knotters et al. (1995), Odeh et al. (1995) and variousother authors.Soil degradationSoil erosion by water is a severe problem in the Drâa region. This is indicated by the analysis ofthe sedimentation of the reservoir El Mansour Eddabhi, located in the centre of the catchment.Since its construction in 1972, 4 bathymetric surveys have been carried out, the last one 1998 (cf.Fig. B2-9). The data show a loss of capacity of already 25% up to 1998. Assuming a linear trend,the capacity will reduce to 54%; assuming a polynomial trend the reservoir will be totally filledby the year 2025.650600bathymetric surveyslinear trendpolynomial trendcapacity [m³ * 10 6 ]550500450R 2 = 0.93R 2 = 0.98Fig. B2-9:4001970 1975 1980 1985 1990 1995 2000yearDevelopment of the capacity of the reservoir El Mansour Eddabhi (source: DRH Agadir)MethodAs these trends do not consider any causal relationships, they do not offer the possibility to calculatescenarios. Further more they do not identify the sources of sediment in the catchment,which is the precondition for planning efficient measures against erosion. As no measured dataon erosion distribution and extent in the Drâa region exist, the model PESERA (Pan EuropeanSoil Erosion Risk Assessment) is applied to determine areas of highest erosion risk. This modelwas developed by Irvine & Kirkby (2003) in the framework of the PESERA-project. It isadapted to large, semi-arid basins suffering from low data availability. The model runs on a 250x 250 m grid using the SRTM DEM, the Landsat TM vegetation classification of the workpackageB3 and the modelled climate data of the workpackage B1 as input parameters. A preliminarysoil map based on the geological units is actually used and will be improved in the future. Thepixel size is chosen following an analysis of the mean slope length in the catchment and a sensitivityanalysis of the model concerning the pixel size.ResultsFirst results calculated using the climate data of the year 2002 (cp. Fig. B2-10) show mean erosionrates of 18.6 t/ha/a for the whole Drâa basin. In the catchment of the reservoir the mean erosionrate is estimated to 35 t/ha/a. These results seem to be overestimated in comparison to amean erosion rate of 4.6 t/ha/a calculated from the sedimentation data of the reservoir. The highrates computed by the model are due to the fact that deposition and transport in channels are not
220IMPETUS Subproject B2considered by PESERA. So the value of 35 t/ha/a represents only the detachment of soil in oneraster cell.These results are not validated so far. The use of remote sensing indices for erosion assessment istested, but the results are not sufficient. Thus direct validation via erosion measurements is notpossible in the Drâa area. Currently, further outputs of PESERA are tested on their potentials ofvalidation. As the model calculates surface runoff, these values could be compared to measurementsof the discharge. As well the model calculates the canopy cover, which could be comparedto vegetation cover maps derived from a remote sensing analysis. As a plausibility check, thePESERA – results were compared to the results of a static model developed by Yassin (1996)specifically for Morocco. The comparison of the spatial distribution of erosion gained aweighted-kappa coefficient of 0.76, which indicates good agreement of the model results.Furthermore, first scenarios of climate and land use change are projected. The climate changescenario is based on a rise of temperature (3 °C) and on a constant amount but a rise of the variability(30 %) of the precipitation. Concerning the land use scenario, 275 km² of highest erosionrisk are afforested. The contingency tables (Tab. B2.1 and Tab. B2.2) show the results of thesesimulations. These tables display the comparison of a model run for Status Quo in 2002 withboth the climate and the land use scenario. They visualise the change of erosion risk by shiftingraster cells from one erosion class to another.Fig. B2-10: Erosion rates calculated by PESERA for the year 2002.
Subproject B2 IMPETUS 221Tab. B2.1:Contingency table comparing model results for Status Quo with the climate change scenario(Number of raster cells belonging to the appropriate class)20020-11-55-1010-1515-30> 30climate change[t/ha/a][t/ha/a][t/ha/a][t/ha/a][t/ha/a][t/ha/a]0-1 [t/ha/a] 62 258 0 0 0 0 01-5 [t/ha/a] 19 686 85 333 0 0 0 05-10 [t/ha/a] 882 68 815 32 334 0 0 010-15 [t/ha/a] 590 4 692 46 012 2 602 0 015-30 [t/ha/a] 277 4 449 13 568 30 469 14 283 0> 30 [t/ha/a] 5 860 2 863 4 010 12 148 47 373Tab. B2.2:Contingency table comparing model results for Status Quo with the afforestation scenario. (Numberof raster cells belonging to the appropriate class)20020-100100-150150-200200-250250-300> 300afforestation[t/ha/a][t/ha/a][t/ha/a][t/ha/a][t/ha/a][t/ha/a]0-100 [t/ha/a] 427 217 0 0 0 0 1 591100-150 [t/ha/a] 0 6 730 0 0 0 1 431150-200 [t/ha/a] 0 0 7 410 0 0 450200-250 [t/ha/a] 0 0 0 4 809 0 488250-300 [t/ha/a] 0 0 0 0 2932 304> 300 [t/ha/a] 0 0 0 0 0 147Regarding the climate change scenario, the mean erosion rate increases by 9.2 t/ha/a. For 39% ofthe raster cells, the erosion rate increases by one class. For another 7% the erosion rate increasesby at least 2 classes. Due to the affore-station, the erosion rate is reduced in 95% of the afforestedarea. In 65 % of this area, erosion is reduced by more than 200 t/ha/a. Hence the mean erosionrate is reduced by 2 t/ha/a. In the catchment of the reservoir the erosion decreases even by 6t/ha/a. The work is a main part of the problem cluster Ma-L.3.Workpackage B2-5: Hydrogeology – groundwater and groundwater rechargeThe objective of the hydro geological work for the 2 nd IMPETUS phase was the description ofthe main hydro geological features of the northern and middle Drâa catchment to determine thegroundwater resources. Based on detailed hydro geological investigations an integrated informationsystem is set up and for selected areas groundwater models are developed. The informationsystem offers the necessary data about e.g. the lithology, the stratigraphy, the geochemical rocktype, the type of the aquifers and the classification of hydraulic parameters. Furthermore thisinformation system represents a selection of observed data as e.g. the electric conductivity of thegroundwater (Fig. B2-11a & b). Thus this information system forms a valuable base for the in-
222IMPETUS Subproject B2terdisciplinary work of the problem clusters (Ma-E.1, Ma-H.1, Ma-H.2, Ma-H.3, Ma-L.2 andMa- L.3) and several modelling approaches.The investigations of the northern Drâa Basin in the High Atlas and the Basin of Ouarzazateshow complex recharge conditions due to the hydro geological setting. The significant groundwaterrecharge in the High Atlas takes place in the folded and trusted liassic limestone units andin a combination with the reduction of surface runoff by river bed infiltration. Estimations of thewater balance in the High Atlas in two different scales (110 km 2 : Assif-n-Ait-Ahmed catchmentand 1,240 km 2 : Ifre) reveal groundwater recharge rates between 4 % (Assif-n-Ait Ahmed) and 11% (Ifre) of the total precipitation. Due to scarce data available evapotranspiration is only roughlyestimated either after Turc (1963) for the Assif-n-Ait-Ahmed catchment or Jensen-Haise (Jensenet al., 1990) for the Ifre catchment. Thus the recharge rates given reflect only a general view(Cappy, in prep.).a) b)Fig. B2-11: a) Stratigraphical map and b) map of the geochemical rock type with the electric conductivity of thegroundwater (October 2005) of the Zagora region based on the integrated hydro geological informationsystem.Natural labelling with stable isotopes (δ 18 O, δ 2 H) allowed an estimation of the recharge area ofvarious springs in the northern Drâa catchment (Fig. B2-12). Based on series of rain water samplesa local altitudinal gradient of 0.20 ‰ δ 18 O per 100 m was calculated. Combined with theDEM a general relationship of δ 18 O = -0.002*altitude-3.0 with a very good quality (R 2 = 0.97)was found. This method allows the estimation of the mean altitude of the recharge area with anerror of +/- 50 m. While for the recharge area of the Assif-n-Ait-Ahmed mean altitudes between2,650 m to 3,400 m prevail, which displays the main outcropping area of the liassic limestone’s(Fig. B2-12), the recharge areas of the aquifers below the Ifre catchment have mean altitudesbetween 2,200 m and 3,450 m. The estimated mean altitude of the groundwater recharge area ofthe alluvial aquifers in the Basin of Ouarzazate ranges between 2,400 m to 2,900 m. As themaximum elevation of the Basin of Ouarzazate is about 1,800 m the results clarify that there isno significant groundwater recharge within the basin.
Subproject B2 IMPETUS 223Fig. B2-12: Mean altitudes of the recharge areas of the springs in the Assif-n-Ait-Ahmed catchment calculatedwith the local altitude gradient.For the estimation of groundwater age tritium and carbon-14 analyses were performed. Tritiumsignatures of the groundwater from the liassic carbonates and from the alluvial aquifers in theHigh Atlas as well as of the alluvial aquifers in the Basin of Ouarzazate indicate ages youngerthan 10 years and thus recent recharge processes. In the semi-deep aquifers of the Basin of Ouarzazatethe mean residence time of the groundwater is older than 50 years. The confined aquiferof the Senonian in the Tikirt area provides groundwater equal to or older than 50 years. Due tothe fact that the volume of this confined aquifer is small, the groundwater dating shows that thereis no significant recent recharge in this area. Furthermore this result alerts the risk of unsustainableexploitation of the groundwater (Cappy, in prep.). Groundwater from the Precambrian rocksof the Skoura Mole located in the northern part of the basin as well as groundwater from theperched aquifers of the Eocenic units in the north-western part of the basin appears to be olderthan 50 years. As these rocks are of low hydraulic conductivity the unproductive character ofthose aquifers is proved. Additional the use of carbon-14 analyses proved the presence of reallyold groundwater (500 to 2800 years) mixed with recent groundwater in the Precambrian rocks inthe northern range of the Basin of Ouarzazate (Cappy, in prep.).With a numerical steady state groundwater model (MODFLOW PMWIN5) the main alluvialaquifer system of the Basin of Ouarzazate can be described in reasonable accordance to reality(Fig. B2-13). Scarcity of precise data on this regional scale required certain assumptions for theparameterisation, e.g. the recharge. The total recharge displays a summation of recharge by raininfiltration (in accordance to the Ifre catchment around 10 %) and recharge by river bed infiltration.According to the model results the effective recharge of the alluvial aquifers by river bedinfiltration over the whole model domain represents 85 % of the total recharge (about 27 Miom³/a).
224IMPETUS Subproject B2Fig. B2-13: Piezometric map of the Basin of Ouarzazate computed by MODFLOW PMWIN5.In accordance with the results of the natural labelling with isotopes, this value proves that directprecipitation recharge of the alluvial aquifers is nearly negligible. The effective recharge of thealluvial aquifers by the river bed infiltration of the Dades and the M’Goun Rivers (cf. Fig. B2-13: Zone 1) averages to about 10 Mio m³/a. This result is in accordance with the losses of thedischarge measured by the Hydraulic Agency (ABH), which are about 9 Mio m³/a.While for single oases steady state numerical models comparable to the approach for the Basinof Ouarzazate are established, the groundwater system of the chain of the oases in the middleDrâa basin is simulated with an aquifer cascade model. This approach implements one shallowaquifer under each of the six oases (Chamayou, 1966; “Direction de la Region Hydrauliqued’Agadir de Souss-Massa et Drâa”, 2001). Based on a water balance approach (Fig. B2-14), themodel estimates the mean annual groundwater reserve, the saturated thickness and the mean annualgroundwater level for each aquifer.Fig. B2-14: Principals of the groundwater balance approach for a singleoasis in aquifer cascade established for the Middle Drâa.The model input includes the recharge by rain infiltration and the infiltration by water during the“Lâchers” as well as evaporation and the withdrawal. Considering the interconnection of theaquifers the model computes the groundwater flow from each upstream to the downstream aqui-
Subproject B2 IMPETUS 225fer. First model runs are calibrated with groundwater level data of the regional Hydraulic Agency(ABH). First simulations show that e.g. for the oasis of Tinzouline the groundwater exploitationstays unsustainable even though the withdrawal would be reduced by 25 % (Fig. B2-15).A slightly modified model structure is implemented in the socio-economical river basin modelMIVAD (problem cluster Ma-L.3).Fig. B2-15: Projection of a withdrawal scenario for the mean annual groundwater reserve of the oasis Tinzouline.LiteratureBailly, F., K. Mueller, R. Nieder, & H.-G. Schön (1998): World Reference Base for Soil Resources - Be<strong>zu</strong>gsgrundlage der Boden-Ressourcender Erde (WRB). Deutsche Überset<strong>zu</strong>ng. - ISSS, ISRIC, FAO. World Resources Reports 84, Rom.Beven, K.J., Kirkby, M.J., 1979. A physically based, variable contributing area model of basin hydrology. Hydrolological SciencesBulletin, 24, 43-69.Bourennane, H., King, D., Chéry, P., Bruand, A. (1996). Improving the kriging of a soil variable using slope gradient as externaldrift. European Journal of Soil Science 47: 473-483.Cappy, S. (in preparation): Hydrogeological characterisation of the upper Drâa basin.PhD-thesis, Geological Institute, UniversityBonn.Chamayou, J. (1966): Hydrogeologie de la Valee du Drâa Moyen.- Theses du doctorat d’université, Office de Mise en ValeurAgricole, Division des Ressources en Eau. Rabat.de Bruin, S., Stein, A. (1998). Soil-landscape modelling using fuzzy c-means clustering of attribute data derived from a DigitalElevation Model (DEM). Geoderma 83: 17-33.de Jong, C. (2005): Floods and droughts: on water balance and sediment transport in mountain regions. Framework paper forHabilitation, Mathematisch-Naturwissenschaftliche Fakultät, University of Bonn. pp. 95.de Jong, C., Collins, D. and R. Ranzi (2005a): Climate and Hydrology in Mountain Areas. John Wiley and Sons (pp. 384).de Jong, C., Ergenzinger, P., Borufka, M., Dresen, M. and A. Köcher (2005b): Geomorphological zoning: an improvement tocoupling hydrology and meteorology? In: de Jong, C., Collins, D. and R. Ranzi (Eds.): Climate and Hydrology in MountainAreas. J. Wiley and Sons. p. 247 - 260.de Jong, C., Machauer, C., Reichert, B., Cappy, S., Viger, R. and Leavesley (2004): An integrated geomorphological and hydrogeologicalMMS modeling framework for a semi-arid mountain basin in the High Atlas, southern Morocco. In: Pahl-Wostl, C., Schmidt, S., Rizzoli, A.E. and Jakeman, A.J. (Eds.): Complexity and Integrated Resources Management.Transactions of the 2nd Biennial Meeting of the International Environmental Modelling and Software Society, iEMSs:Manno, Switzerland, 2004. ISBN 88-900787-1-5, p. 736-741.de Jong, C., Machauer, R., Leavesley, G., Cappy, S. Poete, P. and O. Schulz (2005): Integrated hydrological modelling conceptsfor a peripheral mountainous semi-arid basin in southern Morocco. In: Paracchini, M.L. and R. Escadafal (Eds.): EU proceedings"Geomatics for Land and Water management: achievements and challenges in the Euromed context". p. 219-227.de Jong, C., Whelan, F. and B. Messerli (2005c): Water balance of high mountain basins. Special Issue of Hydrological Processes.Vol. 19 (12), p. 2323-2449.Dikau, R., Brabb, E.E., Mark, R.M. (1991). Landform Classification of New Mexico by Computer, U.S. Department of the Interior,U.S. Geological Survey.
226IMPETUS Subproject B2Direction de la Region Hydraulique d’Agadir de Souss-Massa et Drâa (2001) : Etude d’approvisionnement en eau potable depopulations rurale de Province de Zagora – Mission 1 : Analyse de la situation actuelle du service de l’eau et collecte dedonnées de base.- Royaume du Maroc, Direction Generale del’Hydraulique, Direction de la Recherche et de la Planificationde l’Eau. Rabat.Herbst, M. (2001). Regionalisierung von Bodeneigenschaften unter Berücksichtigung geomorphometrischer Strukturen für dieModellierung der Wasserflüsse eines mikroskaligen Ein<strong>zu</strong>gsgebiets. Geographisches Institut der Rheinischen Friedrich-Wilhelms-Unversität Bonn, Dissertation.Irvine, B. & Kirkby, M. (2003): Mapping of European Soil Erosion: The PESERA- RDI model. Proceedings of the 7th InternationalConference on GeoComputation University of Southampton, United Kingdom 8 - 10 September 2003Jensen, M. E., Burman, R. D., and Allen, R. G. (ed). (1990): Evapotranspiration and Irrigation Water Requirements. – ASCEManuals and Reports on Engineering Pratices No. 70, 360 p., Am. Soc. Civil Engrs..; New York, NY.Knotters, M., Brus, D.J., Oude Voshaar, J.H. (1995). A comparison of kriging, co-kriging and kriging combined with regressionfor spatial interpolation of horizon depth with censored observations. Geoderma 67: 227-246.Martinec, J., Rango, A. and R. Roberts (1998): Snowmelt Runoff Model (SRM) Users’s Manual. Geor. Bernensia, Series P,Volume 35, Bern.McBratney, A. B., Odeh, I.O.A., Bishop, T.F.A., Dunbar, M.S., Shatar, T.M. (2000). An overview of pedometric techniques foruse in soil survey. Geoderma 97: 293-327.Odeh, I. O. A., McBratney, A.B., Chittleborough, D.J. (1994). Spatial prediction of soil properties from landform attributes derivedfrom a digital elevation model. Geoderma 63: 197-214.Odeh, I. O. A., McBratney, A.B., Chittleborough, D.J. (1995). Further results on prediction of soil properties from terrain attributes:heterotopic cokriging and regression-kriging. Geoderma 67: 215-226.Speth, P. & B. Diekkrüger (2006): IMPETUS: Sechster Zwischenbericht, Zeitraum:1.1.2005 – 31.12.2005., 375 S.Schulz, O. and C. de Jong (2004): Snowmelt and sublimation: field experiments and modelling in the High Atlas Mountains ofMorocco. Hydrology and Earth System Sciences, 8(6), p. 1076-1089.Schulz, O. and C. de Jong (2006): Snow monitoring and hydrological modelling in the Central High Atlas Mountains of Morocco.In: Ait Hamza, M. et H. Popp (Eds.): Pour une nouvelle perception des montagnes du Maroc. Colloques et SéminairesFLSH, Rabat.Schulz, O. (submitted): Analyse schneehydrologischer Prozesse und Schneekartierung im Ein<strong>zu</strong>gsgebiet des Oued M’Goun,Zentraler Hoher Atlas (Marokko). Doctoral thesis at the Faculty of Mathematics and Natural Sciences, University ofBonn.Tarboton, D and C. Luce (1996): Utah Energy Balance Snow Accumulation and Melt Model (UEB). Computer model technicaldescription and user’s guide. http:\\www.engineering.usu.edu/dtarbTurc L. (1963): Evaluation des besoins en eau d'irrigation, évapotranspiration potentielle, formulation simplifié et mise à jour.Ann. Agron., 12: 13-49.Yassin, M., Bouh, S., Akdim, I. (1996). Approche methodologique de cartographie de l´erosion dans le bassin versant de QuedKorifla. Annales de la Recherche Forestière du Maroc 29: 133-150.
Subproject B3 IMPETUS 227Teilprojekt B3Steuerfunktionen der Vegetation für den Gebietswasserhaushaltdes Drâa-CatchmentsFunctional relations between the vegetation and the waterbudget of the Drâa-CatchmentAntragsteller / ParticipantsProf. Dr. H. Goldbach (Koordinator) / PD Dr. J. BurkhardtInstitut für Pflanzenernährung, Universität BonnProf. Dr. N. JürgensInstitut für Allgemeine Botanik, Universität HamburgProf. Dr. G. MenzGeographische Institute, Universität BonnÖkophysiologieEcophysiologyFach / DisciplineVegetationsökologieVegetation ecologyGeographie:FernerkundungGeography:remote sensingZusammenfassungDer Arbeitsschwerpunkt des Teilprojekts lag in der zweiten Projektphase auf „Monitoring“ undModellierung der Vegetationsdynamik und ihrer Auswirkungen auf den Gebietswasserhaushalt,wobei drei Arbeitslinien verfolgt wurden:• Fernerkundung, Habitatmodellierung und Vegetationskartierung <strong>zu</strong>m räumlichen„Upscaling“ vegetationsbezogener Information auf das Gesamtein<strong>zu</strong>gsgebiet als Basisfür GIS-basierte Szenarien-Evaluierung.• Vegetationsmonitoring und –modellierung als Grundlage für prozessorientiertes Landnut<strong>zu</strong>ngs-und Klimawandel-Assessment.• Landwirtschaftliche Modellierung <strong>zu</strong>r Abschät<strong>zu</strong>ng des Einflusses agrarischer Landnut<strong>zu</strong>ngauf den regionalen Gebietswasserhaushalt und des Ertragspotenzials unter verschiedenenSzenarien.SummaryThe principal focus of the second IMPETUS phase has been placed on monitoring and modellingvegetation dynamics in the Drâa-catchment. Thus, subproject B3 followed basically three linesof action:• Remote sensing, habitat modelling and vegetation mapping for upscaling of vegetationinformation to the whole catchment area and for GIS-based scenario evaluation.• Vegetation monitoring and ecosystem modelling for sound, process oriented land use andclimate change assessment.
228IMPETUS Subproject B3• Agricultural modelling to estimate the impact of agricultural land use on the regionalwater balance and yield potentials under different scenarios.Remote sensingThe availability of reliable digital input data sets is crucial for successful and sensitive modelling.Thus, a main objective of the remote sensing research group for the second phase ofIMPETUS has been acquisition and computation of environmental datasets for a subsequent usein spatially explicit models. The development of scenarios and modelling tools for subprojectoverarching problem clusters has been a second focus.The targets of the remote sensing group could be grouped as follows:• Generation of a high resolution digital elevation model (DEM) based on remote sensingsatellite data (ASTER and SRTM)• Sampling of ground truth data for further analysis and classification of satellite data• Generation of an area-wide and high resolution vegetation map• Pre-processing of satellite data for time series analysis of vegetation dynamicsDue to the absence of the urgently needed primary datasets for Morocco, we had to conduct multiplefield campaigns for the acquisition of ground data with subsequent post-processing.Fig. B3-1:Digital Elevation Model of the Drâa-catchment measured 241 GCPswith a dGPS, highly precise and almost evenly distributed over thewhole
Subproject B3 IMPETUS 229The main objective of the field campaign in autumn 2003 was to collect ground control points(GCPs) for the calculation of a DEM derived from ASTER satellite data (Fig. B3-1). We thusmeasured 241 GCPs with a dGPS, highly precise and almost evenly distributed over the wholecatchment. These points were linked to cognisable pixels in the nadir looking IR-channel-imageof Aster sensor (3N) as well as in the backward looking channel (3B). Afterwards, photogrammetric calculations with the OrthoEngine of PCI geomatics were used to compute single DEMsfor each of the 20 Aster scenes. Mosaicing was used for the bonding of all single datasets to ahomogeneous DEM.Finally, errors were corrected by blending of corrupt areas with later available SRTM-data. Furtheron, the DEM with a horizontal resolution of about 30 m was used for ortho-rectification andhighly precise geo-rectification of satellite datasets like LANDSAT, ASTER, ALI and HYPE-RION and for the generation of environmental data sets (climate parameters, slope, aspect, etc)for habitat modelling.Habitat modellingIn the second phase of the IMPETUS project we started to develop statistical habitat models toidentify the potential distribution ranges of vegetation units and key species. These models calculatethe habitat availability of the target objects, based on their environmental profile. Thistechnique enables us to regionalise and upscale vegetation classifications based on multivariatestatistical analysis with TWINSPAN and Canoco. The intersection of habitat models with remotesensing approaches to vegetation mapping allowed us to create a sound ecological and site specificvegetation classification of the Drâa Catchment (see below). This vegetation map of theDrâa-catchment presents a reliable basis for up-scaling and regionalisation of other modellingapproaches in subproject B3 like the SAVANNA Model.Fig. B3-2:Interpolation and relief adaptation of annual mean temperature: REMO model output (left),kriging (centre), relief adaptation using the model inherent thermical gradient with altitude(right).
230IMPETUS Subproject B3Development of statistical habitat models is an iterative process to improve model quality byselection of factors which are process relevant for environmental constraints. The combination ofspecies response (presence vs. absence) with the set of explaining variables is used to fit theselogistic generalised linear regression models (logit-GLM). Actually, vegetation data from about1200 “relevés” is available for modelling, as well as an extensive set of environmental variablesfor the entire catchment. The latter comprises DEMs and derived topographical factors (altitude,slope, aspect), regionalised and relief adapted climate factors (Fig. B3-2), geologic, geomorphologicand hydro geologic properties and socio-economic data.Further improvements of habitat models in module StaHab include:• modelling of dependent variables with interaction terms• iterative integration of refined climate model dataFig. B3-3 shows the predicted habitat distribution of the “Artemisietea herba-albae” steppecommunities in the Drâa catchment. The main factor on the regional scale was mean annualmaximum temperature. Model evaluation shows an AUC Value (area under the curve) of 0.95and a Cohen’s Kappa coefficient of 0.79, both indicating a highly confident model result(Fig. B3-4).Fig. B3-3:Predicted distribution of “Artemisietea herba-albae” steppesHitherto, habitat models of the principal vegetation units which have been calculated using R-Software (R Development Core Team, 2005) are available for the Drâa catchment, and havebeen integrated in the beta version of the vegetation map.
Subproject B3 IMPETUS 231Shifts of vegetation units due to climate change processes are widely discussed in literature buthave never been assessed in northern Africa with spatially explicit scenario data. We parameterisedhabitat models with REMO scenario data on present and future climate to calculate shifts ofhabitat availability for Erinacetalia communities, which constitute the uppermost vegetation beltof the High Atlas. Climate scenarios predict an increase of mean annual temperatures of 2.5°C.GIS layers for the respective climate factors were recalculated and applied to the existing habitatmodels. Important vegetation shifts were detected for Erinacetalia communities. In the Anti Atlas,where this community can still be found in the highest summit areas, it would becomemostly extinct. In the High Atlas, the vegetation unit would withdraw 150 m uphill which, in thelong run, would induce a habitat loss of 22 % (Finckh et al., 2005).Data and knowledge gained during the second phase will allow us also to investigate the followingtheoretical questions:• How important is the scale effect of environmental variables for the prediction of habitatavailability?The hypothesis that different environmental variables as climate factors, soil parameters or reliefproperties such as slope and aspect act only on a certain geographic scale is mostly assumed inliterature, but has not yet been tested in a comparative way. With the broad range of availableGIS information in the subproject, this assumption shall be examined.• Do character species based vegetation models differ from community based habitat models?We want to examine if the overlay of habitat models for character and differential species ofplant communities differs significantly from the respective community habitat models.Fig. B3-4:R-Software model evaluation for the habitat model of Artemisietea herba-albae steppes, indicating,among others, AUC values, and Cohen’s Kappa statistics (Hosmer & Lemshow,2000).
232IMPETUS Subproject B3Vegetation mappingSince 2004 much emphasis has been placed on monitoring and modelling vegetation dynamics.One of the most important prerequisites for modelling and time series analysis (see below: vegetationdynamics) is a reliable status quo dataset for vegetation cover. Especially in arid to semiaridenvironments with typically sparse vegetation cover it is highly recommended to create anadaptable dataset of potential vegetation cover as initial dataset for further analysis and modelling.We combined remote sensing and habitat modelling techniques to generate a vegetationmap of the catchment which meets the technical requirements for vegetation modelling. The existingmono temporal landcover classification with 37 classes of LANDSAT ETM+ data (seeformer reports: Schmidt, 2003) and statistical habitat models were used for the generation of avegetation map.First, several steps of image processing were undertaken to create a homogeneous and unbrokendataset of different cover types and classes. Moving filter windows of increasing sizes for eachiteration step of this process were used to interpolate non-classified areas. Then several existinglandcover classes were either merged or splitted (e.g. by using altitude or relief types out of theDEM) with the aim of getting ecologically meaningful classes of cover density and cover type.Finally, a new classification algorithm was developed and the resulting cover classes were intersectedaccordingly with habitat models of the principal macro-vegetation units in order to createfloristically defined mapping units and to fill the prevalent substrate units with vegetation information.The intersection resulted in a digital map of 31 vegetation units and 7 special classeswithout vegetation cover (Fig. B3-5).Vegetation monitoringBased on five years of continuous monitoring we analysed demographic parameters related toclimatic trigger events and grazing, such as germination, seedling establishment and die off fordominant species like the oro-mediterranean thorny cushion shrubs Alyssum spinosum and Vellamairei (see Jahresbericht, 2005). Germination of A. spinosum is triggered by late summer rainfall,but seedling establishment for both species depends largely on the overall climate stressprofile of the following year. We also assessed spatial dynamics and interspecific competition ofimportant species, e.g. the case study of Hammada scoparia and Convolvulus trabutianus at testsite BSK, investigated by means of O-ring statistics (Jahresbericht, 2005).In addition to these process oriented analyses we conducted comparisons along the entire transectbased on functional traits and species density. Hitherto, results show a marked functionaldichotomy of the vegetation units. The exclosure experiments in the mediterranean and iranoturanianvegetation units show significant trends of increasing abundance of chamaephytes andincreasing frequency and abundance of perennial grasses. Spatial shifts in species distributionindicate the gradual restoration of site specific communities exposed to increasing competition.This coincides with the hypothesis of Glenn-Lewin et al. (1992) that late in succession, whencompetitive pressures are high, niche breadths should decrease (and vice versa). Changes of landuse intensity (especially grazing pressure) will change vegetation units in the long run in terms ofmodified spatial extents and altered floristic compositions. These dynamic aspects have to beconsidered in the architecture of spatially explicit decision support systems for land use management.
Subproject B3 IMPETUS 233Fig. B3-5:Vegetation map of the Drâa-catchment.
234IMPETUS Subproject B3Fig. B3-6:Box and Whiskers plots of inter-annual fluctuation of species numbers along the monitoringtransect. Black rhomb indicates total number of species summed up over the wholemonitoring period.The transition zone between 200 mm and 100 mm precipitation shows maximal species densitiesat 100 m² scale (Fig. B3-6), due to a peak in therophyte diversity. The arid domain of the transect,below the 100 mm isoline, does not present similar dynamics, neither changes in speciescomposition nor shifts in abundance or frequency of perennial plants. Principally driven by erraticrain events, the arid desert ecosystems of the southern part are less susceptible to pastoraldegradation than the arid to semiarid steppes in the northern zone. As these steppe ecosystemsare at the same time of higher productive value and more vulnerable, special emphasis should beplaced on development and implementation of sustainable pastoral land use schemes for them, toprevent degradation and desertification processes.To develop a forecasting tool for vegetation dynamics at the catchment scale we have chosen anapproach based on processing and analysis of remotely sensed NDVI time series. Besides geometrically,radio metrically and relief corrected imagery, an initial dataset for the recognition ofreal vegetation units out of remote sensing data is imperatively necessary for time series analysis(see above: vegetation mapping). SPOT-Vegetation and MODIS NDVI datasets have been usedfor the monitoring of vegetation dynamics. MODIS proved to be the more suitable dataset due tothe better horizontal resolution of 250 m in spite of the somewhat lower temporal resolution. Aspatial and temporal monitoring and analysis tool, programmed in IDL, is being developed at themoment.Ecosystem modellingThe ecosystem model SAVANNA is used to assess species composition and their respectivebiomass dynamics and productivity under pastoral conditions. The model was validated in theTaoujgalt area (1900 m a.s.l) with observed Artemisia herba-alba population data (individuals/ ha) in the period 2002 - 2003 versus simulations (Fig. B3-7). Population dynamics indicate
Subproject B3 IMPETUS 235good correlation regarding seasonal dynamics with focus on the flowering period of Artemisiaherba-alba in autumn. Although model simulation starts in spring 2002, population maximumoccurs in autumn 2003. Furthermore, uncertainty with regard to standard deviations of populationnumbers has to be taken into account.The parameterisation for regional model up-scaling is in progress. We have developed a databasefor species composition and biometric data involved in the model. There are still difficulties regardingdead biomass and below ground biomass. Validation data are difficult to obtain, eitherfrom literature or from field measurements.Population data of Artemisia herba-alba / ha2000019000180001700016000150001400013000120001100010000Spring Autumn Spring Autumn2002 2003SimulationObservedDataFig. B3-7: Population data for Artemisia herba-alba (individuals / ha) -Field data versus simulation.Nevertheless herbaceous root dynamics are similar under grazing and non-grazing conditions forten year runs. Dead herbaceous biomass is carried over from year to year under “non grazing”conditions (Fig. B3-8). However, dead biomass is transferred in smaller quantities under ’grazing’conditions, as it declines after the growing seasons to low quantities due to herbivory. Grazingstimulated growth rates in some periods and reduced transfers to standing dead biomass duringthe dry season. An interesting point is the decline of Artemisia herba-alba under ’grazing’conditions below the level of herbaceous plants. Population trends of Stipa parviflora in thefenced permanent plots at Taoujgalt show a steady increase of individuals.We simulated different climate scenarios for the Tauojgalt area. First, we considered a meantemperature enhancement of + 0.5 °C in summer and + 1.4 °C in winter, respectively. Simulationresults indicate a decreasing trend for nitrogen sensitivity in the system under warmer conditions,whereas water sensitivity increased respectively (Fig. B3-9). ANPP increases with a mean of+ 5 g DWT / m 2 .
236IMPETUS Subproject B3Fig. B3-8:Total standing biomass comparison of two scenarios: ‘no grazing’ (green), ‘grazing’ (yellow),herb simulation: ‘no grazing’ (dark red), ‘grazing’ (light red) (Hrb: Stipa pariflora; Shb: Artemisiaherba-alba; Wdy: Junierus phoenicea).Our results for a CO 2 enrichment scenario (temperature scenario respectively) resulted in a slightANPP increase with a mean of + 10 g DWT / m 2 . In most studies, CO 2 enrichment stimulatesplant growth. NPP increases in C3 and C4 annual grassland under elevated CO 2 were generallycaused by increased plant WUE (water use efficiency) and plant sizes, caused by stomata closure(Coughenour & Chen, 1997). Nitrogen sensitivity decreases under elevated CO 2 simulation (seeabove).AgricultureCalibration and validation of maize and barley cropping systems in a mountain oasis of the MoroccanHigh Atlas with DSSAT.With field campaigns (1 thesis and 1 work experiment sojourns) in spring 2004 and summer2005 we created an appropriate data base on phenological data for barley and maize respectively,in order to assess plant growth, water use and yields in mountain oases. Barley and maize are,besides fruit trees, sycamores and vegetables, the principal crops of mountain agriculture in theDrâa-watershed.
Subproject B3 IMPETUS 237The villages Tichki and Ameskar (2300 m, resp. 2150 m. a.s.l) were chosen as representative testsites. In Tichki, the agricultural area occupies a debris fan of mixed basaltical-carbonatical substratum.This pattern causes a downstream soil gradient wherein five soil types have been distinguished,according to local farmer’s knowledge.Irrigation, leaf area index (LAI) and dry matter (DM) partitioning were measured at several plantgrowth stages. In 2005 stomatal conductance of maize and soil water contents in 20cm and 50cmdepth were surveyed on each field for a 2-week-period. Meteorological data from the IMPETUSweather stations IMS and TIC provided a good set of climate data for model calibration in thisregion.Fig. B3-9:Sensitivity analysis for Temperature scenario: Summer +0.5°C, Winter +1.4°CModelling was performed using the software package DSSAT 4.0 (ICASA 2004). The modelwas calibrated via field measurements for each crop, following the guidelines of Tsuji et al.(1998). Model parameters that affect phenology were modified until simulated a thesis and maturitycoincided with measured time sets. Then dry matter (DM) accumulation (Fig. B3-10,Fig. B3-11), LAI-dynamics and finally yield were calibrated. The trade-off between LAI, drymatter (DM) and yield respectively did not result in one particular cultivar which is best fitting inall parameters. Thus, we ranked the absolute differences between measured and simulated values.These ranks were weighted and aggregated via ANOVA analysis to select the most adequatecultivar in the model.The chosen cultivars were tested on the four remaining fields (Fig. B3-1, Fig. B3-2). The variabilitybetween the single fields has not been explained satisfactorily with our assumptions. Thismay have mainly been caused by difficulties in simulating low scale agricultural areas. Simulatedand measured inter-field averages did however not show significant differences as checked
238IMPETUS Subproject B3by a paired T-test (p
Subproject B3 IMPETUS 239Barley drymatter accumulation25000[kg/ha]2000015000100005000Field 1Field 2Field 3Field 4Field 5Field 1Field 2Field 3Field 4Field 5020 40 60 80 100 120 140 160 180Days after PlantingFig. B3-11: Barley dry matter accumulation on surveyed fields in Tichki. Lines indicate simulated plantgrowth, pyramids indicate observed data values. The used cultivar was calibrated for field 5 (yellowline).Based on our measurements, we estimate that barley consumes just 12.6 % of the irrigation water,maize 22.3 %. An important percentage of irrigation water thus infiltrates the alluvial aquifersand can be re-used by agriculture downstream.Evapotranspiration is estimated to be much lower than irrigation, but approximately three timesthe measured rainfall during the growing period (93 mm and 163 mm respectively). WUE turnedout to 0.12 g/l and 0.17 g/l incoming water. Andresen et al. (2001) reported maize WUE simulationsin a 100 yrs period with CERESMaize at 13 test sites with similar trends averaging 0.02kg/ha/yr.Further detailed analysis of water consumption as related to environmental factors is under wayboth for rangeland plants as well as for oasis crops and date palms. The data are fed to the correspondingmodel approaches and for up-scaling of the contribution of vegetation and crops underdifferent scenarios. Fig. B3-12 shows examples for rangeland vegetation and Acacia raddiana attwo different sites. Where data are reported in the literature, our data closely math these observations.A part of these data are novel and have not been reported elsewhere.The different day-courses reported in Fig. B3-12a through d for these species are related to differencesin water availability, temperature, PAR and developmental (physiological) state of theplants.For date palms transpiration rates were found to average about 1 L·m -2 (“leaf area”)·d -1 . If wellsupplied with water, date palm could be classified as intermediately transpiring similar to Ziziphuslotus (El Miyit) and Artemisia herba-alba (Taoujgalt). The lower level of water consumptionis around 0,3 1 L·m -2 (“leaf area”)·d -1 . It has been found that date palms are able to makeuse of even low light intensities (< 200 µmol m -2 s -1 ) in cases of water shortage, thus being ableto keep photosynthesis going under conditions where water stress is minimized.
240IMPETUS Subproject B3abcdFig. B3-12: Examples of daily courses (x-axis is local time) of transpiration for: a: Retama raetam (El Miyit),b: Artemisia herba-alba (Taoujgalt), c: Teucrium mideltense (Taoujgalt), d: Acacia raddiana (ElMiyit); variations in transpiration rates are due to different (soil) water supply, temperature and radiation;these as well as stomatal conductance are simultaneously plotted (F. Gresens, Diss. inprep.)Agronomic strategies to face water scarcity in the Drâa oasis of FezouataThe aim of the workpackage Ma-E2 is to develop an agricultural strategy catalogue focussing onagricultural productivity under water scarcity aspects. An agronomic information system forplant and soil nutrition parameters and for spatial data on agronomic land use and agronomicmanagement on a regional scale is under construction. The objective is the management supportof land use decisions and technical innovation in agriculture, regarding plant stress situations andyield options. A parameterised model family including agricultural modelling (YES), groundwatermodelling (Modflow) and domestic water use modelling will be used to simulate future landuse and water scenarios and their impact on agricultural productivity. Agronomic reactions andsolutions will be evaluated with our Moroccan partners.
Subproject B3 IMPETUS 241abcFig. B3-13: Day courses of transpiration of Phoenix dactylifera during selected days in the Drâa-Oasis Ternata.Observation groups a through c vary in water availability and thus transpiration rates: a)high, b) intermediate, c): low water availability: Tr = intentionally drought stressed treatments(ORMVAO experimental station Asrir); breaks in the curves are caused by technical failure.LiteratureAbu Hammad, A. & B. Blankespoor (2003): The Wadi el-Far´a Project: An Environmental Assessment of the Wadi el-Far´aWatershed; Agricultural Land Use in Wadi el-Far´a. Final Draft. http://www.calvin.edu/~dvrb/.Andresen, J.A., G. Alagarswamy, C.A. Rotz, J.T. Ritchie & A. Le Baron (2001): Weather impacts on Maize, Soybean and Alfalfaproduction in the Great Lakes Region 1895-1996. - Agronomy Journal. 93, 1059 - 1070.Cárcova, J., G.A. Maddonni & C.M. Ghersa (2000): Long-Term Cropping effects on Maize: Evapotranspiration and grain yield. -Agronomic Journal. 92, 1256-1265.Coughenour, M. & D.X. Chen (1997): Assesment of grassland ecosystem responses to atmospheric change using linked plant soilprocess models. Ecological Appl. 7(3), 802 – 827.Eitzinger, J., D. Marinkovic & J. Hösch (2002): Sensitivity of different evapotranspiration calculation methods in different cropweathermodels. Proc., 1st biennial meeting of the International Environmental Modelling and Software Society, IEMSs2002, 24-27 June 2002, Lugano, Switzerland, Vol. 2, 395 - 400.Glenn-Lewin, D., R. Peet & T. Veblen (1992): Plant succession: Theory and Prediction, 352 S. London.Hosmer, DW & S. Lemeshow, (2000) Applied logistic regression, 2nd ed. Wiley, New York.ICASA (2004): DSSAT - Decision support system for agrotechnology transfer – v.4, Honolulu, USAR Development Core Team, (2005): R: A Language and Environment for Statistical Computing, R Foundation for StatisticalComputing, Vienna, Austria. http://www.R-project.org.Roth, A. (2006): Future scenarios of biomass dynamics under pastoral conditions and regional water balance aspects in the Draacatchment SE Morocco. Proceedings Water Management and Soil Conservation in semi-arid Environments. 14th Conferenceof Int. Soil Conservation Organization, 110 - 111. Marrakech.Sepaskhah, A.R., A.R. Bazrafshan-Jahromi & Z. Shirmohammadi-Aliakhbarkhani, (2006): Development and Evaluation of aModel for Yield Production of Wheat, Maize and Sugarbeet under Water and Salt Stresses. Biosystems Engineering93(2), 139 - 152.Sinclair, T.R. & R.C. Muchow (2001): System analysis of plant traits to increase grain yield on limited water supplies. AgronomyJournal. 93, 263 – 270.Tsuji, G.Y., G. Hoogenboom & P.K. Thornton P. K. (Eds.) (1998): Understanding options for agricultural production. Dordrecht,NL.
Subproject B4 IMPETUS 243Teilprojekt B4Modellierung von Landnut<strong>zu</strong>ngsveränderung vor dem Hintergrund knapperRessourcen und globalisierter AgrarmärkteModelling of land use changes against the backgroundof scarce resources and globalized agricultural marketsAntragsteller / ParticipantsDr. I. Evers (Koordinator)Institut für Agrarpolitik, Marktforschung und WirtschaftssoziologieProf. Dr. Th. HeckeleiInstitut für Agrarpolitik, Marktforschung und Wirtschaftssoziologie,Universität BonnFach / DisciplinePolitikinformationssystemePolicy information systemsPolitikinformationssysteme, ÖkonometriePolicy information systems, EconometricsZusammenfassungÖkonomische Analysen sowohl der Wasserverteilung als auch der Auswirkung von Ressourcenübernut<strong>zu</strong>ngsind wesentliche Bestandteile im integrativen Wassermanagement. Dies gilt insbesondereauch für das Drâa Ein<strong>zu</strong>gsgebiet im südlichen Marokko, da in den letzten Jahren durchgeringe Wassermengen im Mansour Eddahbi Staudamm und eine höhere Ausbeutung derGrundwasserressourcen Wasser <strong>zu</strong>nehmend <strong>zu</strong> einer knappen Ressource wird. LandwirtschaftlicheProduktion und demnach das Einkommen der Landwirte im Drâa Tal sind jedoch abhängigvon konstanter Bewässerung. Dadurch steht ein integratives Wassermanagement im Drâa Talvor der Herausforderung einen nachhaltigen Ressourcenschutz mit sozialer und ökonomischerStabilität der Region in Einklang <strong>zu</strong> bringen. Im Rahmen des Teilprojektes B4 wurde ein integrativesManagementmodel MIVAD entwickelt, welches unter dem Ziel der ökonomischen Maximierungweitere Aspekte des Wassermanagements integriert. MIVAD bildet den Wasserverbrauch inden sechs Oasen entlang des Drâa Flusses mit Hilfe eines Knotennetzwerkes ab, und simuliert inder Modelliersprache GAMS rekursiv-dynamisch über die Jahre auf monatlicher Basis. Durchagronomische, hydrologische und ökonomische Komponenten können die unterschiedlichen Aspektedes Wassermanagements behandelt werden. In Zusammenarbeit mit Teilprojekt B2 wurdedie hydro-geologische Komponente im Model MIVAD angepasst und abgestimmt. Erste Szenarienberechnungenzeigen die Auswirkungen ökonomischer Politikinstrumente des Wassermanagementsauf die Ressourcenverfügbarkeit in den nächsten Jahren.SummaryEconomic analyses of the allocation of water as well as the depletion of water resources areessential aspects of an integrated water management. This is especially important in the Drâacatchment as the decreasing water availability in the Mansour Eddhabi reservoir and the exploitationof groundwater resources for irrigation purposes has lead to an increasing water scarcity
244IMPETUS Subproject B4in the region. However, agricultural production and farm incomes are dependent on the reliableprovision of irrigation water. Hence, an integrative water management in the Drâa valley facesthe challenge of achieving both sustainable resource use and social and economic stability. Theintegrated simulation model MIVAD (“Modèle Integrée du Vallée du Drâa”) has been developedwithin the sub-project B4 as a holistic approach towards water management, driven byeconomic optimisation of resource use. MIVAD embodies the water use system in the six oasesalong the Drâa valley in the form of a knot-link network. Economic, hydrologic and agronomiccomponents are combined to represent different facets of interdisciplinary water management.MIVAD is a recursive-dynamic model with respect to inter-annual simulation steps, while thetwelve months simulated within a year are solved simultaneously. Groundwater dynamics havebeen implemented and validated in cooperation with sub-project B2. First scenario calculationsshow the effects of the introduction of policy instruments on the allocation and distribution ofsurface and groundwater resources up to 2020.Problem statement and research objectivesAgriculture in Morocco takes up a share of 16.7 % of GDP (World Bank, 2005), with 14% of thearable land under irrigation (FAO, 2004). In contrast, approximately 88% of the arable land isirrigated in the Drâa Valley in southern Morocco (CIHEAM, 2000). The region is facing semiarid climate conditions with average rainfall of 106mm in Ouarzazate and Zagora 72mm (Ouhajou,1996), which still much less than average rainfall on the national level of 346mm per year(FAO, 2005). Agriculture is an important contribution to household income and food whereasagricultural production is largely reliant on irrigation water. However, surface water has becomescarcer during the last years as a result of a continuing drought. Farmers have increasingly substitutedriver water irrigation by more expensive but more reliable groundwater irrigation in thelast years. This has led to an unsustainable depletion of the resource and hence effects on agriculturalproduction and farm income.Thus, modelling the inter linkage in a river basin catchment is important for analysing and evaluatingpossible policy options for an integrated water management. Initially, a modelling approachwas used on the basis of the CAPRI model developed at the Institute for Food and ResourceEconomics (ILR) (former Institute for Agricultural Policy, University of Bonn). For betterintegration of different hydro- and hydro geological modules it was decided that an integratedriver basin model on the basis of a river basin model developed by IFPRI 6 (Rosegrant et al.2000) would be more suitable for addressing the research question.The following major scientific achievements (‘milestones’) were suggested in the research proposalfor the 2nd phase of IMPETUS:• Programming of an integrative river basin model with the aim of optimizing water allocationin the river basin in an economic manner• Complementation of a model database6International Food Policy Research Institute, Washington, D.C.
Subproject B4 IMPETUS 245• Including meteorological- , hydrologic, and hydro- geologic components• First presentation of plausible development paths through scenario simulationsResearch activities in the second phaseField researchAn agro-economic survey has been conducted in the six oases along the Drâa River in autumn2005 and in the basin of Ouarzazate and in the Dades valley in spring 2006. Data collection includesagricultural production data on different crops, agricultural production costs, irrigationtechniques, amount of water applied to crops and costs for irrigation. The aim of the survey wasto (1) evaluate the secondary data which is currently used as an input in the model and to (2)calculate irrigation costs.Interview in Igdâoun (Tinzouline)Data base compilationData from different sources had been collected by the beginning of 2004, comprising officialdata from national sources (especially the ORMVAO) and international bodies, and data representingresults from other research in IMPETUS. The data was evaluated for consistency andincorporated to a large extend into the MIVAD model.Economic and Environmental ModellingMIVAD (“Modèle intégré dans la vallée du Drâa”) is constructed as a hydrologic-economicoptimization model programmed in GAMS 7 with a node network representing demand and supplynode for each of the six oases: Mezguita, Tinzouline, Ternata, Fezouata, Ktaoua andMhamid. MIVAD acts as a centralized planner to allocate water resources of the Drâa Region todifferent users in an economically efficient manner to obtain the maximum utility for the region.Spatial relationships are represented in a node network representing different in- and outflows,7 GAMS: General Algebraic Modelling System
246IMPETUS Subproject B4barrages, reservoirs and water demand sites. Water distribution is modelled between the nodes.The network of the Drâa river basin actually starts with the inflow node that defines exogenouslyfor each month Mansour Eddahbi reservoir inflow. Agricultural production is represented as alinear programming exercise involving six virtual “oasis farms”. The response of crop yields onwater stress is represented with a modified Penman-Monteith function (Allen et al., 1998).Moreover, MIVAD contains a variety of constraints, bounds and balance equations related tohydrology (river, groundwater and reservoir balance), agronomy (crop yield response, area andcropping mixes) and general technological aspects (hydropower, pumping by public and privateagents) all of which have to be controlled for. The model is run over several years as a recursivedynamicmodel, with each year divided into twelve months which are solved simultaneously.Within the scope of the problem cluster and interdisciplinary exchange the hydro- geologicalcomponent has been adjusted with the hydro-geologist of Bonn (Heidecke, Kuhn, Klose, 2006).The first simulation results have been validated with hydro-geological models of sub-project B2.Multidisciplinary activitiesResearchers of workpackage B4 became leading scientists in the inter-disciplinary problem cluster(PKs):PK Ma-E.1: Economic Aspects of Water Management in the Drâa BasinSimulation of scenariosScenario simulations were started as soon as the recursive-dynamic version of the interdisciplinarymodel MIVAD had been finished in the beginning of 2006. Important inputs were deliveredfrom the hydro-geologist of IMPETUS. Thus the special characteristics of groundwater flowscould be incorporated into the groundwater component in MIVAD and results compared withmodels run by hydro-geologists in IMPETUS.Results of researchSurvey ResultsFrom the agro- economic survey agricultural production and gross margins as well as costs forirrigation have been calculated and further incorporated into the MIVAD model. First calculationresults for gross margins can be seen in Tab. B4.1 for wheat and alfalfa.
Subproject B4 IMPETUS 247Tab. B4.1:Gross margins and production costs for wheat and alfalfa in the Drâa BasinWheatAlfalfaYields (kg/ha) 1912 735Price per kg (Dh) 4 2Total groundwater irrigation cost (Dh/ha) 762 540Machinery cost (Dh/ha) 878 647Cost for seeds (Dh/ha) 679 581Fertilizer cost (Dh/ha) 1037 275Total variable costs (Dh/ha) 3356 2043Gross margin per ha 4292 -573Source: Farm Survey, 2005 and own calculationsNote: Labor costs have not been taken into account. Moreover, it is assumed that irrigation costsare all variable costs (predominantly fuel) as farmers usually do not take the depreciation of motorpumps or other irrigation technologies into account. Average gross margins are not weighted forindividual farm sizes. Results are derived from sample of 60 farms. Rate of exchange to US$: 1Moroccan Dirham ~ 0.12 US$ (April 2006)The source of irrigation water is varying in each oasis according to the availability of surface andgroundwater. Fig. B4.1 shows the use of irrigation water use in the oases. The southern oasis useless groundwater than the upstream oases as farmers hardly have access to wells.10080%6040RiverGroundwaterBoth200Mezguita Tinzouline Ternata Fezouata Ktaoua MhamidFig. B4-1:Principal source of irrigation water in each oasis (in %), Source:Farm Survey, 2005 and own calculations, from a sample of 115farmsVariable costs for pumping water are fairly high in the Drâa Region compared to the charge-freesurface water from the Drâa River. Farmers need up to one and a half litres of petrol per cubicmeter of water depending on the condition of the motor pump. Furthermore, lubricant oil needsto be changed regularly to ensure the reliability of the pump. Operation and maintenance costs ofpumps account for 500 Moroccan Dirham on average per pump and year. On average, farmers inthe Drâa Region pump around 17m³ of water per hour (see workpackage B2-5). This amounts tovariable pumping costs of 0.58 Moroccan Dirham per cubic meter of irrigation water depending
248IMPETUS Subproject B4on the capacity and efficiency of the motor pump as well as local petrol prices according to irrigationcosts reported during the farm survey in autumn 2005.MIVAD Model ResultsThe variable costs for irrigation have been introduced in the MIVAD model: The following resultsshow first scenario calculations for a ten year period, simulating an increasingly severedrought and farmers’ adaptation under two different assumptions on the cost of groundwater use.The first year is assumed to be a ‘normal’ year with average rainfalls. Surface water availabilityis simulated to become scarcer each year with a decrease by 14.3 percent annually, arriving at25% of initial surface water within the ten year period. Population growth within the ten years inthe Drâa valley means that demand for drinking water will increase over the simulation period.We assume demand increases of 3.1 percent annually for urban and 0.8 percent for rural areas(Penitsch et al., 2005). Furthermore it has to be noted that the reservoir is not used for risk managementto tackle the scarcity problem, which may become the subject of future research.The simulations can be regarded as preliminary results of the calculation of the IMPETUS scenariosM2 and M3. For the two scenarios we assume pumping costs of 0.58 Dirham 8 (scenarioM2) and 0.70 Dirham 9 (scenario M3) by taking investment and operation and maintenance ofwater pumps into account.350,001,20300,001,00%, Mio DH, Mio cbm250,00200,00150,00100,000,800,600,40DH/cbm50,000,200,001 2 3 4 5 6 7 8 9 10YearShadow ag water price (DH/cbm)Ag river water use (mio cbm)Ag groundwater use (mio cbm)Total ag water use (mio cbm)Ag profits total (mio DH) Use of available crop area (%)0,00Fig. B4-2: Calculations for groundwater pumping costs of 0.58 Dirham (Scenario M2)8The average costs of 0.58 DH per m 3 has been derived from own survey work, involving the variable costs ofgroundwater water pumping only.9 By assuming variable costs of 0.58 DH per cubic meter plus an additional water charge of 0.12 DH per m³.
Subproject B4 IMPETUS 249With pumping costs of 0.58 Dirham per cubic meter the agricultural water shadow price increaseswith the decreasing availability of surface water from the Drâa River. However, with theincrease of groundwater use in the seventh year the shadow price falls shortly to under 0.60 Dirham.Profits from agricultural production decrease constantly from over 200 million Dirham toless than 30 million Dirham.The figure above shows the same scenario with the assumption that farmers incur costs of 0.70Dirham per cubic meters for groundwater pumping.%, Mio DH, Mio cbm350,00300,00250,00200,00150,00100,0050,000,001 2 3 4 5 6 7 8 9 10Year1,000,900,800,700,600,500,400,300,200,100,00DH/cbmShadow ag water price (DH/cbm)Ag groundwater use (mio cbm)Use of available crop area (%)Ag river water use (mio cbm)Ag profits total (mio DH)Fig. B4-3: Calculations for groundwater pumping costs of 0.70 Dirham (Scenario M3)With pumping costs of 0.70 agricultural water shadow prices remain more stable than withpumping costs of 0.58 Dirham per cubic meter. The amount of groundwater pumped increaseslater than before as groundwater has become more expensive. However, the use of available croparea decreases by nearly fifty percent over the years, and thus much more strongly than in theprevious scenario, indicating a high sensitivity by farmers to groundwater pumping costs. Theeffect of the scenarios on the groundwater table of the different oases can be seen in the twographs below.
250IMPETUS Subproject B42020Meter (m)15105Meter (m)1510501 2 3 4 5 6 7 8 9 1001 2 3 4 5 6 7 8 9 10YearYearGW1 GW2 GW3GW4 GW5 GW6GW1 GW2 GW3 GW4GW5 GW6Fig. B4-4:Groundwater table in meters of the six oases over a ten year period at pumping costsof 0.58 Dh/m³ and 0.70 Dh/m³Pumping costs of 0.58 Dirham per cubic meter lead to a faster descent of the groundwater tablethan with estimated higher costs for pumping. Agricultural profits vary between the oases, andthe effect of the drought has different impacts on each of them depending on the endowment ofthe oases with groundwater resources and capital invested in perennial crops. Particularly theshare of date palms in the cropping mix is important, as it is assumed that the area under theseperennial crops is not easily reduced in order not to diminish the long-term capital base of thefarm.60605050Mio . Dirham40302010Mio Dirham4030201001 2 3 4 5 6 7 8 9 1001 2 3 4 5 6 7 8 9 10YearYearA1 A2 A3 A4 A5 A6A1 A2 A3 A4 A5 A6Fig. B4-5:Agricultural profits for the six oases in million Dirham at pumping costs of 0.58 Dh/m³ and0.70 Dh/m³These scenarios give a first example of the model for supporting real decision making processes.The simulation of different water prices is only one example how the model works as a policytool. With the integration of different hydrological and hydro- geological modules and the adaptationon the specific nature of the oases belt, the results give a better picture on the effect ofwater management policies on the utilisation and degradation of the resource.LiteratureAllen, R. G., Pereira, L.S., Raes, D., Smith, M., 1998: Crop evapotranspiration- Guidelines for computing cropwater requirements. FAO Irrigation and Drainage Paper No. 56, pp. 65- 86.CIHEAM 2000: Roles des services d’appui pour la dynamisation des association d’usagers des eaux agricoles- casdes L’O.R.M.V.A. de Ouarzazate, Montpellier.FAO 2004: Morocco Statistical Country Profile 2004. http://www.fao.org/es/ess/yearbook/vol_1_2/pdf/Morocco.pdfFAO 2005: L’irrigation en Afrique en chiffre - Enquete Auqastat 2005. FAO Rapports sur l’eau 2005 No. 29. Rome.
Subproject B4 IMPETUS 251Heidecke, C., Kuhn, A., Klose, S., 2006: The Impact of Drought in the Drâa Basin in Southern Morocco on Groundwater Use.Paper and Poster presented at the International Conference of Economics of Poverty, Environment and Natural ResourceUse. 17-19 May 2006. Wageningen, the Netherlands.Ouhajou, L., 1996: Espace Hydraulique et Société au Maroc- Cas des Système d’irrigation dans la vallée du Drâa. Faculté desLettres et des Sciences Humaines. Thèse et Mémoire. Agadir.Penitsch, R., Rademacher, C., Rössler, M., 2005: Population Dynamics in the Drâa Catchment. Poster presented at the GLOWAconference, Cologne 18.-19.Mai 2005.Rosegrant, M.W., Ringler, C., McKinney, D.C., Cai, X., Keller, A., Donoso, G., 2000: Integrated economichydrologicwater modelling at the basin scale: the Maipo river basin, EPTD Discussion Paper No. 63. IFPRI.Washington, D.C.World Bank 2005: Morocco at a Glance.http://siteresources.worldbank.org/INTMOROCCO/Overview/20852528/mar_aag.pdf
Subproject B5 IMPETUS 253Teilprojekt B5Soziokultureller Wandel und Wassernut<strong>zu</strong>ng im Ein<strong>zu</strong>gsgebiet des DrâaSocio-cultural changes and water use in the Drâa-CatchmentAntragsteller / ParticipantsProf. Dr. M. Rössler (Koordinator)Institut für Völkerkunde, Universität <strong>zu</strong> KölnProf. Dr. M. CasimirInstitut für Völkerkunde, Universität <strong>zu</strong> KölnFach / DisciplineEthnologie:Ökonomisch, soziopolitisch, kognitiv,demographischSocial anthropology:economic, socio-political, cognitiveand demographicEthnologie:Ökonomisch und kognitivSocial anthropology:economic and cognitiveZusammenfassungGemeinsames Ziel der verschiedenen ethnologischen Forschungsvorhaben im Drâa-Ein<strong>zu</strong>gsgebiet war es, Beziehungen zwischen gesellschaftlichen und kulturellen Entwicklungenund den Veränderungen der natürlichen Umwelt <strong>zu</strong> untersuchen. Vor allem der Wassermangelder letzten Jahre übte starken Einfluss auf die sozialen Systeme aus und beeinflusste die Strategiender Bevölkerung im Umgang mit der Dürre. Bei unseren Untersuchungen konzentriertenwir uns auf verschiedene Themenfelder, bei denen Auswirkungen der Veränderungen der <strong>zu</strong>rückliegendenJahre besonders deutlich werden. Da<strong>zu</strong> zählen vor allem lokale Systeme des LandundWassermanagements, die Arbeitsmigration, die demographische Entwicklung der Region alseine der wichtigen „driving forces“ für die Szenarioentwicklung sowie der Tourismussektor alsModernisierungselement und potentielle Einnahmequelle außerhalb der Landwirtschaft.Ethnologische Daten wurden vor allem durch intensive Feldforschungen mittels teilnehmenderBeobachtung, Surveys, sowie einer Vielzahl von offenen und strukturierten Interviews gewonnen.Gesprächspartner waren Vertreter staatlicher Institutionen, Notabeln, lokale Experten undHaushaltsvorstände. Um die Forschungsergebnisse der Szenarioanalyse und der Einbindung inInformations- oder Decision Support-Systeme <strong>zu</strong>gänglich <strong>zu</strong> machen, wurden die gesammeltenInformationen in Expertenmodelle eingebunden und analysiert.Im geographisch, politisch und ökonomisch marginalen Drâa-Ein<strong>zu</strong>gsgebiet wird die Wassernut<strong>zu</strong>ngdurch ein komplexes System ererbter oder erworbener Wasserrechte geregelt. Die Verteilungerfolgt über ein Kanalsystem, das kommunal errichtet, verwaltet und verteidigt wird.Obwohl sich die Ausprägungen der Bewässerungsmanagements regional unterscheiden, existierenprinzipiell vergleichbare Systeme im Hohen Atlas, dem Becken von Ouarzazate und im eigentlichenDrâa-Tal südlich des Mansour Edhabi Damms. In den feuchteren Gebirgsregionenmit ihrer generell besseren Wasserverfügbarkeit zeigt sich eine größere Variabilität der Systemeim Vergleich <strong>zu</strong>m Drâa-Tal. Dort hat der durch die unregelmäßigen Ablässe des Staudammes
254IMPETUS Subproject B5verursachte Wassermangel <strong>zu</strong> einer weitgehenden Aufgabe der klassischen Managementsystemegeführt. Die örtlichen Bauern reagierten mit dem Bau von mit Motorpumpen ausgestattetenFeldbrunnen, die individuell genutzt werden und bereits <strong>zu</strong> einem deutlichen Absinken desGrundwasserspiegels geführt haben. Die Untersuchungen haben aber auch gezeigt, dass Wasserbesitznach dem traditionellen Recht immer noch eine wichtige Kategorie für Prestige in denDörfern darstellt, obwohl die materielle Bedeutung durch das weitgehende Fehlen des Oberflächenwassersnicht mehr besteht.Eine Reaktion auf die anhaltende Wasserknappheit ist die in den letzten Dekaden stark <strong>zu</strong>nehmendeAbwanderung bedeutender Teile der arbeitsfähigen Bevölkerung in die großen marokkanischenKüstenstädte. Gleichzeitig kam es aber auch <strong>zu</strong> lokalen Urbanisierungsprozessen, vondenen die Provinzhauptstädte Ouarzazate und Zagora, aber auch mittelstädtische Zentren wieBoulmane und Agdez profitierten.Obwohl der Tourismus in Südmarokko eine expandierende Industrie bildet, ist sein Einfluss aufden lokalen Arbeitsmarkt begrenzt. Hauptnutznießer sind internationale Reiseveranstalter undihre Hotels in den großen Städten. Lokale Unternehmer profitieren nur in wenigen touristischenAnziehungspunkten vom wachsenden Markt. Vor allem in den wüstennahen Oasen des südlichenDrâa-Tals können neu errichtete Luxushotels mit ihrem hohen Bedarf an Trinkwasser <strong>zu</strong> einerVerschärfung der ökologischen Probleme führen.SummaryThe common objective of the different anthropological research initiatives in the Drâa catchmentwas to link social and cultural developments to changes in the natural environment. Especiallythe water scarcity of the recent years has affected human behaviour and the strategies ofthe population to cope with the droughts. To achieve our goals, special attention was given toland- and water-management systems, the complex system of migration, the demographic developmentof the region as the key driving force to scenario creation, and the tourism sector as animportant element of modernisation and source of income beyond agriculture.Anthropological data have been collected through fieldwork, including participant observationin a local community, survey techniques and a multitude of open and semi-structured interviewsconducted with state agents, local notables, experts, and household heads. For scenario analysisand the projected inclusion into information or decision support systems, the findings are integratedand analysed with the aid of expert models.In the geographically, politically and economically peripheral region of the Drâa catchment,water allocation functions according to a complex system of inherited water rights using communallybuilt, managed and defended irrigation channels. Although the exact characteristic ofthe local irrigation methods and the relationship between water users varies, similar systemsexist in the High Atlas Mountains as well as in the Ouarzazate basin, and in the Drâa valleysouth of the Mansour Edhabi dam. In the wetter mountainous areas the water availability is generallybetter but shows a higher regional variability than in the Drâa valley. Here the lack ofwater from the dam caused an almost complete abandonment of the old system. Local farmersincreasingly reacted to periods of water scarcity through the building of wells operated by motorpumps, thus individually exploiting scarce subterranean aquifers. Research also showed that,
Subproject B5 IMPETUS 255even if water from the river Drâa is less easily available and materially important, its “ownership”as laid down in the “traditional” irrigation system, remains an important category of symbolicprestige throughout the villages.Following increased water scarcity, the region witnessed massive out-migration of large parts ofits population during the past decades, resulting in monetarisation processes and a decrease inimportance of agricultural production. Parallel to the observed rural out-migration were processesof urbanization. Beneficiaries were not only the large coastal cities, but also local centreslike the provincial capitals of Ouarzazate and Zagora and medium-sized towns like Boulmane orAgdes.Although tourism is an expanding industry in southern Morocco, the influence on the local labourmarked is rather small. Major beneficiaries are international tourist enterprises who runhotels and travel agencies in the urban centres. Moroccan entrepreneurs only benefit in sometourist hot spots. As water is a highly fragile resource, tourism, especially the big luxurious hotelsrecently constructed in the south, can increase the ecological problems.Water management in the Oasis of the Southern Draa Valley and among the Ait UnzarPastoral Nomads.Main objective of the research was to show how irrigation management in the south-MoroccanDrâa valley changed from local to state-led resource control on the background of an increasingwater scarcity. Further on the distribution as well as the daily and seasonal water consumptionamong the dwellers of the oasis and the pastoral Ait Ata nomads have been measured and thequality of the water was analysed. Resource management and power concepts are described anda historical overview on Morocco’s water policies and the development of South Morocco’s social,political, and economic structures is given (Liebelt, 2003). Since the region experiencedseasonal periods of drought throughout history, making water a scarce resource, and given thevillages’ hierarchical social structure, access to water was distributed unequally along variousethnically defined status groups.Beginning with the French colonisation of the region, control over water shifted from the localelites to the state. State-led reforms were motivated by economic considerations mainly, aimingat a commercialisation of local agriculture, and met an uncoordinated yet decisive resistancefrom the peasants’ side. By the construction of a large dam project in the early seventies, thestate drastically changed and restricted the peasants’ access to water from the river Drâa, onwhich it heavily depended for agricultural use. It was shown that in spite of this “modernisation”,“traditional” irrigation practices and concepts did not cease to exist. Thus, “old” villageelites very much dominate the irrigation institutions, which the state created in order to organisea “younger”, presumably more educated and “rational” generation.Nevertheless, out-migration and the decrease in importance of agricultural production resulted inmonetarisation processes. The local understanding of river water as a communally owned managedand defended resource resolved and the responsibility for sufficient water supply was increasinglyviewed on the state’s side.Research undertaken so far suggests that the understanding of complex local situations - inwhich resources are material and symbolic products rooted in power contests and state reforms
256IMPETUS Subproject B5are met with historically grounded mistrust - are crucial for the making and implementation ofreforms and policies.Water in Classical Islamic LawThis study aimed at a documentation of land and water in classical Islamic law with special regardto the Maliki school of law which prevails in Morocco.First of all, juridical and hydro technical terms and irrigation methods had to be identified. Differentnames for the same object occur as well as one expression denoting several things, e.g.qanat, khattara, faladj, foggara, are all names for underground channel system; saqiya: can meanan irrigation channel or a water wheel.Part of the survey was to search for juridical literature on water which had not yet been workedat. The non-juridical literature, however, did not deliver relevant information on the use and distributionof water. Unknown documents written by Maliki jurists were not found. Further searchin the Moroccan libraries and archives, esp. at the zawiya of the Nasiriya-brotherhood of Tamgrut/WadiDraa, is highly recommended, since many of the manuscripts, records, contracts andother documents have neither been edited nor even known up to the present. The Koran does notcontain direct rules on the disposal of land. Jurists disagree as to whether the prophet prohibitedall kinds of rental and profit-sharing between a landowner and a farmer. Lease contracts againsta fixed sum of money are widely approved. Land can be subject to private property after a legalcontract such as purchase, or by cultivating “dead land” (mawat). The Maliki school validatesprivate ownership of pasture. Concerning water, the Koran emphasizes its central meaning asGod’s gift to human beings, animals and plants in several verses (e.g. 21:30; 30:24; 13:4). TheProphet’s tradition (hadith) is more concrete about the use and distribution of water. Giving it tomen or animals to drink will be rewarded; (a surplus of) water should not be withheld; (a surplusof) water should not be sold; the farmer upstream irrigates his fields, before he sends the waterdown to the next neighbour; muslims (or men) are partners in water and pasture. Drawing uponthese traditions and the few statements of the early authorities of Islamic law, later jurists establishwater laws to meet the requirements of local agencies, the views of the respective school oflaw and their own personal opinions. Generally, water is the common property of all muslims,free for everyone to use for quenching his and his animals’ thirst and for irrigating his fields,without disturbing other users. An insufficient amount of common water is distributed accordingto the principle: first come, first served. This explains the priority enjoyed by an upstreamer thatis presumed to have used the stream water before the other landowners did. Private ownership onwater is possible after investing one’s money and/or efforts, such as filling free water into a bottle.Most learned men agree that water in a well or a spring on private land also belongs to theowner of the ground. Digging a well on free land gives the excavator a priority in using the water,though after his departure the water is free for all. Selling water is disputed; the Malikis allowtrading in private water and in irrigation rights (shirb); even a thirsty man has to pay for wateras long as has the means to do so.In Morocco and throughout the Islamic world, water and land laws are in practice not only basedupon traditional Islamic rules, but furthermore upon local custom, Berber law, subsequent legaljudgements and, in modern times, European influence, differing from region to region.
Subproject B5 IMPETUS 257Knowledge systems and the socioeconomic conditions of water useAgricultural strategies in the High Atlas MountainsDuring the last phase, detailed studies in the upper Assif N’Ait Hamed were completed. To permitthe transfer of the findings to the larger area covered by the PK-Ma-L.1 the research focuswas extended to 17 villages belonging to the Ighil Mgoun commune. In addition to interviewsand observation, a standardized questionnaire co-developed with the B4 sub-project was used.Five settlements are located in the area of the detailed study. Two of them, the upper Tichki andthe upper Ameskar (Ameskar Fougani) have been closer investigated. Both villages share manysocial and economic features, but there are also some cultural and political differences. People inTichki belong to the Ait Toumert fraction, while People in Ameskar are part of the Ait Hamed, alarger group inhabiting the middle and lower parts of the valley, down to the confluence with theMgoun River.Permanent settlement in Tichki in the present form seems to be a relatively young phenomenon.Up to the 1970s some families still lived in the Tighimt, a small fortification at the entrance ofthe village. Families started exploiting the region as pastoralists. Later they settled permanent tocultivate the soils. Tichki people originate from Thoughza. Still many family links exist to thissettlement, and a number of Tichki citizens own land in Toughza and vice versa. Tichki is asmall village with about 200 inhabitants living in 28 households. Households are rather small:Nine households have 5 or less members. Only 2 have 15 and 23 members respectively. Theaverage household size is 7,5 P/H. Half of the households have between 4 and 6 members. TheFamilies belong to four „Grande Families“, the “original” or first permanent settlers in the valley.Fig. B5-1:The Ighil Mgoun community
258IMPETUS Subproject B5Ameskar Fougani is slightly larger (333 inhabitants in 31 households), older and more compactedthan Tichki. The size of an average household (11,4 P/H) is larger. Two households areexceptional large with 43 and 35 members respectively.The agricultural system has a lot of parallels, although the higher altitude of Tichki (Tichki 2300m against 2000 m Ameskar Fougani) often prevents a second annual culture. Maize, barley, potatoes,carrots and turnip are the principle crops, produced for domestic consumption only.Fruits, nuts and wood are cash crops. In the higher regions apples recently became the most importantcash crop.Agriculture is mainly based on irrigation, but in the mountains, in contrast to the region furthersouth, rain plays an important role. In both villages water is distributed with a Nouba system,whereby families own individual rights on water. Owners can irrigate during a certain time period.In Tichki the Nouba is divided into 5 sections, related to the “grande familles” of the village.A complete Nouba cycle lasts 12 days. After that period, the system starts again. In additionpeople in Tichki benefit from sources, which feed the river through a side valley. Here wateris distributed with a different system, according to the location of a farm. Irrigation starts at theupper parts of the valley, and by consecutively irrigating field after field, after about twelve days,the lowest part of the valley is reached.Ameskar Fougani shares his ten days Nouba with the lower Ameskar (Ameskar Tahtani). Threedays of irrigation are left for Ameskar Fougani, while people Ameskar Tahtani have the right toirrigate their fields during six days. On the tenth day the water returns to Ameskar Fougani. Oftenmore than three rotation cycles are needed to complete the irrigation of all fields.The water management systems described here are a reaction to the present scarcity of water.Although the possession of water rights is a wealth factor, in a situation of abundance of water itwill not be used to mark social status. In everyday village live, solidarity prevails. A good examplewas the 2004 season, when the abundance of rain had effects on the strictness of the irrigationsystems. The strict Nouba system was abandoned and farmers irrigated their fields accordingto the need.Extended study in the Ifre catchmentThe extended survey was carried out in 17 villages of the Ighil Mgoun community which almostcorrelates to the hydrological defined Ifre-catchment (Fig. B5-1). The findings proved that thesocial formation, the agricultural system, and the management strategies described for the AssifN’Ait Hamed, could be transferred to the other villages and sub-catchments of the region. The“tribal” boundaries present in the “commune” Ighil Mgoun are no contradiction to this generalobservation. Although playing no important role, they could cause or enhance conflicts betweendifferent actors. The tendency to show solidarity is larger between villages belonging to the sametribal fraction.Besides the relative homogeneity of the region, differences important for the understanding ofland use strategies and the optimisation of management techniques can be defined:Villages situated at the same river can either share irrigation water – as is the case betweenAmeskar Fougani and Ameskar Tahtani – or use the available water regardless of the needs ofother consumers on the lower part of the same watercourse. Investigations show that alliances
Subproject B5 IMPETUS 259between villages are especially helpful in dry years, when the lack of water aggravates the latenttendency to conflicts between up- and downstream villages. In wetter years alliances are lessimportant as long as enough water is available.The water scarcity does not affect all villages at the same level. According to the spatial location,we can differentiate three characteristic situations of water availability:• Location at a big river – good water availability, strategies of the farmers dominated bythe lack of agricultural surfaces. (Example: villages at the Mgoun River)• Location at a tributary stream – adequate water availability. Frequent water distributionalliances between villages. Extension of agricultural area scarcely possible due to the lackof appropriate land and water. (Example: Assif N’Ait Hamed)• Location on a plateau or downstream smaller rivulets – Water availability difficult. If noalliances often conflicts in dry years. Arable land often available, but not cultivable dueto the lack of water (Example: some villages at the Taoujgalt plateau)Besides hydrological, demographical and land cover information, this typology is the basis formodel development in the PK-Ma-L.1.Migration and socio-economic changes in the Drâa Valley, Case study Ouled YaoubThe Arabic-speaking village Ouled Yaoub in the southern part of the oasis Tinzouline (middleDrâa Valley) is inhabited by different ethnic groups. Today the vast majority of them are farmers,but until the 18 th century all the Arab groups were nomads protecting the sedentary, indigenousgroup called “Drawa”. For their protection, they received land and forced the ‘Drawa’ tocultivate their fields. The focus of the study is the examination of socio-economic changes due tomigration. Were the socially deprived groups like “Drawa” and Haratin able to change their lowsocio-economic status due to migration, and which groups did profit most?All male, grown-up inhabitants of the village are part in one of the four social groupings (arab.firqat) that form the village council. Every group chooses one representative who is mainly responsiblefor settling conflicts, above all disputes about land and water rights. Two groups haveonly Arabic members, the Ouled Shibani and al-Rughaba (composed of the two groups Ouled l-Arguid and Raghaba). The third group called Ahl Tuloud is mixed (68% are Arab and 32% areHaratin). The fourth group are ‘the Drawa.’Labour migration to Moroccan towns and to foreign countries became the most important economicstrategy since Morocco’s independence in 1956. In the 1970s and 1980s the numbers ofmigrants rose slowly due to periods of drought. From the 1990s onward a massive migrationtook place due to extended periods of drought and the critical water situation.
260IMPETUS Subproject B540,0Number of households, persons and male migrants of each social groupOuled Yaoub, November 200535,030,025,020,0Combined togroup Raghaba15,010,05,00,0Drawa Ahl Tuloud Ouled Shibani al-Rughaba Ouled l-Arguidnr. migrants (%) nr. households (%) nr. persons (%)Fig. B5-2: Number of households, persons and male migrants of each social groupToday, migrants come from all age groups – the longer the drought lasts the younger the migrantsare. Some families are forced to send their sons into migration at the age of 12 or 13 inorder to help for the family’s economic survival. The vast majority of them will migratethroughout their active work life. Most migrants’ families stay in the village, resulting in spatiallydissolved families. The migrant’s wife is supposed to care for her husband’s parents andraise the children. This arrangement secures the migrant’s strong ties to the village and the economicsupport of his parents. Normally, migrants return home only 2-4 times a year, so that hiswife and children are alienated from him.During the last years the number of whole families who left the village to seek a better life in atown was rising continuously. From the originally 125 households of the village, 23 houses aretemporarily or constantly deserted. In 2004/05 at least seven families had left Ouled Yaoub forgood.Many farmers pessimistically stress the lack of prospects for life in the Drâa Valley due to thelong times of drought, the decline of agricultural production, the decline of prices for dates, thelack of jobs and aid programmes etc. Even with more than 80% of the male population workingabroad, life is difficult. The income sent home by the migrants can in most cases only guaranteefor their family’s basic needs. Investments in agriculture become more and more expensive. Theoperation of motor-pumps for garden wells is costly as petrol prices are high (on average 7-10 €each irrigation day). In addition, due to the declining groundwater level wells have to be deepenedonce or twice every 2 years.Fig. B5-2 shows that all ethnic or social groups are heavily involved in migration. The twomembers of the Raghaba grouping have the biggest amount of permanent out-migration. Formerlythey, together with the Ouled Shibani, were the most important and prestigious lineages.Only definite migrants do not count in the village council any more.Today, the Drawa and Haratin who are still primarily residing in extended families do have astanding in the council. Due to successful migration, they were able to invest in agriculture. They
Subproject B5 IMPETUS 261bought land and water rights from their Arab neighbours, and constructed garden wells suppliedwith motor-pumps. Fig. B5-3 demonstrates this development. Agriculture is only possible withmotor-pump irrigation as dam openings of the Mansour Ed-Dahabi dam are rare. Traditionalirrigation via Oued Drâa is practised only 4-6 times a year. Nevertheless, it is still prestigious toown water rights. For this reason ‘Drawa’ invest in both irrigation systems.50,0Owner of waterrights and wells (%) according to social groupsOuled Yaoub, March 2004 (n=57)45,040,035,030,025,020,015,010,05,00,0Drawa Ahl Tuloud OuledShibanial-Rughaba Ouled l-ArguidSocial groupsgroup notidentifiedForeignownerReligiouspossession(Habbous)Water rights (%) Wells (%)Fig. B5-3:Owner of water rights and wells (%) according to social groupsPreliminary results from a mapping of fields and wells of the Ouled Yaoub gardens (120 ha ofarable land) show that “Drawa” own about 40% of the fields, including the vast majority of middle(0,125–1 ha) and large-sized fields (1,5-9 ha). They have a good reputation as farmers, “havingenough physical force and love for the land.” Other groups seem to invest more money ineducation. They are to a bigger extent depending on the migrants’ salaries.Results of this study flow into the problem cluster Ma-G.1 “Population dynamics” and the developmentof an expert model about demography and migration.Domestic water consumptionA representative survey about the domestic water consumption of 1/3 of the population was conductedin November 2005. One important result is that large-size families use less water per personand day (20,9 l) than middle (31,5 l) and small-size (39,8 l) households. The data of waterconsumption in the kitchen can be interpreted accordingly. In 2005 26,5% of the people lived insmall families, 44,1% in middle-size families and 29,4% in large-sized ones. Especially in Arabicgroups, there is a strong tendency towards middle and small-sized families which will affectdomestic water consumption negatively.All households keep some animals within the farmstead, above all sheep (n= 412) and somedonkeys and cattle. Sheep usually need 4 l/day.
262IMPETUS Subproject B5The results of this survey flow into the C.E.M. Drâa-model about domestic water consumptionwhich is developed in the framework of the problem cluster Ma-H.2 “Interaction between wateruse strategies and the groundwater- and soil conditions in the middle Drâa Valley.”Both themes, migration and domestic as well as agricultural water consumption, will be linked inscenario calculation.14,012,0Domestic water consumption per person according to family typeOuled Yaoub, November 2005 (n=34)total: 39,8 lwater consumption (l/day)10,08,06,04,0total: 31,5 ltotal: 20,9 l2,00,0small (1-4 p.) middle (5-9 p.) large (above 10 p.)Kitchen Drinking water Washing WC/shower Small gardenFig. B5-4:Population dynamics in the Drâa CatchmentDomestic water consumption per person according to family typeAnalyzing the living conditions of the population in relation to the use of water and land in thecatchment area of the Drâa river the population dynamics is an important indicator for socialchange. In order to meet the complexity of demographic processes, quantitative-statistical dataand qualitative social-scientific data were collected and evaluated on different spatial levels fromregional to local.DatabaseThe database consists of qualitative primary data and of quantitative secondary data. The databasewas complemented by field studies in the pilot communities Beni Zoli, and Ouled Yaoub,using participant observation as well as open and semi-structured interviews, experts consultingand situation reports. In addition, a regional survey was conducted in 13 villages with the help ofMoroccan assistants. The villages were chosen to achieve a maximum of heterogeneity. Theydiffer in location and size. Three questionnaires were used, which covered the levels of village,household and individual. Altogether 2059 persons, belonging to 133 households representing2.5% to 50% of the village population, were interviewed.The secondary data are generated by official publications of the „Direction de la Statistique”,especially the census data of 1994 and 2004, the Pager Zagora and the „Annuaire Statistique duMaroc” from the years 2002 and 2003. Moreover there is data from the reports of the „Ministèrede l’Agriculture”, the „Ministère de la Santé” and the „Ministère de l’Education”. An important
Subproject B5 IMPETUS 263data source is the census data of 1994, which is available at village level and the census data of2004, which, however, is only partly available at community level so far.Scenario creation with the help of demographic projections and expert modelsQuantitative demographic data, regarding migration, fertility, morbidity, age distribution andurbanization are analyzed, using the numerical model “Spectrum/Demproj”. Based on the 1994census data, first model runs were carried out to predict total population and population structureup to the year 2020. Three different IMPETUS scenarios were used. Scenario M 3 depicts a“business as usual”-situation, M 1 predicts a deterioration of the status quo while M 2 assumes apositive future development. The positive as well as the negative demographic scenarios showthat, even for extreme assumptions such as a disproportionate rising or falling fertility rate, littlesignificant change in population development up to 2020 are to be expected (Fig. B5-5). Themain cause is the rather prompt aim of projection of 2020; significant demographic change canonly be expected for longer-term projections, because demographic processes generally reactslowly to changes in the initial parameters.Population (in 1.000)1800160014001200100080060040020001982 1987 1992 1997 2002 2007 2012 2017876543210Total Fertility RateStatus Quo Scenario Positive Scenario Negative ScenarioStatus Quo Scenario Positive Scenario Negative ScenarioFig. B5-5: Population scenarios depending on the total fertility rate 1982-2020, Source: RGPH 1982, 1994Because demographic processes are not only determined by statistically ascertainable parameters,but also by social, cultural and economic factors, a primarily qualitative expert model is tobe developed. Including soft data, e.g. the driving forces that lead to a decision on migration, thecomplex reality can be better represented.Migration and urbanisationThe loss of crop income over several years leads to a high exodus in the male working population(31% of the male population in the survey communities), because there are no alternativeincome sources to subsistence maintenance through agriculture. Therefore, migration is the mostsignificant factor in the demographic dynamics, even if it is difficult to record, due to its highfluctuation.The most important targets of migration are supra-regional urban centres (77.6 % of the migrantsin the survey communities moved to urban centres outside the region). Generally, it can be statedthat urban centres grow more quickly compared to rural areas at regional as well as at national
264IMPETUS Subproject B5level. The urbanisation rate of the region of Sous-Massa-Drâa was at 18.7 % in 1994 and hadrisen to 19.2 % in 2004. It can be stated that there was only little population growth in the investigationarea between 1994 and 2004. In some rural areas there was even a decline in population.In urban areas it was significantly higher (3.1% on average) than in rural areas (0.8% on average).Causes are, apart from migration, a decreasing fertility rate (5.45 children per woman in1994 as opposed to 4.2 children per woman in 2004), longer intervals between childbirths, latermarriages and a high infant and mother’s mortality rate (only 17% of the childbirths are medicallyaccompanied). In summary, characteristics of demographical development appear to be alow over all growth rate, a high urbanisation and migration tendency and a constantly high mortalityand morbidity.The influences of tourism on water availability and water useTourism is an expanding industry in southern Morocco. As water is a highly fragile resource, tourism,especially the big luxurious hotels recently constructed in the south, can increase the ecological problems.The research region can be subdivided in three areas according to tourist usage.• The mountains of the High Atlas and the Saghro (small groups and individuals who aremainly hiking)• The basin of the river Dades with the two towns of Ouarzazate and Boulmane (primarilytourist accommodation within the organised mass tourism)• The area of the Draa-oasis and the rim of the Sahara in the southern part of the researcharea(bivouacs in the desert for all kind of tourists)Looking at the significance of tourism in the region it is useful to identify the main use of placesby tourists. The towns Ouarzazate and Zagora are important as strategic points for the touringtourism. As biggest cities, and situated on essential crossroads, the two towns provide major accommodationfacilities. The urban hotels, restaurants, supermarkets and petrol stations are thebiggest earners on the local tourist market.Other places with a high potential are locations of cultural interest, like the village of Ait Benhadou,which is registered as world heritage site by the UNESCO. In Ait Benhadou only a smallnumber of businessmen and workers do profit from the large number of daily visitors. Most touristsvisit Ait Benhadou only en passant, coming from or going to Marrakech. Since the villagewas connected to the public water supply three years ago, the number of traveller hotels and theamount of tourists staying overnight increased. Consequently the local businesses are makingbetter profits.Other important tourism spots are regions with extraordinary natural sights. Examples are thecanyon leading to the source of the river Dades, and the “Sahara desert” south of Zagora. In bothareas tourism, especially backpacker tourism is increasing. Therefore small businesses are expanding.Tourist habitsThe time between February and Mai is in all mentioned sub areas the peak season of the year.June is a very weak month and only individuals travel within this period. Between July and Sep-
Subproject B5 IMPETUS 265tember many Moroccan migrants living in European countries visit southern Morocco. Theymore and more come as tourists and not only to visit their homeland and families. Autumn is thesecond high spot for international tourists; the majority of them are making desert-trips. Mostpeople who are visiting the Draa and Dades-regions come in groups and by buses, organized byinternational tour operators. The routes diverge only in details. Groups stay in three and morestar hotels in the bigger cities. Only about 25% of all tourists visiting the region are individual orsmall group tourists. The number of young people looking for adventure in the mountains or thedessert was increasing in the last years. Their decision to visit special areas is often spontaneous.Frequently they are staying longer than the organised groups. They are the main users of thesmaller businesses (hotels, shops, restaurants) founded and managed by local people.Tourism as labour market and businessPeople working in the domain of tourism are mostly bachelor men between 20 and 30 years. Officialguides, managers of big hotels and owners of restaurants or small hotels are generally older(above 40).Three typical careers of men working in the tourism sector can be identified.• People with a formal education from the “academy of hotel management” in Ouarzazate.This education takes two years and often directly leads to a job in one of the big hotels.These jobs are mostly badly paid. Often people do not get contracts for more than sixmonths. It is rare to find former labourers owning an enterprise.• Young men who did live in regions with regularly tourist visits and who had only fewyears of formal education. They are looking for any possibility to join the tourist market.When they do have success, their surplus, contacts and ideas lead them to own enterprises.• Families living in areas with frequent tourist visits and a financial surplus. These familiesare often opening a small hotel, a bazaar or other tourist business. They stay in one placetrying to make her business growing.Bazaars for souvenirs are the second important business with some influence on the local economy.These bazaars are mainly owned by Moroccan people.Infrastructural factors determine the potential for tourist business. In southern Morocco, suitableroads and a good accessibility as well as the availability of potable water and electricity are theimportant infrastructural demands of tourists. Conflicts between farmer and the tourism industryabout fresh water were not recorded, and are also not expected, because the water consumptionof the tourism sector can be estimated being under 5 % of the total water use in the study area.Two economic strategies prevail in the tourism sector.• Small businesses founded by people living in tourist areas. These small hotels, bazaars orrestaurants are mostly founded as a side business to farming or besides having a regularfinancial support from family members in labour migration. The small surplus of thebusiness is often directly invested to enlarge the business, and not in the agricultural sector.
266IMPETUS Subproject B5• Businesses founded by investors, mainly big hotels. These hotels are often constructedwith the aid of national or regional programs. Most of the surplus goes to internationaltour operators and the hotel owners.The economic potential of tourism in the research region is, and will stay limited. Mostly internationaltour operators profit from the tourists. In some areas local people with small but growingbusinesses do have a bigger economic effect in the region. The number of employed workerswill not expand considerably.LiteratureCasciarri, B. (2003), “Rare Resources and Environmental Crises: Notes on Water Management Among the Ait Unzar Pastoralistsin South-eastern Morocco”, Nomadic Peoples, 7, 1: 177-186Casciarri, B (2005), “Coping with Shrinking Spaces: the Ait Unzar Pastoralists of Southern Morocco”, in CHATTY, D. (ed),Nomadic Societies in the Middle East and North-Africa: Entering the 21 st Century, Handbook of Oriental Studies, Brill:393-430.Casciarri, B. (in press), “Perceiving Drought and ‘Natural’ Stress among Nomads and Farmers of the Southern Dra Valley”, inCASIMIR, M., STAHL, U. (eds), Culture and the Changing Environment. Uncertainty, Cognition and Risk Managementin Cross-Cultural Perspective, Berghan, New York/Oxford.Hvezda, S. 2006 (in press). Water in Classical Islamic Law. In: Michael J. Casimir (Hrsg.) Kölner Ethnologische Beiträge Heft20.Liebelt, C. 2003. Die Wasserwirtschaft im südmarokkanischen Dratal in Spannungsfeld von lokaler und staatlicher Ressourcenkontrolle.In: Michael J. Casimir (Hrsg.) Kölner Ethnologische Beiträge Heft 7.
Part C IMPETUS 267Projektbereich CIntegration, Organisation und DatenmanagementPart CIntegration, organisation und data management
Subproject C2 IMPETUS 269Teilprojekt C2Datenmanagement und übergeordnete ArbeitenData and general managementAntragsteller / ParticipantsProf. Dr. P. Speth (Sprecher / Director)Institut für Geophysik und Meteorologie, Universität <strong>zu</strong> KölnProf. Dr. B. Diekkrüger (Stellvertretender Sprecher / Vice Director)Geographisches Institut, Universität BonnZusammenfassungDie IMPETUS Projekt Datenbank ist die zentrale Anwendung für das Datenmanagement. Sievereint Funktionalitäten für die Verwaltung von Informationen über Mitarbeiter, Publikationen,Download von Dokumenten oder Daten, Aktuelles, Veranstaltungen und die in IMPETUS verfügbarenDatensätze (Metadatenbank). Diese Informationen werden auf den IMPETUS Webseitenfür interne und externe Nutzer mittels Synchronisierung mit dem Datenbankserver und dynamischprogrammierter Webseiten bereitgestellt. Während der zweiten Projektphase wurdeinsbesondere die Metadatenbank integriert und die Aktivitäten für den Eintrag der Metadatenkoordiniert. Entsprechende Funktionalitäten für die Suche und Anforderung von Daten wurdenauf der Website eingerichtet. Die Dokumentierung und Katalogisierung der dezentral gespeichertenDaten wurde durch die Sammlung von relevanten Datensätzen <strong>zu</strong>r zentralen Speicherungkomplementiert. Damit wird das Ziel verfolgt, die in IMPETUS generierten Datenbestände<strong>zu</strong> sichern.Weiterhin erfüllte das Teilprojekt C2 verschiedene übergeordnete Aufgaben wie die Pflege derIMPETUS Website als interne und externe Kommunikationsplattform, die Unterstüt<strong>zu</strong>ng derTeilprojekte bei der GIS-Anwendung und Datenkonvertierung, dem Entwurf der “IMPETUSErgebnis Atlanten“ und der Redaktion der IMPETUS Mitteilungen.SummaryThe IMPETUS project database is the core application for data management integrating functionalitiesfor administrating information about participants, publications, document or datadownload, news and events as well as about the available datasets within IMPETUS (metadatabase).The IMPETUS web pages provide this information for internal and external users bymeans of synchronisation with the database web server and programming of dynamic contents.During the second project phase especially the meta-database was integrated and activities formetadata entry were coordinated. Respective metadata search and data request functionalitieswere installed on the web site. The documentation and cataloguing of decentralised stored datasetswere complemented by collection of relevant datasets for central storage in order to assuredata generated within IMPETUS.
270IMPETUS Subproject C2Furthermore, the subproject C2 collaborated in general tasks like the maintenance of the website as internal and external communication platform, the technical support to subprojects forGIS application and data format conversion, the design of the “IMPETUS Research Result Atlases”and the editing of the IMPETUS Newsletter.IMPETUS Project DatabaseThe IMPETUS project database contains all information about staff members, contacts, internalmailing lists, IMPETUS publications, available datasets (meta-information’s), events, news, etc.The contents can be updated by staff members of the head office, secretariat or data managementfilling in user friendly forms in Microsoft Access. Automated routines synchronise the entrieswith the MySQL database on the database web server of the University of Cologne. PHP scriptson the web server perform the database connection and the generation of IMPETUS web pageswith dynamic contents in order to make available the up-to-date information for internal users(staff members) and external users (Fig. C2-1).Fig. C2-1:Connection scheme of the IMPETUS Project Database, the web server and users.Meta-databaseThe meta-database is completely integrated in the IMPETUS project database. Fig. C2-2 showsthe included entities and its relations. The entity “Datensätze” forms the core of the complexcatalogue for the documentation of the actual datasets, containing information about identification,content, quality, spatial reference and accessibility. The structure of the IMPETUSmetadatais oriented at international standards like FGDC-STD-001-1998 (FEDERAL GEO-GRAPHIC DATA COMMITEE 2000) and ISO/TC211 19115. A thesaurus (entity “Deskriptoren”)for hierarchical classification is implemented. A list of test sites and instruments (entity“Stationen”) is also linked, which allows the documentation of data provenance from the pro-
Subproject C2 IMPETUS 271prietary IMPETUS measuring networks. Further developments concern the realisation of comfortableinternet search and entry forms. Fig. C2-3 shows the main elements of the internet userinterface within the DATA section of the IMPETUS web page. The IMPETUS staff members fillthe metadata in the entry form, which is submitted to the data manager and released after adequatecontrol. At present about 530 datasets are catalogued.Fig. C2-2:Basis structure of the integrated IMPETUS Project Database. The information on project and staffmembers (centre), the metadata and its related entities (left) and the publication database are integrated(top right). Further contents for the web site like news, events or links can be updated here(down right).For using the web based search and request functions two user groups are distinguished: internalusers, like IMPETUS staff members, and public users. The meta-information itself is accessibleto both user groups. After password identification, staff members also can directly downloaddata, if these are available on the IMPETUS internet server or servers of the involved institutes.Public users primarily do not have download access. For this purpose, a request form facilitatescontact with the data management and the responsible scientist.
272IMPETUS Subproject C2Fig. C2-3:The internet user interface of the meta-database: search form, search result list, metadataset with request / download option and the internal metadata entry form.Central data storageUntil now most of the data itself was stored locally at the involved institutes. To assure data generatedwithin IMPETUS, avoid loss of datasets and guarantee the availability of the data in thefuture, the central storage of data has been extended. In the first instance, central data storagemeans that relevant datasets are transferred to or can be accessed directly by the data management.The datasets generated within IMPETUS subprojects by measuring, collecting, deriving, interpretingor modelling have been defined as primarily relevant for central storage. The datasetswere categorised accordingly (Tab. C2.1). The obligatory transfer of this data from the staffmembers to the data management is ongoing. Other datasets which are not proprietary fromIMPETUS like acquired commercial datasets, data received from other parties and free auxiliarydata, are handed over voluntarily for purposes of internal data exchange.
Subproject C2 IMPETUS 273The centrally stored datasets are made available for internal users by download. Access for externalusers will be implemented by degrees, considering the IMPETUS rules for data exchangewhich aim at protection of the data originators right of primary utilisation of proprietary data.Tab. C2.1:Data origin categories, priorities for central storage and constraints for public circulation. The numbersrepresent the status quo from 01.06.2006. Activities for data transfer to the data management areongoing.Data Origin Categoryacquired (paid) dataset and/or datasetwith commercial license restrictionsmeasured with instruments from theIMPETUS-networks or collected atpermanent test sitescollected in the field, own surveys oranalysis results of samplesreceived from (partner) organisations orprojects, generally with use constraintsproprietary derived, calculated or interpreteddata and/or resultsgenerated by modelling or scenarioapplicationbasis and/or auxiliary data, free andofficial datasets, statistics, information,documents etc.Priority for Central Storage(N° of centrally stored datasets /total N° of datasets in category)low priority(5 / 89)high priority(15 / 41)high priority(89 /130)middle priority(35 / 54)high priority(50 / 77)high priority(19 / 51)middle priority(53 / 96)Use constraints or restrictionsfor public circulationcopyright or license to beconsideredpermission from data originator/ authorpermission from data originator/ authorpermission from other partyrequiredpermission from data originator/ authorpermission from data originator/ authormostly free datasetsInternetThe IMPETUS website (www.impetus.uni-koeln.de) is used for both, public information (presentationof the project, contact information, download area, event list) and internal communicationof IMPETUS members (exchange of intermediate results, travelogues and contact information,internal work forum or file exchange).Tab. C2.2 shows the central contents of the public and internal web pages. During the secondphase, the overview pages for the project and presentations of the subprojects were updated. Informationon members and contacts were continuously maintained. Furthermore, the DATA andPUBLICATION parts were realized, offering access to the metadata and publication database.
274IMPETUS Subproject C2Tab. C2.2:Content overview of the IMPETUS webpage according to authorisationPartPROJECT,BENIN,MOROCCOPARTICIPANTSNEWSPUBLICATIONSDATALINKSContents with public access• Presentation of the project and subprojectwith results• Download of project reports• Digital Atlas Benin• Contact information of participants• List of involved institutes• news• events• daily updated surface weather observationsfor Northern and Central• IMPETUS publication list withdownload• metadata search form• metadata output• data request form• list of links to relevant websitesadditional contents for internal access(password protected)• General information for staff membersand forms• Travel records and reports• Meeting or conference protocols• Material for presentations• Working papers from subprojects,download• Contact database Benin• Entry form for publication• internal search form with additionalcriteria• data download or internal request• metadata entry formGIS, data conversion and digital atlasesThe data management also provided GIS-technology support to the subprojects. Geographicdata, like GPS data collected during field visits are related with survey and analysis data, existinggeographic base information or other thematic layers. This enables better visualisation and theapplication of spatial analysis functions in GIS. For joining data from different subprojects forinterdisciplinary analysis, data has to be consistently transformed in standardised vector or rasterformats, principally using ESRI ArcGIS data formats. For example, the drinking water sourcedatabase from A5 medical subproject contains nearly 1300 entries including GPS position measurementswhich were related to microbiological analysis results for better understanding of contaminationpatterns. An example of data conversion and organisation is the creation of the meteorologicalmeasurements database of Morocco. Originally separate data files containing measurementsfrom 11 climate stations were restructured for the entry in a single MySQL database.The access and output of data is provided on the internal IMPETUS web site which enables theuser to download the data after selection of the specific station, the time period and the requiredmeteorological parameters.Furthermore, conceptual and organisational contributions to the preparation of the IMPETUSResearch Result Atlases were made. The purpose for the atlases arises from the need for publish-
Subproject C2 IMPETUS 275ing basic data and relevant results in a user friendly form for non-experts and with open accessfor all interested people. The data management collaborated with scientist from several subprojectsin the development of thematic maps.NewsletterThe newsletter is released every 1 - 2month by the IMPETUS head office. Thesubproject C2 performs the editorialtasks and the layout. All IMPETUS participantsreceive the newsletter via emailor download from the web page.The scientific and technical articles promoteexchange of expertise between thedisciplines and the subprojects. Additionaltopics are current developmentswithin the project, organisational informationor the announcement of events.Until now, annually a French editioncovering the most important articles wasprovided respectively for Benin and Morocco.LiteratureFederal Geographic Data Commitee (2000): Content Standard for Digital Geospatial Metadata Workbook Version 2.0. FederalGeographic Data Committee. Washington, D.C.
276IMPETUS IMPETUS AtlasesVIIIMPETUS-Atlanten / IMPETUS atlasesPurpose of the IMPETUS atlasThe IMPETUS project gathers many scientists from different disciplinary backgrounds. The varietyof research findings in IMPETUS is a rich reservoir of useful information for public authoritieson the national, regional and local level. The information can facilitate the analysis ofspecific problems and support political decision-making processes in both countries.The way the research results are presented is of great importance for their successful transfer intopractical decision-making processes. The presentation needs to be to be compact, quickly accessibleand easy to understand. Furthermore, a certain degree of flexibility is needed to serve differentuser needs at the national, regional and local level. The aim of the IMPETUS atlas is todocument the most relevant research findings of the IMPETUS project for Morocco and makesthem thus accessible for a wider audience. Decision-makers and other interested parties can get ageneral overview of the research findings and are able to assess their relevance for specific policyprocesses and analyses of all kind.In the second project phase the IMPETUS partners produced an IMPETUS atlas in a digital andin a printed version, both for Benin and Morocco. The idea and concept for the atlas were developedby Hans-Peter Thamm who was also responsible for the management of the Benin atlas.The production of the Morocco atlas was managed by Annekathrin Jaeger. Ralf Hoffmann, DennisPrangenberg, Phillip Recha and Oliver Schütz made major contributions. This atlas remains,however, a common product of all IMPETUS partners, since it contains results from all researchgroups.In the following, single topics and related major results are presented and shortly explained. Furthermorethe reader is hinted to publications for further reading.According to the different spatial scales that are used within the IMPETUS project the atlas isdivided into four parts:Part 1 documents results that are of central relevance for West-Africa in totalPart 2 presents the most relevant results for the Drâa catchment (atlas Morocco) and whole Benin(atlas Benin)Part 3 contains results for the Upper Drâa catchment (atlas Morocco) and Upper Ouémé catchment(atlas Benin)Part 4 shows results from case studiesThe printed atlasThe atlas is printed in A3-format. It is organized as a loose-leaf collection. This format allows totake out maps and to compare them individually. It furthermore makes it easy to complete theatlas with new maps or results from related research projects, according to the needs of the singleuser.
IMPETUS Atlases IMPETUS 277Fig. VII-1a: Examples of the IMPETUS atlas: a) Front side of a mapFig. VII-1b: Example of case study: Ethnic groups in BeninFig. VII-1c: Back side of a map with additional explanations
278IMPETUS IMPETUS AtlasesThe single leaves have an identical structure. At the front side the visualisation of research resultsis printed, for example in form of a map with legend and information regarding authors(Fig. VII-1a). In addition to that map case studies are presented that highlight different aspects ofa specific topic with several maps and short texts in more detail (Fig. VII-1b). On the back sidethe reader finds further information regarding the analysed topic, as for example in most casesinformation on the model that as used, the data basis and the related literature that allows forfurther reading. Thus the reader is able to understand the methodical approach of analysis. Inaddition useful information is presented in form of graphs, tables or figures (Fig. VII-1c).The printed atlas can, however, only show a selection of the manifold research findings. Otherwiseits format would become too comprehensive and too difficult to use. To provide users witha full presentation of all research results, we created a digital atlas. A complete overview can befound on the IMPETUS website, too.The digital atlasThe interactive digital IMPETUS atlas is conceptualised in a user-friendly way. It requires noknowledge of specific software or models or other computer knowledge. The atlas format enablesthe integration of raster files, esri-shape-files and pdf- and html-files. It is programmed inJava and can be run independent of any platform via an internet browser that has the relevantJAVA installed. Due to the programming in Java the atlas can be easily integrated into the internet(e.g. “IMPETUS Interactive Digital Atlas of Benin – Research Results” at the followingURL: http://www.impetus.uni-koeln.de/impetus.php?show=En_Be_At). Thus it can be used inthe day-to-day work of public authorities, but also universities and other research organisations.Advanced users can also add own maps or delete specific maps. The whole content of a map canbe changed without having to change program codes. This requires only the change of a few textfiles.Starting the program opens a GIS-like interactive viewer. Via its menus the user can open thematicmaps and pdf-files (Fig. Atl-2). After having activated a thematic area in the thematic windowin the upper left part of the website the relevant maps are presented, plus the related legend.The help-function explains all functions of the atlas.Furthermore we have implemented functions for the analysis and comparison of results of theIMPETUS project: The single layers of the thematic maps can be deactivated and re-activated.Different thematic maps can be laid onto each other. Maps with different scales can be combinedin this way (Fig. Atl-2). Via an info-button the user can request further information on data,models, authors, text sources and literature for further reading (similar to the back sides of themaps in the printed atlas (Fig. Atl-3). The atlas contains a zoom-function that allows for a moredetailed map viewing. It also enables the user to shift single maps.Several maps have specific functions, where further information on single topics is presented.For example, the menu Benin / mean rainfall shows for the area of climate stations an overviewof the climate stations in Benin. By clicking on the points, which represent the respective measurementstations, the user gets information on the annual distribution of precipitation (Fig. VII-4). In other maps the user is provided with photos.
IMPETUS Atlases IMPETUS 279Fig. VII-2: The digital atlas: Opening single thematic maps and activation of thelayer enables the representation of maps.Fig. VII-3:The digital atlas: Further information on authors, methods, models used etccan be requested for the single maps
280IMPETUS IMPETUS AtlasesFig. VII-4:The digital atlas: Several layers have specific functions. Ticking the boxclimate stations makes the precipitation diagrams visible.The IMPETUS atlases have been presented and discussed at several occasions in Benin and Morocco,most recently at the workshop „Modélisation et SIG” in November 2005 in Ouarzazate,Morocco. The chosen approach has proven its usefulness and functionality. Both the Moroccoand Benin atlas have been welcomed by the project partners in Morocco and Benin. They expressedtheir expectation, that the atlas can indeed give important support for planning- and decision-makingprocesses in both regions.LiteratureThamm, H.-P.; Schütz, O., Christoph, M (Publishers) 2005: IMPETUS Atlas - Benin - Research Results. Bonn, PublishingHouse: University of Bonn, REMOTE SENSING RESEARCH GROUP, ISBN 3-9810311-2-1.