
Create successful ePaper yourself
Turn your PDF publications into a flip-book with our unique Google optimized e-Paper software.
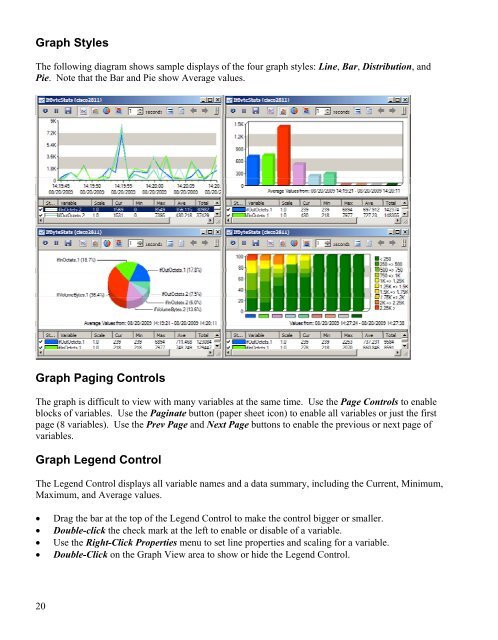
Graph StylesThe following diagram shows sample displays of the four graph styles: Line, Bar, Distribution, andPie. Note that the Bar and Pie show Average values.Graph Paging ControlsThe graph is difficult to view with many variables at the same time. Use the Page Controls to enableblocks of variables. Use the Paginate button (paper sheet icon) to enable all variables or just the firstpage (8 variables). Use the Prev Page and Next Page buttons to enable the previous or next page ofvariables.Graph Legend ControlThe Legend Control displays all variable names and a data summary, including the Current, Minimum,Maximum, and Average values.• Drag the bar at the top of the Legend Control to make the control bigger or smaller.• Double-click the check mark at the left to enable or disable of a variable.• Use the Right-Click Properties menu to set line properties and scaling for a variable.• Double-Click on the Graph View area to show or hide the Legend Control.20