
You also want an ePaper? Increase the reach of your titles
YUMPU automatically turns print PDFs into web optimized ePapers that Google loves.
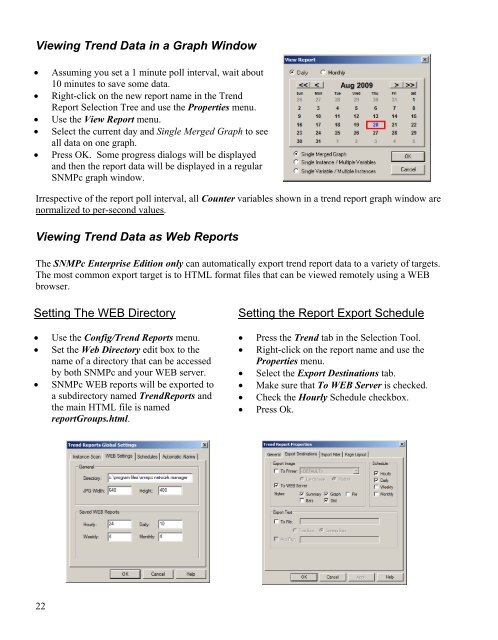
Viewing Trend Data in a Graph Window• Assuming you set a 1 minute poll interval, wait about10 minutes to save some data.• Right-click on the new report name in the TrendReport Selection Tree and use the Properties menu.• Use the View Report menu.• Select the current day and Single Merged Graph to seeall data on one graph.• Press OK. Some progress dialogs will be displayedand then the report data will be displayed in a regular<strong>SNMPc</strong> graph window.Irrespective of the report poll interval, all Counter variables shown in a trend report graph window arenormalized to per-second values.Viewing Trend Data as Web ReportsThe <strong>SNMPc</strong> Enterprise Edition only can automatically export trend report data to a variety of targets.The most common export target is to HTML format files that can be viewed remotely using a WEBbrowser.Setting The WEB DirectorySetting the Report Export Schedule• Use the Config/Trend Reports menu. • Press the Trend tab in the Selection Tool.• Set the Web Directory edit box to thename of a directory that can be accessed• Right-click on the report name and use theProperties menu.by both <strong>SNMPc</strong> and your WEB server. • Select the Export Destinations tab.• <strong>SNMPc</strong> WEB reports will be exported toa subdirectory named TrendReports andthe main HTML file is namedreportGroups.html.• Make sure that To WEB Server is checked.• Check the Hourly Schedule checkbox.• Press Ok.22