a growing experience - Student Services - University of Melbourne
a growing experience - Student Services - University of Melbourne
a growing experience - Student Services - University of Melbourne

You also want an ePaper? Increase the reach of your titles
YUMPU automatically turns print PDFs into web optimized ePapers that Google loves.
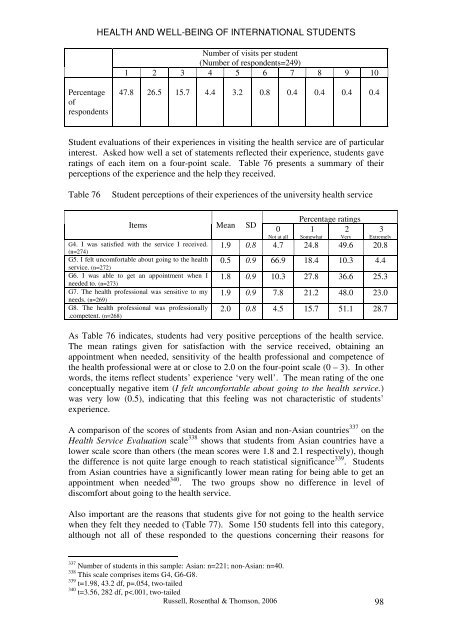
HEALTH AND WELL-BEING OF INTERNATIONAL STUDENTSNumber <strong>of</strong> visits per student(Number <strong>of</strong> respondents=249)1 2 3 4 5 6 7 8 9 10Percentage<strong>of</strong>respondents47.8 26.5 15.7 4.4 3.2 0.8 0.4 0.4 0.4 0.4<strong>Student</strong> evaluations <strong>of</strong> their <strong>experience</strong>s in visiting the health service are <strong>of</strong> particularinterest. Asked how well a set <strong>of</strong> statements reflected their <strong>experience</strong>, students gaveratings <strong>of</strong> each item on a four-point scale. Table 76 presents a summary <strong>of</strong> theirperceptions <strong>of</strong> the <strong>experience</strong> and the help they received.Table 76<strong>Student</strong> perceptions <strong>of</strong> their <strong>experience</strong>s <strong>of</strong> the university health serviceItems Mean SDG4. I was satisfied with the service I received.(n=274)G5. I felt uncomfortable about going to the healthservice. (n=272)G6. I was able to get an appointment when Ineeded to. (n=273)G7. The health pr<strong>of</strong>essional was sensitive to myneeds. (n=269)G8. The health pr<strong>of</strong>essional was pr<strong>of</strong>essionally.competent. (n=268)0Not at allPercentage ratings1Somewhat2Very3Extremely1.9 0.8 4.7 24.8 49.6 20.80.5 0.9 66.9 18.4 10.3 4.41.8 0.9 10.3 27.8 36.6 25.31.9 0.9 7.8 21.2 48.0 23.02.0 0.8 4.5 15.7 51.1 28.7As Table 76 indicates, students had very positive perceptions <strong>of</strong> the health service.The mean ratings given for satisfaction with the service received, obtaining anappointment when needed, sensitivity <strong>of</strong> the health pr<strong>of</strong>essional and competence <strong>of</strong>the health pr<strong>of</strong>essional were at or close to 2.0 on the four-point scale (0 – 3). In otherwords, the items reflect students’ <strong>experience</strong> ‘very well’. The mean rating <strong>of</strong> the oneconceptually negative item (I felt uncomfortable about going to the health service.)was very low (0.5), indicating that this feeling was not characteristic <strong>of</strong> students’<strong>experience</strong>.A comparison <strong>of</strong> the scores <strong>of</strong> students from Asian and non-Asian countries 337 on theHealth Service Evaluation scale 338 shows that students from Asian countries have alower scale score than others (the mean scores were 1.8 and 2.1 respectively), thoughthe difference is not quite large enough to reach statistical significance 339 . <strong>Student</strong>sfrom Asian countries have a significantly lower mean rating for being able to get anappointment when needed 340 . The two groups show no difference in level <strong>of</strong>discomfort about going to the health service.Also important are the reasons that students give for not going to the health servicewhen they felt they needed to (Table 77). Some 150 students fell into this category,although not all <strong>of</strong> these responded to the questions concerning their reasons for337 Number <strong>of</strong> students in this sample: Asian: n=221; non-Asian: n=40.338 This scale comprises items G4, G6-G8.339 t=1.98, 43.2 df, p=.054, two-tailed340 t=3.56, 282 df, p