a growing experience - Student Services - University of Melbourne
a growing experience - Student Services - University of Melbourne
a growing experience - Student Services - University of Melbourne

You also want an ePaper? Increase the reach of your titles
YUMPU automatically turns print PDFs into web optimized ePapers that Google loves.
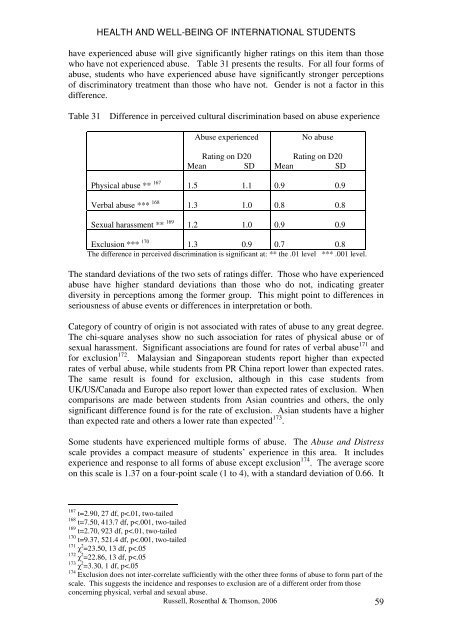
HEALTH AND WELL-BEING OF INTERNATIONAL STUDENTShave <strong>experience</strong>d abuse will give significantly higher ratings on this item than thosewho have not <strong>experience</strong>d abuse. Table 31 presents the results. For all four forms <strong>of</strong>abuse, students who have <strong>experience</strong>d abuse have significantly stronger perceptions<strong>of</strong> discriminatory treatment than those who have not. Gender is not a factor in thisdifference.Table 31Difference in perceived cultural discrimination based on abuse <strong>experience</strong>Abuse <strong>experience</strong>dRating on D20Mean SDNo abuseRating on D20Mean SDPhysical abuse ** 167 1.5 1.1 0.9 0.9Verbal abuse *** 168 1.3 1.0 0.8 0.8Sexual harassment ** 169 1.2 1.0 0.9 0.9Exclusion *** 170 1.3 0.9 0.7 0.8The difference in perceived discrimination is significant at: ** the .01 level *** .001 level.The standard deviations <strong>of</strong> the two sets <strong>of</strong> ratings differ. Those who have <strong>experience</strong>dabuse have higher standard deviations than those who do not, indicating greaterdiversity in perceptions among the former group. This might point to differences inseriousness <strong>of</strong> abuse events or differences in interpretation or both.Category <strong>of</strong> country <strong>of</strong> origin is not associated with rates <strong>of</strong> abuse to any great degree.The chi-square analyses show no such association for rates <strong>of</strong> physical abuse or <strong>of</strong>sexual harassment. Significant associations are found for rates <strong>of</strong> verbal abuse 171 andfor exclusion 172 . Malaysian and Singaporean students report higher than expectedrates <strong>of</strong> verbal abuse, while students from PR China report lower than expected rates.The same result is found for exclusion, although in this case students fromUK/US/Canada and Europe also report lower than expected rates <strong>of</strong> exclusion. Whencomparisons are made between students from Asian countries and others, the onlysignificant difference found is for the rate <strong>of</strong> exclusion. Asian students have a higherthan expected rate and others a lower rate than expected 173 .Some students have <strong>experience</strong>d multiple forms <strong>of</strong> abuse. The Abuse and Distressscale provides a compact measure <strong>of</strong> students’ <strong>experience</strong> in this area. It includes<strong>experience</strong> and response to all forms <strong>of</strong> abuse except exclusion 174 . The average scoreon this scale is 1.37 on a four-point scale (1 to 4), with a standard deviation <strong>of</strong> 0.66. It167 t=2.90, 27 df, p