a growing experience - Student Services - University of Melbourne
a growing experience - Student Services - University of Melbourne
a growing experience - Student Services - University of Melbourne

Create successful ePaper yourself
Turn your PDF publications into a flip-book with our unique Google optimized e-Paper software.
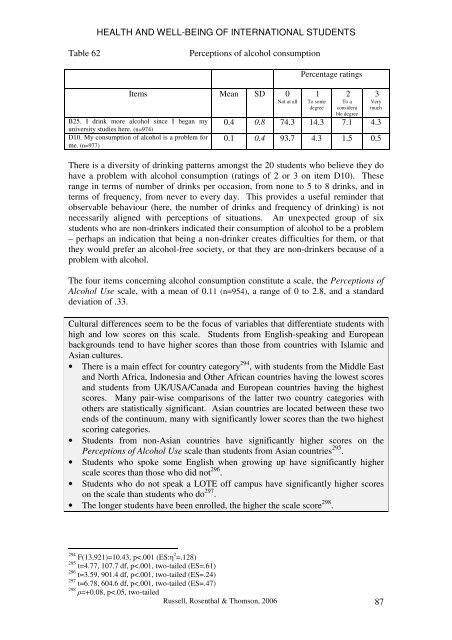
HEALTH AND WELL-BEING OF INTERNATIONAL STUDENTSTable 62Perceptions <strong>of</strong> alcohol consumptionItems Mean SD 0Not at allB25. I drink more alcohol since I began myuniversity studies here. (n=974)D10. My consumption <strong>of</strong> alcohol is a problem forme. (n=977)Percentage ratings1To somedegree2To aconsiderable degree3Verymuch0.4 0.8 74.3 14.3 7.1 4.30.1 0.4 93.7 4.3 1.5 0.5There is a diversity <strong>of</strong> drinking patterns amongst the 20 students who believe they dohave a problem with alcohol consumption (ratings <strong>of</strong> 2 or 3 on item D10). Theserange in terms <strong>of</strong> number <strong>of</strong> drinks per occasion, from none to 5 to 8 drinks, and interms <strong>of</strong> frequency, from never to every day. This provides a useful reminder thatobservable behaviour (here, the number <strong>of</strong> drinks and frequency <strong>of</strong> drinking) is notnecessarily aligned with perceptions <strong>of</strong> situations. An unexpected group <strong>of</strong> sixstudents who are non-drinkers indicated their consumption <strong>of</strong> alcohol to be a problem– perhaps an indication that being a non-drinker creates difficulties for them, or thatthey would prefer an alcohol-free society, or that they are non-drinkers because <strong>of</strong> aproblem with alcohol.The four items concerning alcohol consumption constitute a scale, the Perceptions <strong>of</strong>Alcohol Use scale, with a mean <strong>of</strong> 0.11 (n=954), a range <strong>of</strong> 0 to 2.8, and a standarddeviation <strong>of</strong> .33.Cultural differences seem to be the focus <strong>of</strong> variables that differentiate students withhigh and low scores on this scale. <strong>Student</strong>s from English-speaking and Europeanbackgrounds tend to have higher scores than those from countries with Islamic andAsian cultures.• There is a main effect for country category 294 , with students from the Middle Eastand North Africa, Indonesia and Other African countries having the lowest scoresand students from UK/USA/Canada and European countries having the highestscores. Many pair-wise comparisons <strong>of</strong> the latter two country categories withothers are statistically significant. Asian countries are located between these twoends <strong>of</strong> the continuum, many with significantly lower scores than the two highestscoring categories.• <strong>Student</strong>s from non-Asian countries have significantly higher scores on thePerceptions <strong>of</strong> Alcohol Use scale than students from Asian countries 295 .• <strong>Student</strong>s who spoke some English when <strong>growing</strong> up have significantly higherscale scores than those who did not 296 .• <strong>Student</strong>s who do not speak a LOTE <strong>of</strong>f campus have significantly higher scoreson the scale than students who do 297 .• The longer students have been enrolled, the higher the scale score 298 .294 F(13,921)=10.43, p